Mars Signals - Ultimate Institutional Suite v3.0(Joker)Comprehensive Trading Manual
Mars Signals – Ultimate Institutional Suite v3.0 (Joker)
## Chapter 1 – Philosophy & System Architecture
This script is not a simple “buy/sell” indicator.
Mars Signals – UIS v3.0 (Joker) is designed as an institutional-style analytical assistant that layers several methodologies into a single, coherent framework.
The system is built on four core pillars:
1. Smart Money Concepts (SMC)
- Detection of Order Blocks (professional demand/supply zones).
- Detection of Fair Value Gaps (FVGs) (price imbalances).
2. Smart DCA Strategy
- Combination of RSI and Bollinger Bands
- Identifies statistically discounted zones for scaling into spot positions or exiting shorts.
3. Volume Profile (Visible Range Simulation)
- Distribution of volume by price, not by time.
- Identification of POC (Point of Control) and high-/low-volume areas.
4. Wyckoff Helper – Spring
- Detection of bear traps, liquidity grabs, and sharp bullish reversals.
All four pillars feed into a Confluence Engine (Scoring System).
The final output is presented in the Dashboard, with a clear, human-readable signal:
- STRONG LONG 🚀
- WEAK LONG ↗
- NEUTRAL / WAIT
- WEAK SHORT ↘
- STRONG SHORT 🩸
This allows the trader to see *how many* and *which* layers of the system support a bullish or bearish bias at any given time.
## Chapter 2 – Settings Overview
### 2.1 General & Dashboard Group
- Show Dashboard Panel (`show_dash`)
Turns the dashboard table in the corner of the chart ON/OFF.
- Show Signal Recommendation (`show_rec`)
- If enabled, the textual signal (STRONG LONG, WEAK SHORT, etc.) is displayed.
- If disabled, you only see feature status (ON/OFF) and the current price.
- Dashboard Position (`dash_pos`)
Determines where the dashboard appears on the chart:
- `Top Right`
- `Bottom Right`
- `Top Left`
### 2.2 Smart Money (SMC) Group
- Enable SMC Strategy (`show_smc`)
Globally enables or disables the Order Block and FVG logic.
- Order Block Pivot Lookback (`ob_period`)
Main parameter for detecting key pivot highs/lows (swing points).
- Default value: 5
- Concept:
A bar is considered a pivot low if its low is lower than the lows of the previous 5 and the next 5 bars.
Similarly, a pivot high has a high higher than the previous 5 and the next 5 bars.
These pivots are used as anchors for Order Blocks.
- Increasing `ob_period`:
- Fewer levels.
- But levels tend to be more significant and reliable.
- In highly volatile markets (major news, war events, FOMC, etc.),
using values 7–10 is recommended to filter out weak levels.
- Show Fair Value Gaps (`show_fvg`)
Enables/disables the drawing of FVG zones (imbalances).
- Bullish OB Color (`c_ob_bull`)
- Color of Bullish Order Blocks (Demand Zones).
- Default: semi-transparent green (transparency ≈ 80).
- Bearish OB Color (`c_ob_bear`)
- Color of Bearish Order Blocks (Supply Zones).
- Default: semi-transparent red.
- Bullish FVG Color (`c_fvg_bull`)
- Color of Bullish FVG (upward imbalance), typically yellow.
- Bearish FVG Color (`c_fvg_bear`)
- Color of Bearish FVG (downward imbalance), typically purple.
### 2.3 Smart DCA Strategy Group
- Enable DCA Zones (`show_dca`)
Enables the Smart DCA logic and visual labels.
- RSI Length (`rsi_len`)
Lookback period for RSI (default: 14).
- Shorter → more sensitive, more noise.
- Longer → fewer signals, higher reliability.
- Bollinger Bands Length (`bb_len`)
Moving average period for Bollinger Bands (default: 20).
- BB Multiplier (`bb_mult`)
Standard deviation multiplier for Bollinger Bands (default: 2.0).
- For extremely volatile markets, values like 2.5–3.0 can be used so that only extreme deviations trigger a DCA signal.
### 2.4 Volume Profile (Visible Range Sim) Group
- Show Volume Profile (`show_vp`)
Enables the simulated Volume Profile bars on the right side of the chart.
- Volume Lookback Bars (`vp_lookback`)
Number of bars used to compute the Volume Profile (default: 150).
- Higher values → broader historical context, heavier computation.
- Row Count (`vp_rows`)
Number of vertical price segments (rows) to divide the total price range into (default: 30).
- Width (%) (`vp_width`)
Relative width of each volume bar as a percentage.
In the code, bar widths are scaled relative to the row with the maximum volume.
> Technical note: Volume Profile calculations are executed only on the last bar (`barstate.islast`) to keep the script performant even on higher timeframes.
### 2.5 Wyckoff Helper Group
- Show Wyckoff Events (`show_wyc`)
Enables detection and plotting of Wyckoff Spring events.
- Volume MA Length (`vol_ma_len`)
Length of the moving average on volume.
A bar is considered to have Ultra Volume if its volume is more than 2× the volume MA.
## Chapter 3 – Smart Money Strategy (Order Blocks & FVG)
### 3.1 What Is an Order Block?
An Order Block (OB) represents the footprint of large institutional orders:
- Bullish Order Block (Demand Zone)
The last selling region (bearish candle/cluster) before a strong upward move.
- Bearish Order Block (Supply Zone)
The last buying region (bullish candle/cluster) before a strong downward move.
Institutions and large players place heavy orders in these regions. Typical price behavior:
- Price moves away from the zone.
- Later returns to the same zone to fill unfilled orders.
- Then continues the larger trend.
In the script:
- If `pl` (pivot low) forms → a Bullish OB is created.
- If `ph` (pivot high) forms → a Bearish OB is created.
The box is drawn:
- From `bar_index ` to `bar_index`.
- Between `low ` and `high `.
- `extend=extend.right` extends the OB into the future, so it acts as a dynamic support/resistance zone.
- Only the last 4 OB boxes are kept to avoid clutter.
### 3.2 Order Block Color Guide
- Semi-transparent Green (`c_ob_bull`)
- Represents a Bullish Order Block (Demand Zone).
- Interpretation: a price region with a high probability of bullish reaction.
- Semi-transparent Red (`c_ob_bear`)
- Represents a Bearish Order Block (Supply Zone).
- Interpretation: a price region with a high probability of bearish reaction.
Overlap (Multiple OBs in the Same Area)
When two or more Order Blocks overlap:
- The shared area appears visually denser/stronger.
- This suggests higher order density.
- Such zones can be treated as high-priority levels for entries, exits, and stop-loss placement.
### 3.3 Demand/Supply Logic in the Scoring Engine
is_in_demand = low <= ta.lowest(low, 20)
is_in_supply = high >= ta.highest(high, 20)
- If current price is near the lowest lows of the last 20 bars, it is considered in a Demand Zone → positive impact on score.
- If current price is near the highest highs of the last 20 bars, it is considered in a Supply Zone → negative impact on score.
This logic complements Order Blocks and helps the Dashboard distinguish whether:
- Market is currently in a statistically cheap (long-friendly) area, or
- In a statistically expensive (short-friendly) area.
### 3.4 Fair Value Gaps (FVG)
#### Concept
When the market moves aggressively:
- Some price levels are skipped and never traded.
- A gap between wicks/shadows of consecutive candles appears.
- These regions are called Fair Value Gaps (FVGs) or Imbalances.
The market generally “dislikes” imbalance and often:
- Returns to these zones in the future.
- Fills the gap (rebalance).
- Then resumes its dominant direction.
#### Implementation in the Code
Bullish FVG (Yellow)
fvg_bull_cond = show_smc and show_fvg and low > high and close > high
if fvg_bull_cond
box.new(bar_index , high , bar_index, low, ...)
Core condition:
`low > high ` → the current low is above the high of two bars ago; the space between them is an untraded gap.
Bearish FVG (Purple)
fvg_bear_cond = show_smc and show_fvg and high < low and close < low
if fvg_bear_cond
box.new(bar_index , low , bar_index, high, ...)
Core condition:
`high < low ` → the current high is below the low of two bars ago; again a price gap exists.
#### FVG Color Guide
- Transparent Yellow (`c_fvg_bull`) – Bullish FVG
Often acts like a magnet for price:
- Price tends to retrace into this zone,
- Fill the imbalance,
- And then continue higher.
- Transparent Purple (`c_fvg_bear`) – Bearish FVG
Price tends to:
- Retrace upward into the purple area,
- Fill the imbalance,
- And then resume downward movement.
#### Trading with FVGs
- FVGs are *not* standalone entry signals.
They are best used as:
- Targets (take-profit zones), or
- Reaction areas where you expect a pause or reversal.
Examples:
- If you are long, a bearish FVG above is often an excellent take-profit zone.
- If you are short, a bullish FVG below is often a good cover/exit zone.
### 3.5 Core SMC Trading Templates
#### Reversal Long
1. Price trades down into a green Order Block (Demand Zone).
2. A bullish confirmation candle (Close > Open) forms inside or just above the OB.
3. If this zone is close to or aligned with a bullish FVG (yellow), the signal is reinforced.
4. Entry:
- At the close of the confirmation candle, or
- Using a limit order near the upper boundary of the OB.
5. Stop-loss:
- Slightly below the OB.
- If the OB is broken decisively and price consolidates below it, the zone loses validity.
6. Targets:
- The next FVG,
- Or the next red Order Block (Supply Zone) above.
#### Reversal Short
The mirror scenario:
- Price rallies into a red Order Block (Supply).
- A bearish confirmation candle forms (Close < Open).
- FVG/premium structure above can act as a confluence.
- Stop-loss goes above the OB.
- Targets: lower FVGs or subsequent green OBs below.
## Chapter 4 – Smart DCA Strategy (RSI + Bollinger Bands)
### 4.1 Smart DCA Concept
- Classic DCA = buying at fixed time intervals regardless of price.
- Smart DCA = scaling in only when:
- Price is statistically cheaper than usual, and
- The market is in a clear oversold condition.
Code logic:
rsi_val = ta.rsi(close, rsi_len)
= ta.bb(close, bb_len, bb_mult)
dca_buy = show_dca and rsi_val < 30 and close < bb_lower
dca_sell = show_dca and rsi_val > 70 and close > bb_upper
Conditions:
- DCA Buy – Smart Scale-In Zone
- RSI < 30 → oversold.
- Close < lower Bollinger Band → price has broken below its typical volatility envelope.
- DCA Sell – Overbought/Distribution Zone
- RSI > 70 → overbought.
- Close > upper Bollinger Band → price is extended far above the mean.
### 4.2 Visual Representation on the Chart
- Green “DCA” Label Below Candle
- Shape: `labelup`.
- Color: lime background, white text.
- Meaning: statistically attractive level for laddered spot entries or short exits.
- Red “SELL” Label Above Candle
- Warning that the market is in an extended, overbought condition.
- Suitable for profit-taking on longs or considering short entries (with proper confluence and risk management).
- Light Green Background (`bgcolor`)
- When `dca_buy` is true, the candle background turns very light green (high transparency).
- This helps visually identify DCA Zones across the chart at a glance.
### 4.3 Practical Use in Trading
#### Spot Trading
Used to build a better average entry price:
- Every time a DCA label appears, allocate a fixed portion of capital (e.g., 2–5%).
- Combining DCA signals with:
- Green OBs (Demand Zones), and/or
- The Volume Profile POC
makes the zone structurally more important.
#### Futures Trading
- Longs
- Use DCA Buy signals as low-risk zones for opening or adding to longs when:
- Price is inside a green OB, or
- The Dashboard already leans LONG.
- Shorts
- Use DCA Sell signals as:
- Exit zones for longs, or
- Areas to initiate shorts with stops above structural highs.
## Chapter 5 – Volume Profile (Visible Range Simulation)
### 5.1 Concept
Traditional volume (histogram under the chart) shows volume over time.
Volume Profile shows volume by price level:
- At which prices has the highest trading activity occurred?
- Where did buyers and sellers agree the most (High Volume Nodes – HVNs)?
- Where did price move quickly due to low participation (Low Volume Nodes – LVNs)?
### 5.2 Implementation in the Script
Executed only when `show_vp` is enabled and on the last bar:
1. The last `vp_lookback` bars (default 150) are processed.
2. The minimum low and maximum high over this window define the price range.
3. This price range is divided into `vp_rows` segments (e.g., 30 rows).
4. For each row:
- All bars are scanned.
- If the mid-price `(high + low ) / 2` falls inside a row, that bar’s volume is added to the row total.
5. The row with the greatest volume is stored as `max_vol_idx` (the POC row).
6. For each row, a volume box is drawn on the right side of the chart.
### 5.3 Color Scheme
- Semi-transparent Orange
- The row with the maximum volume – the Point of Control (POC).
- Represents the strongest support/resistance level from a volume perspective.
- Semi-transparent Blue
- Other volume rows.
- The taller the bar → the higher the volume → the stronger the interest at that price band.
### 5.4 Trading Applications
- If price is above POC and retraces back into it:
→ POC often acts as support, suitable for long setups.
- If price is below POC and rallies into it:
→ POC often acts as resistance, suitable for short setups or profit-taking.
HVNs (Tall Blue Bars)
- Represent areas of equilibrium where the market has spent time and traded heavily.
- Price tends to consolidate here before choosing a direction.
LVNs (Short or Nearly Empty Bars)
- Represent low participation zones.
- Price often moves quickly through these areas – useful for targeting fast moves.
## Chapter 6 – Wyckoff Helper – Spring
### 6.1 Spring Concept
In the Wyckoff framework:
- A Spring is a false break of support.
- The market briefly trades below a well-defined support level, triggers stop losses,
then sharply reverses upward as institutional buyers absorb liquidity.
This movement:
- Clears out weak hands (retail sellers).
- Provides large players with liquidity to enter long positions.
- Often initiates a new uptrend.
### 6.2 Code Logic
Conditions for a Spring:
1. The current low is lower than the lowest low of the previous 50 bars
→ apparent break of a long-standing support.
2. The bar closes bullish (Close > Open)
→ the breakdown was rejected.
3. Volume is significantly elevated:
→ `volume > 2 × volume_MA` (Ultra Volume).
When all conditions are met and `show_wyc` is enabled:
- A pink diamond is plotted below the bar,
- With the label “Spring” – one of the strongest long signals in this system.
### 6.3 Trading Use
- After a valid Spring, markets frequently enter a meaningful bullish phase.
- The highest quality setups occur when:
- The Spring forms inside a green Order Block, and
- Near or on the Volume Profile POC.
Entries:
- At the close of the Spring bar, or
- On the first pullback into the mid-range of the Spring candle.
Stop-loss:
- Slightly below the Spring’s lowest point (wick low plus a small buffer).
## Chapter 7 – Confluence Engine & Dashboard
### 7.1 Scoring Logic
For each bar, the script:
1. Resets `score` to 0.
2. Adjusts the score based on different signals.
SMC Contribution
if show_smc
if is_in_demand
score += 1
if is_in_supply
score -= 1
- Being in Demand → `+1`
- Being in Supply → `-1`
DCA Contribution
if show_dca
if dca_buy
score += 2
if dca_sell
score -= 2
- DCA Buy → `+2` (strong, statistically driven long signal)
- DCA Sell → `-2`
Wyckoff Spring Contribution
if show_wyc
if wyc_spring
score += 2
- Spring → `+2` (entry of strong money)
### 7.2 Mapping Score to Dashboard Signal
- score ≥ 2 → STRONG LONG 🚀
Multiple bullish conditions aligned.
- score = 1 → WEAK LONG ↗
Some bullish bias, but only one layer clearly positive.
- score = 0 → NEUTRAL / WAIT
Rough balance between buying and selling forces; staying flat is usually preferable.
- score = -1 → WEAK SHORT ↘
Mild bearish bias, suited for cautious or short-term plays.
- score ≤ -2 → STRONG SHORT 🩸
Convergence of several bearish signals.
### 7.3 Dashboard Structure
The dashboard is a two-column table:
- Row 0
- Column 0: `"Mars Signals"` – black background, white text.
- Column 1: `"UIS v3.0"` – black background, yellow text.
- Row 1
- Column 0: `"Price:"` (light grey background).
- Column 1: current closing price (`close`) with a semi-transparent blue background.
- Row 2
- Column 0: `"SMC:"`
- Column 1:
- `"ON"` (green) if `show_smc = true`
- `"OFF"` (grey) otherwise.
- Row 3
- Column 0: `"DCA:"`
- Column 1:
- `"ON"` (green) if `show_dca = true`
- `"OFF"` (grey) otherwise.
- Row 4
- Column 0: `"Signal:"`
- Column 1: signal text (`status_txt`) with background color `status_col`
(green, red, teal, maroon, etc.)
- If `show_rec = false`, these cells are cleared.
## Chapter 8 – Visual Legend (Colors, Shapes & Actions)
For quick reading inside TradingView, the visual elements are described line by line instead of a table.
Chart Element: Green Box
Color / Shape: Transparent green rectangle
Core Meaning: Bullish Order Block (Demand Zone)
Suggested Trader Response: Look for longs, Smart DCA adds, closing or reducing shorts.
Chart Element: Red Box
Color / Shape: Transparent red rectangle
Core Meaning: Bearish Order Block (Supply Zone)
Suggested Trader Response: Look for shorts, or take profit on existing longs.
Chart Element: Yellow Area
Color / Shape: Transparent yellow zone
Core Meaning: Bullish FVG / upside imbalance
Suggested Trader Response: Short take-profit zone or expected rebalance area.
Chart Element: Purple Area
Color / Shape: Transparent purple zone
Core Meaning: Bearish FVG / downside imbalance
Suggested Trader Response: Long take-profit zone or temporary supply region.
Chart Element: Green "DCA" Label
Color / Shape: Green label with white text, plotted below the candle
Core Meaning: Smart ladder-in buy zone, DCA buy opportunity
Suggested Trader Response: Spot DCA entry, partial short exit.
Chart Element: Red "SELL" Label
Color / Shape: Red label with white text, plotted above the candle
Core Meaning: Overbought / distribution zone
Suggested Trader Response: Take profit on longs, consider initiating shorts.
Chart Element: Light Green Background (bgcolor)
Color / Shape: Very transparent light-green background behind bars
Core Meaning: Active DCA Buy zone
Suggested Trader Response: Treat as a discount zone on the chart.
Chart Element: Orange Bar on Right
Color / Shape: Transparent orange horizontal bar in the volume profile
Core Meaning: POC – price with highest traded volume
Suggested Trader Response: Strong support or resistance; key reference level.
Chart Element: Blue Bars on Right
Color / Shape: Transparent blue horizontal bars in the volume profile
Core Meaning: Other volume levels, showing high-volume and low-volume nodes
Suggested Trader Response: Use to identify balance zones (HVN) and fast-move corridors (LVN).
Chart Element: Pink "Spring" Diamond
Color / Shape: Pink diamond with white text below the candle
Core Meaning: Wyckoff Spring – liquidity grab and potential major bullish reversal
Suggested Trader Response: One of the strongest long signals in the suite; look for high-quality long setups with tight risk.
Chart Element: STRONG LONG in Dashboard
Color / Shape: Green background, white text in the Signal row
Core Meaning: Multiple bullish layers in confluence
Suggested Trader Response: Consider initiating or increasing longs with strict risk management.
Chart Element: STRONG SHORT in Dashboard
Color / Shape: Red background, white text in the Signal row
Core Meaning: Multiple bearish layers in confluence
Suggested Trader Response: Consider initiating or increasing shorts with a logical, well-placed stop.
## Chapter 9 – Timeframe-Based Trading Playbook
### 9.1 Timeframe Selection
- Scalping
- Timeframes: 1M, 5M, 15M
- Objective: fast intraday moves (minutes to a few hours).
- Recommendation: focus on SMC + Wyckoff.
Smart DCA on very low timeframes may introduce excessive noise.
- Day Trading
- Timeframes: 15M, 1H, 4H
- Provides a good balance between signal quality and frequency.
- Recommendation: use the full stack – SMC + DCA + Volume Profile + Wyckoff + Dashboard.
- Swing Trading & Position Investing
- Timeframes: Daily, Weekly
- Emphasis on Smart DCA + Volume Profile.
- SMC and Wyckoff are used mainly to fine-tune swing entries within larger trends.
### 9.2 Scenario A – Scalping Long
Example: 5-Minute Chart
1. Price is declining into a green OB (Bullish Demand).
2. A candle with a long lower wick and bullish close (Pin Bar / Rejection) forms inside the OB.
3. A Spring diamond appears below the same candle → very strong confluence.
4. The Dashboard shows at least WEAK LONG ↗, ideally STRONG LONG 🚀.
5. Entry:
- On the close of the confirmation candle, or
- On the first pullback into the mid-range of that candle.
6. Stop-loss:
- Slightly below the OB.
7. Targets:
- Nearby bearish FVG above, and/or
- The next red OB.
### 9.3 Scenario B – Day-Trading Short
Recommended Timeframes: 1H or 4H
1. The market completes a strong impulsive move upward.
2. Price enters a red Order Block (Supply).
3. In the same zone, a purple FVG appears or remains unfilled.
4. On a lower timeframe (e.g., 15M), RSI enters overbought territory and a DCA Sell signal appears.
5. The main timeframe Dashboard (1H) shows WEAK SHORT ↘ or STRONG SHORT 🩸.
Trade Plan
- Open a short near the upper boundary of the red OB.
- Place the stop above the OB or above the last swing high.
- Targets:
- A yellow FVG lower on the chart, and/or
- The next green OB (Demand) below.
### 9.4 Scenario C – Swing / Investment with Smart DCA
Timeframes: Daily / Weekly
1. On the daily or weekly chart, each time a green “DCA” label appears:
- Allocate a fixed fraction of your capital (e.g., 3–5%) to that asset.
2. Check whether this DCA zone aligns with the orange POC of the Volume Profile:
- If yes → the quality of the entry zone is significantly higher.
3. If the DCA signal sits inside a daily green OB, the probability of a medium-term bottom increases.
4. Always build the position laddered, never all-in at a single price.
Exits for investors:
- Near weekly red OBs or large purple FVG zones.
- Ideally via partial profit-taking rather than closing 100% at once.
### 9.5 Case Study 1 – BTCUSDT (15-Minute)
- Context: Price has sold off down towards 65,000 USD.
- A green OB had previously formed at that level.
- Near the lower boundary of this OB, a partially filled yellow FVG is present.
- As price returns to this region, a Spring appears.
- The Dashboard shifts from NEUTRAL / WAIT to WEAK LONG ↗.
Plan
- Enter a long near the OB low.
- Place stop below the Spring low.
- First target: a purple FVG around 66,200.
- Second (optional) target: the first red OB above that level.
### 9.6 Case Study 2 – Meme Coin (PEPE – 4H)
- After a strong pump, price enters a corrective phase.
- On the 4H chart, RSI drops below 30; price breaks below the lower Bollinger Band → a DCA label prints.
- The Volume Profile shows the POC at approximately the same level.
- The Dashboard displays STRONG LONG 🚀.
Plan
- Execute laddered buys in the combined DCA + POC zone.
- Place a protective stop below the last significant swing low.
- Target: an expected 20–30% upside move towards the next red OB or purple FVG.
## Chapter 10 – Risk Management, Psychology & Advanced Tuning
### 10.1 Risk Management
No signal, regardless of its strength, replaces risk control.
Recommendations:
- In futures, do not expose more than 1–3% of account equity to risk per trade.
- Adjust leverage to the volatility of the instrument (lower leverage for highly volatile altcoins).
- Place stop-losses in zones where the idea is clearly invalidated:
- Below/above the relevant Order Block or Spring, not randomly in the middle of the structure.
### 10.2 Market-Specific Parameter Tuning
- Calmer Markets (e.g., major FX pairs)
- `ob_period`: 3–5.
- `bb_mult`: 2.0 is usually sufficient.
- Highly Volatile Markets (Crypto, news-driven assets)
- `ob_period`: 7–10 to highlight only the most robust OBs.
- `bb_mult`: 2.5–3.0 so that only extreme deviations trigger DCA.
- `vol_ma_len`: increase (e.g., to ~30) so that Spring triggers only on truly exceptional
volume spikes.
### 10.3 Trading Psychology
- STRONG LONG 🚀 does not mean “risk-free”.
It means the probability of a successful long, given the model’s logic, is higher than average.
- Treat Mars Signals as a confirmation and context system, not a full replacement for your own decision-making.
- Example of disciplined thinking:
- The Dashboard prints STRONG LONG,
- But price is simultaneously testing a multi-month macro resistance or a major negative news event is imminent,
- In such cases, trade smaller, widen stops appropriately, or skip the trade.
## Chapter 11 – Technical Notes & FAQ
### 11.1 Does the Script Repaint?
- Order Blocks and Springs are based on completed pivot structures and confirmed candles.
- Until a pivot is confirmed, an OB does not exist; after confirmation, behavior is stable under classic SMC assumptions.
- The script is designed to be structurally consistent rather than repainting signals arbitrarily.
### 11.2 Computational Load of Volume Profile
- On the last bar, the script processes up to `vp_lookback` bars × `vp_rows` rows.
- On very low timeframes with heavy zooming, this can become demanding.
- If you experience performance issues:
- Reduce `vp_lookback` or `vp_rows`, or
- Temporarily disable Volume Profile (`show_vp = false`).
### 11.3 Multi-Timeframe Behavior
- This version of the script is not internally multi-timeframe.
All logic (OB, DCA, Spring, Volume Profile) is computed on the active timeframe only.
- Practical workflow:
- Analyze overall structure and key zones on higher timeframes (4H / Daily).
- Use lower timeframes (15M / 1H) with the same tool for timing entries and exits.
## Conclusion
Mars Signals – Ultimate Institutional Suite v3.0 (Joker) is a multi-layer trading framework that unifies:
- Price structure (Order Blocks & FVG),
- Statistical behavior (Smart DCA via RSI + Bollinger),
- Volume distribution by price (Volume Profile with POC, HVN, LVN),
- Liquidity events (Wyckoff Spring),
into a single, coherent system driven by a transparent Confluence Scoring Engine.
The final output is presented in clear, actionable language:
> STRONG LONG / WEAK LONG / NEUTRAL / WEAK SHORT / STRONG SHORT
The system is designed to support professional decision-making, not to replace it.
Used together with strict risk management and disciplined execution,
Mars Signals – UIS v3.0 (Joker) can serve as a central reference manual and operational guide
for your trading workflow, from scalping to swing and investment positioning.
SMC

QT Previous Micro Cycle Range + SSMT [bilal]Previous Micro Cycle Range + SMTs - Indicator Description
📊 Overview
This indicator tracks 22.5-minute micro cycles within ICT's Quarterly Theory framework and automatically detects Smart Money Technique (SMT) divergences across correlated indices (NQ, ES, YM). It visualizes previous cycle ranges and identifies high-probability manipulation completions for precise intraday entries.
🎯 What It Does
Micro Cycle Tracking:
Divides each 90-minute session into four 22.5-minute micro quarters
Plots the previous micro cycle's High, Low, Equilibrium (EQ), and Quarter levels
Updates automatically as new micro cycles form
Works on any timeframe (recommended: 1-5 minute charts)
SMT Detection:
Compares current micro cycle vs previous micro cycle across NQ, ES, and YM
Detects Bearish SMT: Divergence at highs (signals distribution down)
Detects Bullish SMT: Divergence at lows (signals distribution up)
Draws visual SMT lines with directional arrows showing correlation/divergence
Optional SMT table showing all three indices' movements
💡 How To Use It
For Scalpers & Day Traders:
Wait for a new micro cycle to begin (lines will refresh every 22.5 minutes)
Watch for SMT formation in the current cycle
Bullish SMT = Buy signal (previous low is confirmed, expect move to previous high)
Bearish SMT = Sell signal (previous high is confirmed, expect move to previous low)
Key Concepts:
Minimum Target: Opposite extreme of previous cycle
SMT Confirmation: One or two indices sweep a level while the other(s) fail to sweep
Best Results: Trade with higher timeframe bias aligned
⚙️ Features
Customizable Display:
Toggle High/Low lines with multiple label styles (Timeframe, Label, %, Fib)
Optional Equilibrium (50%) level
Optional Quarter levels (25% / 75%)
Optional extended range projections (±50% to ±400%)
Adjustable line colors, widths, and label sizes
SMT Options:
Enable/disable SMT detection
Show/hide SMT text labels
Custom colors for bullish/bearish SMTs
Option to delete previous cycle SMTs (keeps chart clean)
Real-time SMT table showing all three indices
Comparison Assets:
Default: ES1! and YM1! (customize to your preference)
Set correlation type for each asset (correlated vs inverse)
Disable individual assets if needed
🔍 Understanding The Visuals
Lines:
Solid lines = Previous cycle High/Low (where price came from)
Dotted lines = EQ and Quarter levels (internal cycle structure)
Green lines = SMT divergence detected (buy/sell signal)
Labels:
▲ = Asset made higher high/low vs previous cycle
▼ = Asset made lower high/low vs previous cycle
🔺 = Inverse correlation (up when others down)
🔻 = Inverse correlation (down when others up)
SMT Logic:
If indices diverge (move opposite directions), SMT is confirmed
Bearish SMT = Highs diverge → Sell
Bullish SMT = Lows diverge → Buy
📈 Best Practices
Use on 1-5 minute charts for optimal micro cycle visualization
Combine with higher timeframe bias (Daily Cycle SSMT, session bias, etc.)
Wait for SMT confirmation before entering trades
Target previous cycle's opposite extreme as minimum profit target
Exit when opposing SMT forms or price reaches target
🛠️ Settings Guide
Essential Settings:
Comparison Symbols: Set to the indices you trade (default: ES1!, YM1!)
Show Cycle SMT: Toggle SMT detection on/off
Delete Previous Cycles SMTs: Keep chart clean by removing old SMTs
Visual Preferences:
Line Color/Width: Customize previous cycle lines
Label Style: Choose between Timeframe (22.5m), Label (descriptive), % (percentage), or Fib (0-1)
Show High/Low: Toggle previous cycle extremes
Show EQ/Quarters/Extended Ranges: Add more reference levels as needed
⚠️ Important Notes
This indicator shows previous cycle ranges, not predictive future levels
SMTs are confirmation signals for manipulation completion
Always use proper risk management and combine with your trading plan
Best results when aligned with higher timeframe directional bias
🎓 Based On ICT Concepts
This indicator implements concepts from Inner Circle Trader (ICT):
Quarterly Theory (fractal time structure)
Micro cycles (22.5-minute quarters)
Sequential SMT (mechanical divergence confirmation)
Smart Money accumulation, manipulation, distribution (AMD)
Perfect for: Scalpers, day traders, and anyone using ICT's Quarterly Theory and SMT concepts for precise intraday entries.
Note: This is a study indicator (overlay=true). It does not generate buy/sell signals automatically - you must interpret SMT formations based on your trading strategy.RéessayerGu should know it only works on the 30s chart btwPrevious Micro Cycle Range + SMTs - Indicator Description
📊 Overview
This indicator tracks 22.5-minute micro cycles within ICT's Quarterly Theory framework and automatically detects Smart Money Technique (SMT) divergences across correlated indices (NQ, ES, YM). It visualizes previous cycle ranges and identifies high-probability manipulation completions for precise intraday entries.
⚠️ IMPORTANT: This indicator is designed to work on the 30-second chart only. The micro cycle calculations are optimized for 30s timeframe data.
🎯 What It Does
Micro Cycle Tracking:
Divides each 90-minute session into four 22.5-minute micro quarters
Plots the previous micro cycle's High, Low, Equilibrium (EQ), and Quarter levels
Updates automatically as new micro cycles form every 22.5 minutes
Precise timing based on New York timezone session structure
SMT Detection:
Compares current micro cycle vs previous micro cycle across NQ, ES, and YM
Detects Bearish SMT: Divergence at highs (signals distribution down)
Detects Bullish SMT: Divergence at lows (signals distribution up)
Draws visual SMT lines with directional arrows showing correlation/divergence
Optional SMT table showing all three indices' movements in real-time
💡 How To Use It
Setup:
Switch to 30-second chart (required for accurate cycle timing)
Add indicator to your chart
Ensure you're viewing NQ, ES, or YM (or correlated futures)
For Scalpers & Day Traders:
Wait for a new micro cycle to begin (lines will refresh every 22.5 minutes)
Watch for SMT formation in the current cycle
Bullish SMT = Buy signal (previous low is confirmed, expect move to previous high)
Bearish SMT = Sell signal (previous high is confirmed, expect move to previous low)
Key Concepts:
Minimum Target: Opposite extreme of previous cycle
SMT Confirmation: One or two indices sweep a level while the other(s) fail to sweep
Best Results: Trade with higher timeframe bias aligned (Daily Cycle SSMT, session bias)
⚙️ Features
Customizable Display:
Toggle High/Low lines with multiple label styles (Timeframe, Label, %, Fib)
Optional Equilibrium (50%) level
Optional Quarter levels (25% / 75%)
Optional extended range projections (±50% to ±400%)
Adjustable line colors, widths, and label sizes
Line extension length (default: 15 bars ahead)
SMT Options:
Enable/disable SMT detection
Show/hide SMT text labels with ticker symbols and directional arrows
Custom colors for bullish/bearish SMT lines
Option to delete previous cycle SMTs (keeps chart clean)
Real-time SMT table showing all three indices' current status
Comparison Assets:
Default: ES1! and YM1! (customize to your preference)
Set correlation type for each asset (correlated vs inverse)
Disable individual assets if needed
Works with any correlated futures contracts
Debug Mode:
Toggle debug info to see current NY time, session, and micro cycle timing
Helpful for understanding cycle structure and troubleshooting
🔍 Understanding The Visuals
Lines:
Solid lines = Previous cycle High/Low (where price came from)
Dotted lines = EQ and Quarter levels (internal cycle structure)
Green lines (default) = SMT divergence detected (buy/sell signal)
Gray dotted lines = Extended range projections (if enabled)
Labels:
▲ = Asset made higher high/low vs previous cycle (correlated)
▼ = Asset made lower high/low vs previous cycle (correlated)
🔺 = Inverse correlation (up when others down)
🔻 = Inverse correlation (down when others up)
SMT Logic:
If indices diverge (move opposite directions), SMT is confirmed
Bearish SMT = Highs diverge → High is set, expect distribution down
Bullish SMT = Lows diverge → Low is set, expect distribution up
📈 Best Practices
Must use 30-second chart - indicator timing is calibrated for this timeframe
Combine with higher timeframe bias (Daily Cycle SSMT, 90-min SSMT, session bias)
Wait for SMT confirmation before entering trades (don't front-run)
Target previous cycle's opposite extreme as minimum profit target
Exit when opposing SMT forms or price reaches target
Best windows: Q2→Q3 or Q3→Q4 transitions within 90-minute sessions
Volatility injection times: Watch 09:30, 10:00, and 14:00 ET for strongest moves
🛠️ Settings Guide
Essential Settings:
Comparison Symbols: Set to the indices you monitor (default: ES1!, YM1!)
Correlation Type: Toggle "Correlated" on/off for each asset based on expected relationship
Show Cycle SMT: Enable/disable SMT detection
Show SMT Text: Toggle labels showing ticker divergence details
Delete Previous Cycles SMTs: Keep chart clean by removing old SMTs
Visual Preferences:
Line Color/Width: Customize previous cycle lines (default: black, width 1)
Label Style: Choose between:
Timeframe (shows "22.5m")
Label (descriptive: "previous micro cycle high/low")
% (shows "100%/0%")
Fib (shows "1/0")
Show High/Low: Toggle previous cycle extremes (recommended: ON)
Show EQ/Quarters/Extended Ranges: Add more reference levels as needed
SMT Customization:
SMT Colors: Customize bearish/bullish SMT line colors (default: green for both)
SMT Label Colors: Background and text color for SMT labels
SMT Table: Toggle real-time comparison table (bottom right)
⚠️ Important Notes
30-second chart required - will not work accurately on other timeframes
This indicator shows previous cycle ranges, not predictive future levels
SMTs are confirmation signals for manipulation completion, not entry triggers alone
Always use proper risk management and position sizing
Best results when aligned with higher timeframe directional bias
Monitor all three indices (NQ, ES, YM) for complete SMT picture
Micro cycles are part of a fractal structure - align with 90-min and Daily Cycle SMTs
🎓 Based On ICT Concepts
This indicator implements concepts from Inner Circle Trader (ICT):
Quarterly Theory (fractal time structure - 22.5 min micro quarters)
Micro cycles (four quarters within each 90-minute session)
Sequential SMT (mechanical divergence confirmation across correlated indices)
Smart Money AMD (Accumulation, Manipulation, Distribution pattern)
New York session timing (based on ICT's 6-hour daily cycles)
🕐 Micro Cycle Structure
Each 90-minute session divides into four 22.5-minute micro quarters:
Micro Q1: 00:00 - 22:30
Micro Q2: 22:30 - 45:00
Micro Q3: 45:00 - 67:30
Micro Q4: 67:30 - 90:00
This pattern repeats across all 16 daily 90-minute sessions (Q1.1 through Q4.4).
Perfect for: Scalpers and day traders using ICT's Quarterly Theory and SMT concepts for precise micro-level entries on 30-second charts.
Chart Requirement: 30-second timeframe only.
Note: This is a study indicator. It does not generate automatic buy/sell signals - you must interpret SMT formations based on your trading strategy and higher timeframe bias.

AURORA LEGACY INDICATOR
The AURORA LEGACY is an advanced indicator developed in Pine Script v6 for the TradingView platform, designed to integrate multiple approaches of technical analysis into a single modular and customizable system. Its architecture combines classic elements, such as exponential moving averages (EMA Ribbon), RSI, and ATR, with modern tools inspired by Smart Money Concepts (SMC), including Supply & Demand zones, Break of Structure (BOS), and Points of Interest (POI).
The indicator is structured to provide traders with flexibility, offering pre-configured trading profiles (Scalper, Day Trade, Swing Trade, Sniper) or full manual customization of moving averages. The dynamic Ribbon serves as the core of trend analysis, supported by additional confluences through secondary moving averages (VWMA, LWMA, SMMA) and volatility filters based on ATR.
Key features include:
Trend & Signal System: detection of reversals and trend confirmations through Ribbon color alignment, with automated buy/sell alerts.
Automated Risk Management: dynamic calculation of entry levels, Stop Loss (SL), and multiple Take Profits (TPs), displayed on chart with labels and risk-reward ratio (R:R).
Multi-Timeframe (MTF) Trend Table: consolidated overview of trend, RSI, and volatility (ATR) across different timeframes (5M, 15M, 1H, 4H, Daily).
Smart Money Concepts Integration: automatic detection and marking of Supply & Demand zones, BOS, market structure zigzag, and points of interest.
Complementary Tools: customizable RSI signals by profile, daily support and resistance levels, CPR levels, and visual session markers (London, New York) including overlap zones.
This system was designed to provide a holistic trading approach, combining price action, volatility, indicator confluence, and institutional concepts to support traders of different profiles in making clearer and more precise decisions.

Buy Sell Entry Filter SYS (SMC IDM LIT)BUY SELL Entry FILTER
An advanced market analysis tool. It provides visual Buy/Sell signals in the form of triangles (▲▼), as well as analytical elements such as Entry/Stop Loss lines, a delta table, overbought and oversold zones, structural market elements with breakouts, displays information from higher time frames, and most importantly, liquidity blocks that trigger reactions. The indicator has a number of built-in filters that help remove unnecessary Buy/Sell signals from the chart. This allows you to create several profitable strategies. You don't need to sit in front of the charts; the alert system (ALERTS) will tell you when to pay attention to the chart and quickly enter a trade.
There are many signals, and the ▲▼ lines themselves are not an entry point. You need to filter them using other tools, such as liquidity blocks (LB and HTF LB), trend, OS/OB, Delta, and Pullback breakout.
If the ▲▼ appears in the right place, for example, in the liquidity block with the correct trend and the correct delta, then you can enter a trade!
Ideally, take short trades of 1/3 – 1/5 RR on a 1-minute timeframe and be sure to set a stop loss.
Remember! You are solely responsible for your deposit!
Buy/Sell, Entry/SL, OS/OB, Filter, EMA, Delta
This main group of settings is responsible for generating buy and sell signals, setting filters, and displaying moving averages.
1. Buy/Sell Main: Enables/disables the display of the main Buy/Sell signal as a ▲▼. This is a specific pattern that identifies potential trend reversals or continuations.
Buy/Sell Simple: Toggles the display of a simplified Buy/Sell signal in the ▲▼ pattern.
This pattern is less powerful than the main one, but works well in certain contexts.
2. Trend Delta Table: Displays a table on the chart showing the cumulative volume delta for the current trend, as well as the percentage. Useful for assessing the strength of a trend.
3. Entry/SL: When enabled, draws horizontal lines on the chart for Entry and Stop Loss.
4. Filters (Delta, Trend, OS/OB, HTF OS/OB):
These filters help filter out false signals. A Buy/Sell signal is displayed only if it passes all enabled filters:
Delta Filter: A signal is generated if the volume percentage delta (set by the user) matches the signal direction (positive for Buy, negative for Sell).
Trend Filter (EMA): A signal is generated if it matches the trend direction.
OS/OB Filter (RSI): A signal is generated if the price where the signal formed is in the desired zone (below Oversold for Buy, above Overbought for Sell).
HTF OS/OB Filter (RSI): Same as OS/OB, but uses the RSI on a higher timeframe (HTF).
EMA 1 & EMA 2: Displays two exponential moving averages on the chart (default 50 and 100). The line color changes (e.g., green if EMA1 is above EMA2).
Overbought/oversold zone
This group configures overbought/oversold levels and zones, both on the current and higher timeframes.
1. OS/OB zone: Enables/disables the display of dynamic overbought (Oversold) and oversold (Overbought) levels. These levels "float," adapting to the current price. 2. Period: Period for calculating zones (default 50)
OS: Level below which the Oversold zone is defined (default 40).
OB: Level above which the Overbought zone is defined (default 60).
Labels: Toggles the display of text labels (--- OB, --- OS) next to the corresponding levels.
Mid: Toggles the display of the center level and its color.
HTF Zones & Labels: Same as for OS/OB, but for levels on a higher timeframe (HTF).
Smooth: Enables smoothing for calculated price levels of zones, making the lines less sharp.
Structure / Breakout line
This setting adds structural analysis elements and breakout lines to the chart. 1. BO Lines (Breakout Lines): Displays horizontal lines on the chart when the price breaks through the external pullback against the trend, thus showing ChoCh.
2. HH/LL: Displays markers (HH - LL - HL - LH) on the chart to indicate key market structural points.________________________________________
Pullbacks EXT/INT
This setting is responsible for the visualization of pullback lines (Pullback) at external (EXT) and internal (INT) levels.
1. Ext (External): Displays lines connecting external extremes (Pullback), showing potential pullback levels.
2. Int (Internal): Displays lines connecting internal extremes (Pullback).
3. Pending Ext/Int: Displays potential pullback lines that may form if the price reaches the next extreme.
Liquidity blocks
Adds visual rectangles (blocks) to the chart, representing potential liquidity zones (where large orders were placed).
1. LB tune: Parameter determining how many candles are used to determine the pattern for a block.
2. High zone: Color of the line inside the block, indicating the strongest part of the block.
3. Show deleted: Shows deleted (broken) blocks in a different color.
4. Volume LB: Enables/disables the display of the volume value in the block.
Quick liquidity blocks
Similar to main blocks, but creates quick blocks. If a quick block is confirmed, it becomes the main LB; if not, it disappears.
1. Quick LB: Enables/disables quick blocks.
2. QLB tune: Pattern length parameter for quick blocks.
HTF liquidity blocks
Displays LB from a higher timeframe (HTF), using the same principles as main blocks. 1. HTF: Enable/disable HTF blocks.
2. Select a timeframe for calculation.
Alerts
A system for alerting you to important indicator actions. Alerts are triggered by certain events.
1. Bull PB Breakout / Bear PB Breakout: Alert when the external pullback is broken and a ChoCh is formed.
2. Trend Change: Alert when a trend changes.
3. New Block: Alert when a new main liquidity block is formed.
4. New HTF Block: Alert when a new HTF liquidity block is formed.
5. Touch Block: Alert when the price of the main liquidity block is touched.
6. Touch HTF Block: Alert when the price of the HTF liquidity block is touched.
7. Touch mode / Touch mode HTF: Select the alert frequency (before or after the bar closes).
This indicator provides a powerful and flexible tool for market analysis, combining several approaches in a single interface.

ADR Daily Range + Volatility + KZs — SMC/ICT (@PueblaATH)ADR Daily Range + Volatility + KZs — SMC/ICT (@PueblaATH) is a complete intraday context and volatility HUD that plots market opens, killzones, previous period highs/lows, and a dynamic ADR/volatility dashboard. It is built to give SMC/ICT traders an at-a-glance view of when and where price is moving: sessions, overlaps, ranges, and distance to key levels, all on a single clean overlay.
What the Indicator Does
Market Opens (Tokyo, London, New York)
Professional-grade session open lines with:
Individually configurable open times per session and timezone.
Infinite vertical lines or height-limited extensions (custom tick offsets).
Fully styled labels: size, alignment, auto-background, manual background, and vertical offset.
Killzones & Session Overlaps
Precision-timed shaded boxes for:
Tokyo Killzone
London Killzone
New York Killzone
London–New York Overlap
Previous Period Levels (PDH/PWH/PMH & PDL/PWL/PML)
Robust daily/weekly/monthly high/low engine:
Accurate Previous Day / Week / Month Highs & Lows (Europe/Madrid reference).
Line length modes: infinite, N bars, or end-of-day projection.
Per-level colors + labeled markers placed to the right of price with custom horizontal/vertical spacing.
Timeframe & Weekend Filters
Keep charts clean by hiding components based on:
Custom timeframe ranges (hide opens or killzones on HTFs).
Weekend filters for opens, killzones, and ADR/table.
Optional override to display the HUD table across all timeframes.
Session Comparison Table (Top-Right HUD)
A compact, institutional-style session dashboard comparing:
Tokyo, London, New York — current open vs previous session and previous day.
Bullish/Bearish state with color-coded logic (+ optional ▲/▼ arrows).
Optional Δ% change column relative to previous day’s open.
ADR / Volatility Panel (24h Rolling Window)
A powerful real-time volatility module providing:
True 24-hour rolling high–low range.
SMA-based ADR calculation with automatic bar-count safety limits.
ADR% expansion metric with two thresholds + blinking color logic for volatility extremes.
Directional bias vs price 24 hours ago (Bullish/Bearish).
Optional metrics: distance to PDH/PDL (in price units) and absolute H–L / ADR values.
How to Use It
Set each session’s open time and killzone window according to your broker or desired timezone alignment.
Enable or disable session opens and killzones to frame the trading windows you prioritize (e.g., LDN Killzone or NY session expansion).
Activate key previous period levels (PDH/PDL, PWH/PWL, PMH/PML) and tune the line-length mode and label spacing to match your workflow.
Use timeframe & weekend filters to keep higher-timeframe charts clean while maintaining precise intraday visibility on lower timeframes.
Monitor the session comparison table to understand directional behavior relative to previous sessions and previous day opens.
Watch the ADR panel to classify the day as compressed, normal, or expanded—and anticipate potential reversion or continuation.
Originality & Credits Disclaimer
This indicator is an original work by @PueblaATH , created specifically for the tool ADR Daily Range + Volatility + KZs — SMC/ICT (@PueblaATH) and distributed under the MPL 2.0 license.
While the concepts implemented—session opens, killzones, ADR, and previous highs/lows—are public and widely known in the trading community, this script introduces a uniquely integrated framework that combines:
Multi-timezone session scheduling with dynamic TF/weekend filtering.
A modular PDH/PWH/PMH + PDL/PWL/PML engine with versatile projection and labeling controls.
A precise 24-hour volatility model tied to an ADR panel with extension thresholds, blinking alerts, and distance-to-PD metrics.
A multi-session comparative table that unifies Tokyo, London, and New York open data in real time.
This work does not reuse or repackage code from other authors. Any future adaptations from public sources will always include full, transparent credit and documentation.

Liquidity Sweeps + Swing High/Low — SMC/ICT (@PueblaATH)Liquidity Sweeps + Swing High/Low — SMC/ICT (@PueblaATH) is a liquidity-driven Smart Money Concepts tool that automatically maps out key swing highs and lows, tracks how they evolve into liquidity pools, and highlights when those levels are swept and either respected or invalidated. This indicator is built to give traders a clean, event-driven view of stop runs and liquidity grabs across any timeframe, from scalping to higher-timeframe context.
What the Indicator Does
Swing Structure & Liquidity Pools
Detects swing highs and lows using a configurable swing length, projects levels forward in time, and builds a liquidity-pool database through pivot arrays used for sweep detection.
Liquidity Sweeps (Stop Runs)
Identifies bearish (upward) and bullish (downward) sweeps through prior liquidity levels using three modes: Any Touch, Wick + Close Back, and Retest Rejection.
Each sweep can generate projective lines, labeled markers, and alerts.
Scope, Rate Limiting & Clean Visuals
Controls minimum spacing between swings and sweeps, limits sweep duplication, auto-revokes invalidated sweeps, and restricts the maximum number of visible events.
Smart offset logic reduces label overlap and keeps charts clean even in dense price action.
Timeframe Filters & Utilities
Allows hiding all drawings between specific timeframes and optionally skipping calculations or clearing internal state when hidden.
Includes debug pivot markers and an optional TF/Bucket badge.
Timeframe Auto-Mode (Original Adaptive Engine)
This indicator features a fully original, seven-bucket Auto-Mode engine that adapts sensitivity to the active timeframe.
Bucket Classification (by seconds)
≤1m, >1m–15m, >15m–30m, >30m–1h, >1h–4h, >4h–1d, >1d.
Bucket-Specific Settings
Each bucket has unique sensitivity sets:
Swing/Sweep lengths
Projection distances
Line style and width
Rate-limiting gaps
Pivot count and bar-lookback windows
Overlap windows
Adaptive Behavior
Lower timeframes gain more reactive behavior, while higher timeframes apply smoother and more selective filters.
Manual Override
Auto-Mode can be disabled to use the Core manual settings for full customization.
How to Use It
Attach the indicator and choose whether to keep Auto-Mode ON or OFF.
Select the sweep mode (e.g., Wick + Close Back for ICT-style liquidity grabs).
Adjust label text, size, color, and offsets to your preference.
Use timeframe filters to show drawings only where you want them.
Enable alerts for bullish sweeps, bearish sweeps, or revocations.
Combine sweep events with your own confluence (sessions, bias, OBs/FVGs, etc.).
Originality & Credits Disclaimer
This script is an original work by @PueblaATH , created specifically for Liquidity Sweeps + Swing High/Low — SMC/ICT (@PueblaATH) under the MPL 2.0 license.
The concepts used (swing highs/lows, liquidity pools, sweeps, SMC/ICT behavior) are public and widely known—they do not belong to any author or protected script.
This indicator does not repackage or cosmetically modify existing code.
Its architecture—including the multi-bucket Auto-Mode engine, pivot/sweep management system, revocation logic, overlap-aware labeling, and TF-based hide/skip/clear controls—is uniquely implemented for this script.
If any future update reuses or adapts code from public sources, full credit will be given in both comments and description, with clear explanation of what was reused and what was originally added or improved.

Sessions High & Low LevelsAutomatically plots high & low levels for multiple sessions. Clear session structure for intraday traders using price action, liquidity concepts, or session-based strategies.
Automatically plots the High & Low, for sessions such as London, New York, and Asia, with full customization for any custom session or timezone. These levels extend forward and adapt in real time, giving you a clear view of session-based structure and liquidity behavior.
Perfect for traders using ICT concepts, session narratives, or intraday market structure. Session ranges often act as key liquidity pools, breakout zones, and directional guides, this tool makes them easy to see at a glance.
Features:
Auto-plots High & Low for NY, London, and Asia sessions (customizable)
Fully customizable session times, colors, labels, and visibility options
Works across any assets

LiquiBreak — Semi-Automatic Breakout, Gap & Trend-Filter StrategLiquiBreak is a semi-automatic breakout + gap detection strategy that combines pivots, a volatility filter and an optional Supertrend direction check to generate entry signals. It can optionally place take-profit and stop-loss orders in points. Use it to highlight high-probability breakout/gap setups and to automate exits when you want — otherwise treat its signals as trade alerts that require your confirmation.
📌 LiquiBreak — Semi-Automatic Breakout, Gap & Trend Strategy
1. Overview
1. LiquiBreak is a semi-automatic breakout + gap strategy designed to catch high-quality moves with volatility confirmation.
2. Uses pivot-based support/resistance , gap detection , Supertrend filtering , and optional automatic TP/SL in points .
3. Works on all assets and timeframes, especially effective on XAUUSD, Indices, Crypto and FX pairs .
---
2. What This Script Detects
1. Breakouts above resistance and below support during strong volatility.
2. Bullish & bearish gap patterns confirmed with momentum sequences.
3. Dynamic volatility zones based on normalized ATR ranges.
4. Optional Supertrend trend direction for filtering bad signals.
5. Automatic TP/SL orders when enabled.
---
3. Recommended Indicators to Combine With
To increase accuracy and reduce false breakouts:
1. Supertrend (included) – best for trend direction.
2. EMA 9/21 or EMA 20/50 – confirms trend strength & pullbacks.
3. RSI or Stoch RSI – avoid overbought/oversold breakouts.
4. VWAP – institutional bias & fair value zones.
5. CPR / Pivot Points – confluence with breakout levels.
6. MACD – trend confirmation on higher timeframe.
7. Volume Profile (optional) – find breakout liquidity zones.
These indicators help filter low-quality signals without affecting the script’s core logic.
---
4. Key Features
1. Volatility-based pivot support & resistance .
2. Reliable breakout confirmation using real-time volatility strength.
3. Strong gap pattern detection with ATR threshold.
4. Optional Supertrend confirmation for safer entries.
5. Point-based Take Profit / Stop Loss .
6. Toggle on/off: Longs, Shorts, TP, SL .
7. Semi-automatic execution — not fully automated.
8. Clean, optimized structure for stability and speed.
---
5. Inputs / Settings
1. Pivot / Levels Period – defines structural S/R levels.
2. Volatility Filter (%) – prevents low-quality signals.
3. TP Points – automatic take-profit target.
4. SL Points – automatic stop-loss.
5. Enable TP / Enable SL – full exit control.
6. Allow Long / Allow Short – direction control.
7. Supertrend Filter – filter weak counter-trend trades.
---
6. How to Use the Strategy
1. Select timeframe & tune pivot/volatility settings.
2. Enable/disable automatic TP/SL based on your style.
3. Turn ON Supertrend for safer trend-based trades.
4. Confirm signals using EMA, RSI, VWAP, Volume or CPR.
5. Watch for high-volatility breakouts near key levels.
6. Use multiple timeframe analysis for stronger confirmation.
---
7. Important Warning (User Must Monitor Trades)
⚠ This script is NOT a fully automatic bot.
1. You MUST monitor the chart while using this strategy.
2. You MUST manually close trades if market conditions change.
3. Auto TP/SL helps, but during news events or fast markets, slippage may occur.
4. Treat this script as a signal + entry assistant , not a fire-and-forget system.
---
8. Best Practices
1. Works best on XAUUSD, NAS100, BTC, ETH, EURUSD .
2. Avoid major news unless experienced.
3. Increase volatility filter during choppy markets.
4. Use M15–H1 for clean breakouts; M5 for scalping.
5. For beginners: keep TP/SL enabled for safety.
6. Backtest first → then paper trade → then live trade.
---
9. Disclaimer
1. For educational and research purposes only .
2. Not financial advice.
3. User is fully responsible for their trades and risk.
4. Past performance does not guarantee future results.

Gold 1&5 Min Trading Strategy [TradingFinder] XAU Scalper Signal🔵 Introduction
Scalping in financial markets is based on immediate price reactions and precise analysis of price action behavior. In this trading approach, the trader must identify signals that originate directly from market structure, momentum shifts, candlestick formations, and the position of price relative to key zones.
Supply and demand areas serve as the primary regions of order concentration and form the foundation of scalping analysis, since they provide the most accurate representation of balance or imbalance between buyers and sellers as well as the active flow of liquidity in the market.
In demand zones, price reactions usually begin with the formation of reversal or continuation candlestick patterns. These patterns include structures such as Pin Bar, Engulfing, Doji, Failure, Rejection, and other forms of false breakout behavior, each of which can indicate a potential short term change in direction.
Liquidity plays a central role in these reactions, because price entering a demand zone typically coincides with the absorption of sell side liquidity and the restoration of order flow. This process often leads to rapid movements that are suitable for scalping. Therefore, combining candlestick confirmation with the location of price inside a supply or demand zone is one of the most reliable methods of identifying low risk scalping signals.
Demand zones include several structural variations, each representing a different form of liquidity behavior. One of the most well known examples is the order block, which is the final bearish candle before a strong bullish movement and indicates the presence of unfilled buy side interest.
Another important structure is the Fair Value Gap, which appears when a price void forms across three consecutive candles due to a lack of liquidity during the moment of displacement. The market often returns to this area to restore balance. Imbalance structures also represent one sided pressure in order flow where the market reacts later to correct these inefficiencies.
Breaker structure is another key element in demand analysis. A breaker is formed when an order block is violated and price returns to the same level after collecting liquidity, then continues in the opposite direction. This pattern often appears near liquidity based highs or lows and reflects a shift in the strength of market participants.
Together, order blocks, Fair Value Gaps, imbalances, and breakers form the core of demand analysis in price action and are widely used in precise scalping strategies due to their strong connection with liquidity and the high predictability of price reactions within them.
Bullish Setup :
Bearish Setup :
🔵 How to Use
This strategy is built on price action analysis, market reactions inside supply and demand zones, and confirmation through candlestick patterns. The first step is to identify key areas such as order blocks, Fair Value Gaps, imbalances, or breakers.
After these zones are located, price behavior within them is examined using candlestick structure and momentum direction. Entries are taken only when price reaches a validated zone, a clear sign of liquidity absorption or injection appears, and a confirming candlestick forms inside the zone.
This approach allows the trader to capture fast and precise entries during moments when the market is actively reacting to decision points.
🟣 Long Setup
In the buy setup, a valid demand zone must first be identified. This can be a bullish order block, an unfilled bullish Fair Value Gap, an imbalance at the lower part of structure, or a bullish breaker. When price enters this zone and shows signs of absorbing sell side liquidity, candlestick behavior must be examined.
Formation of reversal signals such as a Pin Bar with a long lower wick, bullish Engulfing, Rejection Candle, or a false breakout of the low, indicates a favorable shift in order flow. After receiving candlestick confirmation, a buy entry is taken within the same zone and the stop level is placed below the liquidity boundary. Targets are typically based on filling gaps, reaching supply zones, or returning to structural means.
🟣 Short Setup
In the sell setup, a valid supply zone must be recognized. This may include a bearish order block, a bearish Fair Value Gap, an imbalance at the upper part of structure, or a bearish breaker. When price enters this zone and liquidity accumulates above nearby highs, the probability of a fast momentum shift increases.
Confirmation occurs when a bearish reversal pattern forms such as Engulfing, Pin Bar with a long upper wick, indecisive Doji followed by rejection, or a false breakout of the high. After confirmation, the sell entry is placed and the stop level is set above the liquidity zone. Targets are selected based on filling lower Fair Value Gaps, reaching demand zones, or returning to structural midpoints.
🔵 Settings
Last Candle in Signal Direction : When On, a signal is issued only if the last candle moves in the direction required by the signal.
Signal in Nearly Zone : When enabled, the signal becomes valid even if the candle is near the zone rather than strictly inside it. When disabled, only signals formed inside the zone are allowed.
Allow Both Side Signals : When On, signals from both sides of the structure can be issued even if a limiting level exists. When disabled, only signals that do not violate the limiting level are allowed.
🔵 Conclusion
Using price action, supply and demand zones, and candlestick confirmation alongside liquidity analysis creates an effective framework for identifying fast market reactions in scalping conditions. Focusing on structures such as order blocks, Fair Value Gaps, imbalances, and breakers allows the trader to recognize shifts in momentum and changes in order flow with greater precision.
In this approach, entries are taken only when price reaches a validated zone, liquidity behavior is observable, and the confirming candle forms at the correct location. This leads to organized, low risk scalping signals that are aligned with the real time behavior of the market.

MCM By Inner Racers# MCM By Inner Racers - Multi-Timeframe Key Levels & Session Indicator
## 📊 Overview
**MCM (Multi-Timeframe Chart Mapping)** is a comprehensive trading indicator designed for professional traders who need clear visual representation of critical price levels, session ranges, and time-based market structure. This all-in-one tool eliminates chart clutter while providing essential information for ICT, SMC, and institutional trading methodologies.
---
## ✨ Key Features
### 📅 **Previous Daily Levels**
- **Previous Day High (PDH)** - Acts as key resistance/liquidity zone
- **Previous Day Low (PDL)** - Acts as key support/liquidity zone
- **Previous Day Mid (PDM)** - 50% equilibrium level for mean reversion trades
- **Daily Separators** - Vertical lines marking new trading days
### 📆 **Previous Weekly Levels**
- **Previous Week High (PWH)** - Major weekly resistance for swing trading
- **Previous Week Low (PWL)** - Major weekly support for swing trading
- **Previous Week Mid (PWM)** - Weekly equilibrium for higher timeframe bias
- **Weekly Separators** - Vertical lines marking new trading weeks
### 🌅 **True Day Opens (TDO)**
- Displays opening prices at **midnight NY time** for the past 1-10 days
- Each level labeled as "TDO D-0", "TDO D-1", "TDO D-2", etc.
- Critical for tracking institutional reference points and gap trading
- Respects true midnight opens (not session opens)
### 📍 **Weekly Opens**
- **Monday 00:00 Open** - True weekly open at Monday midnight NY time
- **Sunday 17:00 Open** - Forex market open (Sunday 5 PM NY time)
- Essential for understanding weekly bias and manipulation zones
### 🌏 **Trading Session Ranges**
Dynamic session boxes that track real-time high/low ranges:
- **Asian Session** (Default: 20:00-00:00 NY) -
- **London Session** (Default: 02:00-05:00 NY) -
- **New York Session** (Default: 07:00-16:00 NY) -
All session times are **fully customizable** in 15-minute increments.
---
## 🎯 Who Is This For?
✅ **ICT/SMC Traders** - Key levels for market structure, liquidity, and order flow
✅ **Session Traders** - Identifying killzones and optimal entry zones
✅ **Swing Traders** - Previous day/week levels as support/resistance
✅ **Multi-Timeframe Analysts** - Understanding price relationships across timeframes
✅ **Forex & Indices Traders** - NY time-based analysis for institutional moves
---
## 🎨 Full Customization
Every element is fully customizable:
- ✏️ **Colors** - Match your chart theme perfectly
- 📏 **Line Widths** - 1-5 pixels for visibility
- 🎭 **Line Styles** - Solid, Dashed, or Dotted
- 🏷️ **Labels** - Custom text and 5 size options (Tiny to Huge)
- ⏱️ **Session Times** - Adjust to your timezone or broker
- 📐 **Line Extension** - 20-500 bars forward projection
- 👁️ **Toggle Visibility** - Show/hide any feature independently
---
## 🔧 Technical Highlights
- Uses **request.security()** for accurate higher timeframe data
- Implements **lookahead=barmerge.lookahead_on** for non-repainting levels
- All times calculated in **America/New_York timezone** for consistency
- Efficient line management with proper deletion/recreation
- Maximum 500 lines supported for clean chart performance
- Session detection respects broker time differences
---
## 📖 How To Use
### **For Day Traders:**
1. Enable Daily Levels + True Day Opens for intraday structure
2. Use Session Ranges to identify high-probability trading windows
3. Watch for price reactions at PDH/PDL and TDO levels
### **For Swing Traders:**
1. Enable Weekly Levels for higher timeframe bias
2. Use PWH/PWL as major support/resistance zones
3. Monitor Weekly Opens for institutional reference points
### **For Multi-Timeframe Analysis:**
1. Combine Daily + Weekly levels for confluence zones
2. Use Mid levels (50%) for mean reversion opportunities
3. Align session ranges with higher timeframe structure
---
## ⚙️ Setup Tips
- **Timeframe:** Works on all timeframes (recommended: 1m to 1H for intraday)
- **Chart Type:** Overlay indicator - displays directly on price chart
- **Clean Charts:** Toggle off features you don't need for specific strategies
- **Labels:** Turn off labels for cleaner charts, turn on for reference
- **Line Extension:** Adjust based on your screen size and bar count
---
## 🚀 What Makes This Different?
Unlike basic support/resistance indicators, MCM provides:
- ✅ **True NY midnight opens** (not session opens)
- ✅ **Multiple day opens** tracking (not just previous day)
- ✅ **Dynamic session ranges** (not static boxes)
- ✅ **Both true weekly opens** (Monday 00:00 AND Sunday 17:00)
- ✅ **Fully customizable everything** (colors, styles, labels, times)
- ✅ **Non-repainting levels** using proper lookahead settings
- ✅ **All-in-one solution** (no need for multiple indicators)
---
## 📝 Notes
- All times are in **America/New_York timezone** for consistency with institutional trading
- Previous levels update at the start of each new day/week
- Session ranges are calculated dynamically during active sessions
- Lines extend forward for clear visual reference
- Works with any symbol: Forex, Indices, Crypto, Stocks
---
## 🏷️ Tags
`Multi-Timeframe` `Key Levels` `ICT` `Smart Money Concepts` `Sessions` `Previous Day High/Low` `Previous Week High/Low` `Support Resistance` `Institutional Trading` `Order Flow` `Liquidity` `Market Structure`
---
© Inner_Racers
For questions, suggestions, or feedback, please leave a comment below!
**⭐ If you find this indicator helpful, please give it a boost and share with fellow traders!**

Velocity SmartMoney Engine work - Delta Exchange📈 Velocity SmartMoney Engine
Adaptive Breakout & Order Block Strategy with Dynamic Risk Control
---
🔍 Overview
The Velocity SmartMoney Engine is a next-generation trading strategy that fuses Smart Money breakout logic , Order Block structure detection , and Supertrend-based directional filtering into one precision-built system.
It identifies institutional-level breakouts , manages positions with ATR-based adaptive risk , and executes disciplined exits using stop-loss, trailing stop, and profit target logic.
Designed for swing and short-term system traders, this strategy performs excellently on BTC, ETH, NIFTY, BANKNIFTY, Gold, and major FX pairs — best on 15m to 4h timeframes .
---
⚙️ Core Components
1️⃣ Smart Money Breakout Logic
Detects real breakouts using dynamic support/resistance pivots.
Confirms entries only during strong volatility bursts.
Avoids false breakouts in sideways markets.
2️⃣ Order Block Gap Detection
Finds institutional imbalance zones (Smart Money footprints).
Bullish gaps = Long bias; Bearish gaps = Short bias.
Works with candle confirmation and momentum validation.
3️⃣ Supertrend Directional Filter
Trades only in direction of Supertrend bias.
Exits instantly when Supertrend flips.
Prevents entries against dominant trend.
4️⃣ ATR-Based Risk & Volatility Filter
Uses ATR × multiplier for adaptive stop sizing.
Volatility filter ensures trades trigger only during active markets.
Avoids whipsaw zones.
---
💰 Position Management
Stop-Loss: Adaptive ATR-based.
Take-Profit: Default 5% target (editable input).
Trailing Stop: Auto-adjusts to lock profits.
No-Exit Hold: Hold position for defined candles before exits.
Supertrend Flip Exit: Instant trend-based closure.
---
🧠 Built-In Trade Discipline
One-trade-per-bar guard prevents duplicate entries.
Volatility-weighted breakout validation.
Clean and conflict-free exit hierarchy.
---
🎯 Key Features
✅ Smart Money breakout + Order Block fusion
✅ Supertrend-based trend confirmation
✅ ATR dynamic stop + 5% profit target
✅ Adaptive trailing logic
✅ One-trade-per-bar control
✅ Works across Crypto, Indices, FX, Commodities
✅ Ideal for 1h–4h swing setups
---
📊 Recommended Settings
Parameter | Typical Value | Purpose
--- | --- | ---
Levels Period | 20 | Pivot lookback for S/R zones
Volatility Filter | 20–40 | Filters out low-momentum areas
ATR Multiplier | 1.5 | Adjust stop size by volatility
Supertrend Length | 10 | ATR period for trend bias
Supertrend Multiplier | 3.0 | Supertrend sensitivity
Target Profit | 5% | Default take-profit level
---
⚡ Suggested Use
• Best suited for swing entries on 1H / 4H charts .
• Combine with session filters or trend confluence for automation.
• Ideal as a base module for TradingView + Broker integrations .
---
🧩 Disclaimer
This script is for educational purposes only .
Past performance does not guarantee future returns.
Use responsibly. The developer assumes no liability for financial losses.
---
💬 Community & Access
Developed by: Shubham Singh
Version: Velocity SmartMoney Engine v1.0
For premium modules & automation: DM "Velocity Access" on chat to request access.
---
© 2025 Velocity SmartMoney Engine — All Rights Reserved

TitanEdge Algo Suite — 4H BTC & ETH (Delta Exchange Ready)TitanEdge Algo Suite — 4H BTC & ETH (Delta Exchange Ready)
TitanEdge Algo Suite is a next-generation trading system that fuses volatility-adaptive logic, order-block structure, SuperTrend direction filtering, and ATR-based exits into a single modular framework.
It’s engineered for 4-hour BTC and ETH swing trading, delivering institutional-grade entries, dynamic risk control, and precise exits.
⚙️ Core Features
1. Volatility Oscillator (0–100)
• Filters trades by volatility intensity.
• Uses ATR, Range, or Bollinger Band Width normalization.
• Trades trigger only when market volatility is high — filtering out sideways or weak trends.
• Ensures trades occur during real momentum expansions.
2. Breakout + Order Block Engine
• Detects pivot highs/lows to confirm authentic breakout levels.
• Identifies “smart money” gaps — institutional imbalance zones often leading to strong reversals or continuations.
• Captures both breakout continuations and order-block reversals.
• Works as a hybrid structure detector combining price action and volatility alignment.
3. SuperTrend Directional Filter
• Optional filter that only allows trades in the direction of the SuperTrend.
• Can automatically close trades when a SuperTrend flip occurs.
• Provides strong trend-following bias and helps avoid countertrend traps.
4. ATR-Based Stop & Trailing System
• Adaptive stop-loss and trailing logic that expands or tightens based on volatility.
• Supports three modes: StopOnly, TrailOnly, and StopAndTrail.
• Works in both ATR-based distance or percentage-based configuration.
• Keeps losing trades small and lets winning trades extend dynamically.
5. Volume-Based Exit Logic
• Detects low-volume exhaustion to identify momentum loss.
• Detects opposite-volume spikes as early reversal signals.
• Optional hybrid “Both” mode combines both detection methods for stronger reliability.
• Ideal for markets where volume surges indicate smart money exits or trap formations.
6. Session Filter & Anti-Churn Control
• Restrict trading hours (optional; not required for crypto).
• Prevents repeated signals and noise-based entries through minimum bars between trades.
• Cooldown logic ensures disciplined trading and avoids strategy overlap.
• Prevents multiple entries in a single bar and filters unconfirmed breakouts.
7. SmartMoney Preset Mode
• Institutional-grade configuration automatically adjusting volatility, ATR, and structural logic.
• Mimics smart money behavior by prioritizing clean structure and high liquidity volatility zones.
• Great for traders who want simplified institutional logic without manual tuning.
Optimized for 4H BTC & ETH
TitanEdge performs best on BTCUSDT and ETHUSDT pairs in the 4-hour timeframe.
The 4H chart captures high-volatility institutional swings, eliminates intraday noise, and provides clear order-block setups.
This timeframe aligns with BTC/ETH volatility cycles, providing consistent signals and cleaner trend confirmation.
Recommended settings for 4H charts:
• Levels Period: 25
• Volatility Filter: 20
• volatility oscillator Auto: disable ( it depend upon your plan test with Disable/enable)
• Volatility Method: BBWidth
• ATR Multiplier: 1.8
• ATR Stop %: 5
• SuperTrend ATR Length: 10
• SuperTrend Factor: 3
• ATR Mode: StopAndTrail
• Hold Bars: 1
• Volume Exit: Disable (Both)
• Session Filter: Off (Crypto runs 24/7)
Entry Logic
• Long Entry: Price breaks above resistance (pivot high), volatility above threshold, and optional SuperTrend confirmation.
• Short Entry: Price breaks below support (pivot low), volatility above threshold, and optional bearish SuperTrend confirmation.
• Additional Entry: Triggered by order-block gaps (smart money imbalances) in volatility expansion phases.
• Trades only when both direction and volatility align to ensure precision entries.
Exit Logic
• ATR Stop and Trail dynamically manage open trades.
• SuperTrend Flip forces exit on trend reversal.
• Volume Exit triggers when volume momentum drops or opposite spike occurs.
• Optional session close exit to flatten trades outside hours.
• Logic prevents premature exits with “Hold Bars” delay after entry.
Why You Need TitanEdge Algo Suite
• Trades only during high-volatility, strong-momentum phases — no false breakouts or choppy trades.
• ATR risk control automatically adjusts to each market’s volatility conditions.
• Identifies institutional order-blocks and clean breakouts for precise entries.
• SuperTrend filter adds directional bias, boosting win-rate consistency.
• Volume exit logic ensures profits are protected when market momentum fades.
• Works 24/7 across all major crypto pairs — fully automated and customizable.
• Built for 4H swing trades — fewer but higher-quality setups.
• Fully compatible with TradingView alerts and bot integration for hands-free execution.
How TitanEdge Makes Profit
• TitanEdge only trades during volatility expansion, when breakout continuation probability is statistically high.
• ATR dynamic stops prevent large losses by scaling protection according to real volatility.
• Trend filtering keeps positions aligned with major market flows.
• Order-block detection ensures entries are based on price structure rather than random signals.
• Volume-based exits secure profits early when momentum weakens.
• SmartMoney Preset provides optimal balance between trade frequency, accuracy, and drawdown control.
• The system compounds edge by maintaining trade discipline — fewer but stronger trades over time.
Delta Exchange Integration (TradingView Bot Ready)
TitanEdge is fully compatible with TradingView alert webhooks and can connect to Delta Exchange or any bot-supported broker.
Alert JSON message format:
{"symbol":"{{ticker}}","side":"{{strategy.order.action}}","qty":1,"trigger_time":"{{timenow}}","strategy_id":"code"}
qty 1 represent 1 lot so if you want to take trade with 5 lots or 0.05eth and write
{"symbol":"{{ticker}}","side":"{{strategy.order.action}}","qty":5,"trigger_time":"{{timenow}}","strategy_id":"code"}
Steps to automate:
Create an alert on TradingView using “Once Per Bar Close”.
Paste your bot or automation webhook URL.
Paste the JSON above as the message.
Configure your bot or API bridge (like PineConnector, AutoView, or WunderTrading) to route signals to Delta Exchange.
On Delta, use BTCUSD or ETHUSD Perpetual pairs with moderate leverage (3x–5x).
Enable Cross Margin for smooth drawdown handling.
Test first on Delta Testnet for safety.
Why 4H BTC & ETH Works Best
• 4H candles capture true volatility swings and filter lower-timeframe noise.
• Aligns with institutional liquidity cycles in BTC and ETH.
• ATR and volume-based stops perform optimally on larger bars.
• Smoother equity curve and less drawdown compared to intraday trading.
• Ideal for traders seeking structured, medium-term trades with high reward-to-risk.
Unique Edge
• Combines breakout, order-block, and volatility principles into one adaptive model.
• Incorporates volatility normalization (ATR/BBWidth) for multi-market adaptability.
• Dynamic ATR stops and trailing protect capital during unstable phases.
• Volume and trend exits create layered protection systems.
• 4H optimization eliminates noise and provides clear institutional alignment.
• SmartMoney preset auto-configures settings to mimic large-player behavior.
• Fully automated via webhooks — no manual execution required.
• Modular design lets you customize each component for different trading styles.
TradingView Bot Integration
TitanEdge is fully plug-and-play with all TradingView-compatible bots.
Each alert sends structured JSON data containing direction, symbol, and quantity, ready for execution on your connected broker.
You can route the data to:
• PineConnector (MT4/MT5 bridge)
• WunderTrading
• AutoView
• Custom Node/REST API handler
This makes TitanEdge a professional-grade strategy suitable for semi-automatic or fully automated crypto trading setups.
Professional Recommendations
• Timeframe: 4H
• Instruments: BTCUSDT, ETHUSDT
• Exchange: Delta Exchange (Perpetual Futures)
• Leverage: 3x–5x
• Session Filter: Off (crypto 24/7)
• Risk per trade: 0.5%–1% of total equity
• Alert Type: Once Per Bar Close
• Volatility Filter: 25–35 depending on market activity
• Always use realistic slippage and fees for backtests.
Summary
TitanEdge Algo Suite is a complete trading framework built to deliver institutional-quality precision with full automation support.
It captures powerful volatility expansions on 4H BTC and ETH charts using clean structure, adaptive stops, and directional trend filters.
Every feature — from entry logic to exits — is designed to protect capital and amplify performance through disciplined, volatility-aware execution.
TitanEdge is not just another script — it’s a professional-grade algorithm that combines volatility intelligence, structural precision, and adaptive risk control.
TitanEdge Algo Suite = Smart Logic × Trend Discipline × Adaptive Risk Control
Optimized for BTC & ETH on 4H charts. Built for traders who demand precision, control, and consistency.

Extended MacrosExtended Macro Times from XX:42 to XX:15.
These are the times to trade and when the Smart Money Reversal is likely to occur.

SMC Adaptive Breakout v1XSMC Adaptive Breakout v1X — Adaptive Smart Money Breakout Strategy
SMC Adaptive Breakout v1X is a Smart-Money–inspired breakout strategy that adapts to changing volatility and market structure in real time. It identifies recent pivot structure, verifies volatility expansion, uses ATR-scaled stops, and manages exits with fixed profit targets plus price-based trailing.
Why this strategy is unique / original
This strategy combines three concept layers into a single, cohesive system: (1) structure detection using adaptive pivots, (2) a normalized volatility filter (range percentile over a long lookback) to permit only expansion-phase breakouts, and (3) context-aware trade management using ATR-scaled stops and percentage-based profit/ trailing rules. The combination reduces false breakouts during low-volatility periods while preserving entries when institutional-style expansion occurs.
Core logic (high level)
1. Structure detection: recent pivot highs and lows (configurable lookback) form the active Support and Resistance reference levels used to define breakouts.
2. Volatility confirmation: raw bar range is normalized into a percentile within a long volatility lookback window; breakouts are only considered when normalized volatility exceeds the user filter threshold.
3. Order-block / gap detection: the script detects large price gaps relative to ATR(200) and flags them as bullish/bearish gaps (order-block style footprints) to add confluence to entries.
4. Entry criteria: a long entry is signalled when price closes above the most recent resistance and the volatility filter is satisfied (or a bullish gap condition is met). Shorts mirror this logic below support. Debug/force flags allow manual/backtest forcing of trades.
5. Risk & exits: stops are ATR-based (ATR length configurable, multiplier configurable) giving context-aware stop distances. Each entry sets a profit target as a percent of entry and attaches a trailing exit (points and offset defined as percent of price) to protect profits. Exits are placed with one strategy.exit per entry so they are executed by the strategy engine.
6. Non-premature confirmation: entries are determined using closed-bar conditions (no intrabar triggers), consistent with strategy backtesting expectations.
Key inputs (and what they control)
1. Levels Period (length) — pivot lookback used to compute support/resistance structure; larger values = larger, fewer zones.
2. Volatility Filter (filter 0–100) — normalized volatility threshold (percentile) required to allow breakout signals. Increase to reduce signals during quiet markets.
3. Volatility lookback (volatility_len) — window length used to normalize the raw range into a percentile.
4. ATR length (atr_len) & ATR Stop Multiplier (atr_multiplier) — ATR parameters used for stop distance; ATR gives volatility-adaptive stop sizing.
5. Profit target (%) — target as percent of entry price.
6. Trailing points (%) & offset (%) — trailing stop size and activation offset, expressed as percent of price (converted internally to price points).
7. Visual & debug toggles — show/hide levels, entry markers, and enable debug/force entry flags for manual/backtest validation.
Practical Usage & Recommended Settings
Timeframes – Works efficiently across multiple time horizons.
• 5–15 minutes → Scalping setups.
• 15 minutes–1 hour → Intraday opportunities.
• 4 hours–1 day → Swing trading confirmation.
Adjust length and Volatility Filter parameters to match your timeframe and instrument behavior.
Default Sensitivity –
The default length = 20 offers balanced structure detection.
• Lower values → faster, more frequent signals.
• Higher values → smoother structure and fewer breakouts.
Volatility Tuning –
Modify the Volatility Filter (0–100) according to market conditions.
• Increase the filter during low-volume or choppy sessions to reduce false signals.
• Decrease it during trending or high-volatility markets for greater responsiveness.
Stop / Target Sizing –
ATR-based stop-losses automatically adapt to market volatility.
• Recommended starting point: ATR Multiplier = 1.5 and Profit Target = 1.5%.
• Fine-tune both based on each asset’s typical volatility profile.
Backtesting –
Use TradingView’s built-in Strategy Tester to analyze results over different symbols and timeframes.
The strategy executes only on bar close, ensuring accurate, non-repainting backtest results.
What the strategy plots / visual cues
•Forward-extended pivot lines for support/resistance (configurable color/transparency).
•Order-block / gap markers when large ATR-scaled gaps are detected.
•Entry labels (“LONG” / “SHORT”) at position changes if enabled.
•Strategy entries/exits are placed through strategy.entry and strategy.exit so performance reports are available in the Tester.
Risk management & notes
•This script is a discretionary tool — it automates entries and exits for backtesting and strategy simulation, but users should still confirm trades with broader market context and higher-timeframe bias.
•Always run thorough backtests (multi-symbol, multi-timeframe) and forward test on a paper account before any live deployment.
•Adjust position sizing externally; the strategy code sets orders and exits but does not enforce a specific money-management sizing rule. Use the strategy tester’s default position size controls or integrate a sizing method in your own workflow.
Technical details & behavior
•Pine Script v6 strategy.
•Uses closed-bar confirmation for signals (no repainting on close).
•Order-block / gap detection uses ATR(200) as a volatility reference to identify large structural gaps.
•Trail calculations convert percent-based inputs to absolute price units each bar to maintain consistent behavior across price levels.
Limitations & disclaimers
•Past performance is not indicative of future results. This strategy does not guarantee profits and will produce losing trades.
•Results depend on parameter choices, instrument volatility, market regime, and execution slippage. Always test on the exact symbol and timeframe you intend to trade.
Invite-only / Access note (for Publish window)
This strategy is invite-only. Please use the TradingView Request Access button on this page to request access.

Dynamic FVG & Trap Zones📘 Dynamic FVG & Trap Zones (DFTZ)
A Hybrid Model Combining Imbalance Mapping, Volume Behavior, and Trap Detection
Concept Overview
“Dynamic FVG & Trap Zones” is built to visualize real-time Fair Value Gaps (FVGs) and identify liquidity trap events inside those gaps using adaptive volume filters and wick-based logic.
Traditional FVG indicators merely mark imbalance zones between consecutive candles, but this model goes further — it measures how volume reaction and price penetration inside those zones reveal potential f alse moves or trap formations by smart money.
⚙️ How It Works
1. FVG Detection
• A Bullish FVG is detected when low > high , showing a price void left by aggressive buying.
• A Bearish FVG forms when high < low , implying a selling imbalance.
• These zones are automatically drawn as semi-transparent boxes that extend forward for 10 bars and decay once they exceed the configurable lookback window.
2. Volume Normalization & Grading
• Every bar’s volume is compared against a dynamic SMA( volLookback ) average to calculate a Volume Grade = current vol / avg vol.
• Only bars exceeding the Min Volume Grade threshold are eligible to generate valid FVG zones, ensuring that low-participation moves are ignored.
• The Trap Volume Threshold sets how quiet the reaction bar must be (relative to average volume) to qualify as a trap event.
3. Trap Detection Logic
• Each active FVG zone monitors incoming candles.
• A potential trap is triggered when price re-enters the zone (body or wick depending on settings) but fails to expand with confirming volume.
• If the event occurs inside a Bullish FVG, it marks a Bear Trap (green zone turned red).
If it happens inside a Bearish FVG, it flags a Bull Trap (red zone turned green).
• This reversal in zone color visually conveys trapped liquidity and potential directional fade.
4. Exclusivity and Cooldown Control
• To avoid signal clustering, you can choose exclusivity modes:
Allow Both, Bear over Bull, or Bull over Bear.
• A built-in per-signal cooldown timer prevents back-to-back plots of the same type, enhancing signal clarity during rapid price action.
5. Adaptive Visualization
• Wick-based vs body-based trap detection (toggleable).
• Optional cooldown filtering on shapes ensures the chart only displays validated events.
• Old FVG boxes are pruned automatically beyond the chosen lookback horizon.
🧠 Why It’s Different
Unlike static FVG detectors or simple liquidity sweep tools, DFTZ blends:
• Volume context (Smart Volume Grade filtering)
• Behavioral trap detection within imbalance zones
• Dynamic cooldown mechanics that control over-signaling
• Forward-propagating zones that self-expire gracefully
This synergy makes it a compact yet powerful tool for visualizing imbalances + liquidity traps in one framework — ideal for discretionary traders combining SMC concepts with volume analytics.
📈 How to Use
• Primary Context: Use on 15 min to 1 h charts to spot active FVG zones forming after impulsive moves.
• Trap Signal Interpretation:
• 🔴 “Trap” below bar → Bullish reversal (Bear Trap).
• 🟢 “Trap” above bar → Bearish reversal (Bull Trap).
• Combine With: Market structure breaks, VWAP, or delta volume tools to confirm true reversal intent.
• Alerts: All major events (FVG creation & trap confirmation) trigger ready-to-use alerts for automation or back-testing.
🧩 Customization
Setting Function
Max FVG Lookback Controls how long old zones remain active.
Volume SMA Period Defines the baseline for volume grading.
Min Volume Grade & Trap Volume Threshold Tune the sensitivity of trap confirmation.
Wick-Based Trap Detection Enable to capture wick rejections inside zones.
Signal Cooldown Prevents rapid multiple plots on successive bars.
⚠️ Disclaimer
This tool is designed for educational and analytical purposes only. It does not constitute financial advice or guarantee trading performance. Always conduct your own analysis and risk management before entering a position.

Market Structure Trailing Stop MTF [Inspired by LuxAlgo]# Market Structure Trailing Stop MTF
**OPEN-SOURCE SCRIPT**
*208k+ views on original · Modified for MTF Support*
This indicator is a direct adaptation of the renowned **Market Structure Trailing Stop** by **LuxAlgo** (original script: [Market Structure Trailing Stop ]()). The core logic remains untouched, providing dynamic trailing stops based on market structure breaks (CHoCH/BOS). The **only modification** is the addition of **Multi-Timeframe (MTF) support**, allowing users to apply the trailing stops and structures from **higher timeframes (HTF)** directly on their current chart. This enhances usability for traders analyzing cross-timeframe confluence without switching charts.
**Special thanks to LuxAlgo** for releasing this powerful open-source tool under CC BY-NC-SA 4.0. Your contributions to the TradingView community have inspired countless traders—grateful for the solid foundation!
## 🔶 How the Script Works: A Deep Dive
At its heart, this indicator detects **market structure shifts** (bullish or bearish breaks of swing highs/lows) and uses them to generate **adaptive trailing stops**. These stops trail the price while protecting profits and acting as dynamic support/resistance levels. The MTF enhancement pulls this logic from user-specified higher timeframes, overlaying HTF structures and stops on the lower timeframe chart for seamless multi-timeframe analysis.
### Core Logic (Unchanged from LuxAlgo's Original)
1. **Pivot Detection**:
- Uses `ta.pivothigh()` and `ta.pivotlow()` with a user-defined lookback (`length`) to identify swing highs (PH) and lows (PL).
- Coordinates (price `y` and bar index/time `x`) are stored in persistent variables (`var`) for tracking recent pivots.
2. **Market Structure Detection**:
- **Bullish Structure (BOS/CHoCH)**: Triggers when `close > recent PH` (break above swing high).
- If `resetOn = 'CHoCH'`, resets only on major shifts (Change of Character); otherwise, on all breaks.
- Sets trend state `os = 1` (bullish) and highlights the break with a horizontal line (dashed for CHoCH, dotted for BOS).
- Initializes trailing stop at the local minimum (lowest low since the pivot) using a backward loop: `btm = math.min(low , btm)`.
- **Bearish Structure**: Triggers when `close < recent PL`, mirroring the bullish logic (`os = -1`, local maximum for stop).
- Structure state `ms` tracks the break type (1 for bull, -1 for bear, 0 neutral), resetting based on user settings.
3. **Trailing Stop Calculation**:
- Tracks **trailing max/min**:
- On new bull structure: Reset `max = close`.
- On new bear: Reset `min = close`.
- Otherwise: `max = math.max(close, max)` / `min = math.min(close, min)`.
- **Stop Adjustment** (the "trailing" magic):
- On fresh structure: `ts = btm` (bull) or `top` (bear).
- In ongoing trend: Increment/decrement by a percentage of the max/min change:
- Bull: `ts += (max - max ) * (incr / 100)`
- Bear: `ts += (min - min ) * (incr / 100)`
- This creates a **ratcheting effect**: Stops move favorably with the trend but never against it, converging toward price at a controlled rate.
- **Visuals**:
- Plots `ts` line colored by trend (teal for bull, red for bear).
- Fills area between `close` and `ts` (orange on retracements).
- Draws structure lines from pivot to break point.
4. **Edge Cases**:
- Variables like `ph_cross`/`pl_cross` prevent multiple triggers on the same pivot.
- Neutral state (`ms = 0`) preserves prior `max/min` until a new structure.
### MTF Enhancement (Our Addition)
- **request.security() Integration**:
- Wraps the entire core function `f()` in a security call for each timeframe (`tf1`, `tf2`).
- Returns HTF values (e.g., `ts1`, `os1`, structure times/prices) to the chart's context.
- Uses `lookahead=barmerge.lookahead_off` for accurate historical repainting-free data.
- Structures are drawn using `xloc.bar_time` to align HTF lines precisely on the LTF chart.
- **Multi-Output Handling**:
- Separate plots/fills/lines for each TF (e.g., `plot_ts1`, `plot_ts2`).
- Colors and toggles per TF to distinguish HTF1 (e.g., teal/red) from HTF2 (e.g., blue/maroon).
- **Benefits**: Spot HTF bias on LTF entries, e.g., enter longs only if both TF1 (1H) and TF2 (4H) show bullish `os=1`.
This keeps the script lightweight—**no repainting, max 500 lines**, and fully compatible with LuxAlgo's original behavior when TFs are set to the chart's timeframe.
## 🔶 SETTINGS
### Core Parameters
- **Pivot Lookback** (`length = 14`): Bars left/right for pivot detection. Higher = smoother structures, fewer signals; lower = more noise.
- **Increment Factor %** (`incr = 100`): Speed of stop convergence (0-∞). 100% = full ratchet (mirrors max/min exactly); <100% = slower trail, reduces whipsaws.
- **Reset Stop On** (`'CHoCH'`): `'CHoCH'` = Reset only on major reversals (dashed lines); `'All'` = Reset on every BOS/CHoCH (tighter stops).
### MTF Support
- **Timeframe 1** (`tf1 = ""`): HTF for first set (e.g., "1H"). Empty = current chart.
- **Timeframe 2** (`tf2 = ""`): Second HTF (e.g., "4H"). Enables dual confluence.
### Display Toggles
- **Show Structures** (`true`): Draws horizontal lines for breaks (per TF colors).
- **Show Trailing Stop TF1/TF2** (`true`): Plots the stop line.
- **Show Fill TF1/TF2** (`true`): Area fill between close and stop.
### Candle Coloring (Optional)
- **Color Candles** (`false`): Enables custom `plotcandle` for body/wick/border.
- **Candle Color Based On TF** (`"None"`): `"TF1"`, `"TF2"`, or none. Colors bull trend green, bear red.
- **Candle Colors**: Separate inputs for bull/bear body, wick, border (e.g., solid green body, transparent wick).
### Alerts
- **Enable MS Break Alerts** (`false`): Notifies on structure breaks (bull/bear per TF) **only on bar close** (`barstate.isconfirmed` + `alert.freq_once_per_bar_close`).
- **Enable Stop Hit Alerts** (`false`): Triggers on stop breaches (long/short per TF), using `ta.crossunder/crossover`.
### Colors
- **TF1 Colors**: Bullish (teal), Bearish (red), Retracement (orange).
- **TF2 Colors**: Bullish (blue), Bearish (maroon), Retracement (orange).
- **Area Transparency** (`80`): Fill opacity (0-100).
## 🔶 USAGE
Trailing stops shine in **trend-following strategies**:
- **Entries**: Use structure breaks as signals (e.g., long on bullish BOS from HTF1).
- **Exits**: Trail stops for profit-locking; alert on hits for automation.
- **Confluence**: Overlay HTF1 (e.g., 1H) for bias, HTF2 (e.g., Daily) for major levels—enter LTF only on alignment.
- **Risk Management**: Lower `incr` avoids early stops in chop; reset on `'All'` for aggressive trailing.
! (i.imgur.com)
*HTF1 shows bullish structure (teal line), trailing stop ratchets up—long entry confirmed on LTF pullback.*
! (i.imgur.com)
*TF1 (blue) bearish, TF2 (red) neutral—avoid shorts until alignment.*
! (i.imgur.com)
*Colored based on TF1 trend: Green bodies on bull `os=1`.*
Pro Tip: Test on demo—pair with LuxAlgo's other tools like Smart Money Concepts for full structure ecosystem.
## 🔶 DETAILS: Mathematical Breakdown
On bullish break:
- Local min: `btm = ta.lowest(n - ph_x)` (optimized loop equivalent).
- Stop init: `ts = btm`.
- Update: `Δmax = max - max `, `ts_new = ts + Δmax * (incr/100)`.
Bearish mirrors with `Δmin` (negative, so decrements `ts`).
In MTF: HTF `time` aligns lines via `line.new(htf_time, level, current_time, level, xloc.bar_time)`.
No logs/math libs needed—pure Pine v5 efficiency.
## Disclaimer
This is for educational purposes. Not financial advice. Backtest thoroughly. Original by LuxAlgo—modify at your risk. See TradingView's (www.tradingview.com). Licensed under CC BY-NC-SA 4.0 (attribution to LuxAlgo required).

Session Engine — Market Opens, Killzones & Levels — SMC/ICTSession Engine — Market Opens, Killzones & Institutional Levels (Tokyo • London • New York) — SMC/ICT — TradingATH (PueblaATH)
Precision. Sessions. Structure.
Session Engine maps the institutional heartbeat of the day across Tokyo , London , and New York . It draws timezone-accurate Market Open Lines , clean Killzones (incl. London–NY overlap), and a rock-solid, timeframe-safe suite of Previous High/Low Levels (PDH/PDL/PWH/PWL/PMH/PML). On top, a compact Session Comparison Table with an integrated ADR panel shows extension, momentum context, and distance to key levels — at a glance.
Designed for SMC/ICT Traders who demand clarity and reliability, this tool stays stable when you change timeframe, reload, or zoom.
Map the day like a Pro : timezone-true Opens, configurable Killzones, TF-safe PDH/PDL/PWH/PWL/PMH/PML , and a sleek ADR panel beneath a Session Comparison Table . Built for precision SMC/ICT Execution . Zero flicker, full control.
Why Traders Love It
Timezone-Accurate Session Engine — Tokyo, London, New York opens and the London–NY overlap, all resolved to bar-time for precise plotting on any symbol.
Killzones you can trust — choose full-column height or price-bounded height with custom top/bottom tick offsets and label placement.
Bulletproof Previous Levels — PDH, PDL, PWH, PWL, PMH, PML are cached and only refresh on true D/W/M boundaries, eliminating the classic “levels disappear on TF change” problem.
Actionable Context — a compact Session Comparison Table (vs previous session & vs previous day) plus an ADR panel with extension thresholds, distance to PDH/PDL, and current H-L range.
Serious Customization — dotted/solid lines, widths, label size & alignment, auto label backgrounds, block transparency, weekend & timeframe filters, and more.
Performance-Minded — persistent objects are updated in place (not spam-created) to keep your chart crisp and responsive.
What You’ll See
Market Opens — Vertical opens for TOK/LDN/NY with dotted/solid styling, width control, infinite or bounded height, and optional labels.
Killzones + Overlap — Transparent time boxes for session windows (and London–NY overlap). Optional labels, adjustable transparency, and height mode.
Institutional Levels — PDH / PDL / PWH / PWL / PMH / PML with length modes: Infinite, N bars, or End of day. Optional labels with typographic control.
Session Comparison Table — For each session: bias vs previous session and previous day, with optional Δ% column.
ADR Panel — 24h rolling ADR% consumption with two attention thresholds, distance to PDH/PDL (price units), and current H-L range.
How It Works
Session Timing uses explicit IANA timezones (Asia/Tokyo, Europe/London, America/New_York) then anchors to bar_time for pixel-perfect placement.
Killzones are persistent boxes that reset only on daily change, preventing redundant object creation.
Previous Levels are requested once per true period roll (D/W/M) and stored locally; this cache keeps lines stable when switching TFs or reloading charts.
Level Line Length is enforced per-object (Infinite, N bars, End of day) with dynamic x2 handling — no redraw flicker.
ADR uses a timeframe-agnostic 24h rolling window for H/L/range; ADR length is defined in “days” and mapped to bars for any timeframe.
How to Use
Set Session Times (defaults are standard). Adjust the London–NY overlap if your venue differs.
Style your Opens & Killzones — line width, dotted/solid, infinite or bounded height, label font size/align/background.
Choose Level Behavior — Infinite, N bars, or End of day for PD/ PW / PM lines; toggle labels as needed.
Read the Table and ADR — quick bias vs previous session/day, Δ% if you enable it; ADR panel highlights extension with blink thresholds and shows live distance to PDH/PDL.
Inputs
Schedules — Open times + killzone windows for TOK/LDN/NY, and London–NY overlap.
Style — Line width, dotted/solid, label sizes & alignment, auto backgrounds.
Heights — Infinite or tick-bounded line height; full-column or tick-bounded killzones.
Levels — Show/hide PDH/PDL/PWH/PWL/PMH/PML; length mode; label options.
Table & ADR — Font size, arrows, Δ% column, ADR length (days), blink thresholds, show/hide rows.
Filters — Hide visuals on specified timeframe ranges; optional weekend suppression.
Best Practices
Use “End of day” for tidy level lines that still convey right-hand context.
Set ADR thresholds to your instrument’s personality (e.g., 80/120 for FX, 100/150 for crypto).
On exotic trading sessions, verify the IANA timezone alignment and tweak inputs accordingly.
If you stack many tools, consider disabling unused sessions/rows to stay within object limits.
What Makes It Original
A cohesive Session Engine architecture that unifies timezone-true Opens, configurable Killzones/Overlap, and TF-safe previous levels — tailored for SMC/ICT execution.
Robust caching that eliminates TF-switch flicker and preserves dependent calculations (distance to PDH/PDL, ADR%) without gaps.
A unified ADR panel directly under the session table with real-time extension signaling and distance-to-PDH/PDL — pragmatic, trade-ready context you won’t find in generic session scripts.
Deep length & typography controls so visuals are informative and elegant.
Notes & Disclaimer (Originality & Rights)
Original Work Notice — Please read — This script/indicator is an original work created exclusively by TradingATH ( PueblaATH ). It is not derived from, copied from, or authored by any other person or entity. Any resemblance to other scripts is coincidental and limited to the use of public and widely known trading concepts.
Usage & Publication — Redistribution, cloning, or republishing this script (in whole or in part) without the explicit written permission of TradingATH ( PueblaATH ) is prohibited. By using this tool, you acknowledge the author’s exclusive authorship and associated rights.
No Financial Advice — This tool is for educational/informational purposes only and does not constitute financial advice. Markets carry risk; manage your risk and make your own decisions.
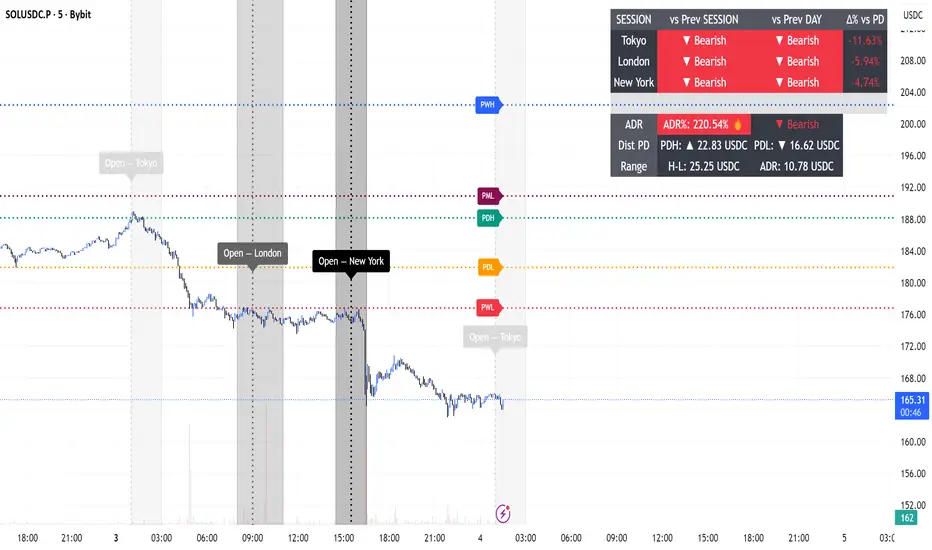
Order Blocks & Market Structure (SMC)# Order Blocks & Market Structure (SMC)
## 📊 Overview
A Smart Money Concepts indicator that identifies institutional order blocks (OB), market structure breaks (MSB), and breaker blocks (BB) with volume-based strength analysis. Designed for traders seeking to identify institutional accumulation/distribution zones and market structure shifts.
## 🎯 Originality Statement
This indicator combines multiple analytical approaches into a unified system:
- **Multi-level OB strength classification** using volume spike detection and body ratio analysis (OB/OB+/OB++)
- **Automatic lifecycle tracking** that converts invalidated Order Blocks to Breaker Blocks with polarity reversal
- **Volume context integration** showing buyer/seller dominance percentage at block formation
- **Dynamic zone extension** that updates OB boundaries until price interaction or invalidation
- **Delayed touch alerts** (5-bar minimum) to filter premature retest signals
Unlike simple order block scripts that only mark zones, this tool provides strength assessment, volume analysis, and intelligent state management throughout the block lifecycle.
## ⚙️ Technical Methodology
**Market Structure Detection:**
Uses pivot-based swing point analysis to identify trend changes. When price closes above a pivot high (bullish MSB) or below a pivot low (bearish MSB), the structure is marked with horizontal reference lines.
**Order Block Identification:**
Searches the specified lookback period for the lowest low (bullish MSB) or highest high (bearish MSB). When a strong directional candle is found (opposite color to trend direction), its range becomes an OB zone.
**Strength Analysis:**
- Compares candle volume against 20-period SMA with configurable multiplier (1.2-3.0x)
- Calculates body-to-range ratio to assess candle strength (0.4-0.8 threshold)
- Assigns strength levels: Standard (no conditions), Strong (one condition), Premium (both conditions)
**Breaker Block Conversion:**
When price closes completely through an OB zone (bullish OB broken downward or bearish OB broken upward), the zone automatically converts to BB with reversed polarity and color.
## 📋 Features
**Market Structure (MSB):**
- Detects bullish and bearish structure breaks
- Configurable swing length (5-50 bars)
- Visual markers with horizontal lines
**Order Blocks (OB):**
- Three strength tiers: OB (standard), OB+ (strong), OB++ (premium)
- Volume percentage display (buyer vs seller dominance)
- Dynamic zone extension until invalidation
**Breaker Blocks (BB):**
- Automatic conversion from failed OBs
- Polarity tracking (bullish ↔ bearish)
- Fixed zones after conversion
## 🔧 Settings Documentation
**Market Structure Group:**
*Show Market Structure* - Enable/disable MSB detection and line drawing
- Default: ON
- When OFF: No structure lines or labels appear
*MSB Labels* - Display text labels at structure break points
- Default: ON
- Labels show "MSB" at the break candle
*Swing Length* - Lookback period for pivot point detection
- Range: 5-50 bars
- Default: 10
- Higher values = longer-term structure, fewer signals
- Lower values = short-term structure, more signals
*Bull Color* - Color for bullish elements (MSB, bullish OB, bullish BB)
- Default: #089981 (green)
*Bear Color* - Color for bearish elements (MSB, bearish OB, bearish BB)
- Default: #f23645 (red)
**Order Block Group:**
*Order Blocks* - Enable/disable OB detection and zone drawing
- Default: ON
- When OFF: No boxes appear (MSB lines still show if enabled)
*OB Strength* - Enable multi-level strength classification
- Default: ON
- When ON: Labels show OB/OB+/OB++ based on analysis
- When OFF: All zones labeled simply as "OB"
*Volume %* - Display buyer/seller volume percentage
- Default: ON
- Shows "X% Buy" or "X% Sell" inside zones
- Calculated over 10 bars from zone formation
*OB Lookback* - How many bars to search for OB candle
- Range: 5-30 bars
- Default: 10
- Searches for lowest low (bullish) or highest high (bearish) within this range
*Vol Threshold* - Minimum volume multiplier for strength upgrade
- Range: 1.2-3.0x
- Default: 1.5x
- Volume must exceed (20-period SMA × threshold) for OB+ or OB++
*Body Ratio* - Minimum body-to-range ratio for strength upgrade
- Range: 0.4-0.8
- Default: 0.6
- Candle body must be at least this proportion of total range for OB+ or OB++
## 📖 How to Use
**For Trend Following:**
1. Wait for MSB in your desired direction
2. OB forms in the breakout area (the institutional entry zone)
3. Price may immediately continue or pull back to retest OB
4. Enter on OB retest with "OB Touch" alert (after 5+ bars from creation)
5. Higher strength OB (OB+, OB++) indicates stronger institutional activity
**For Reversal Trading:**
1. Identify Breaker Blocks (former OBs that failed)
2. BB represents potential reversal zone with opposite polarity
3. Wait for MSB in BB direction for confirmation
4. Enter on pullback to BB zone
**Volume Analysis:**
- 70%+ Buy/Sell dominance = strong institutional bias
- 60-70% = moderate bias
- 50-60% = weak bias, use caution
**Optimal Conditions:**
- Works best on trending markets (4H, Daily, Weekly timeframes)
- Less effective in tight ranges or low-volume periods
- Major pairs/assets with good liquidity recommended
## 🔔 Alert Conditions (8 Types)
The indicator provides the following alerts:
1. **Bullish MSB** - Upward market structure break detected
2. **Bearish MSB** - Downward market structure break detected
3. **Bullish OB Created** - New bullish order block formed
4. **Bearish OB Created** - New bearish order block formed
5. **Bullish BB Created** - Bearish OB converted to bullish BB
6. **Bearish BB Created** - Bullish OB converted to bearish BB
7. **Bullish OB Touch** - Price revisited bullish OB (minimum 5 bars after creation)
8. **Bearish OB Touch** - Price revisited bearish OB (minimum 5 bars after creation)
Touch alerts include a 5-bar delay to avoid alerting on immediate continuation moves.
## ⚠️ Limitations & Risk Disclosure
**Known Limitations:**
- MSB signals can produce whipsaws in ranging or choppy markets
- Not all OB touches result in successful trades
- OB zones may be tested multiple times before activation
- Volume data may be unavailable or unreliable on some instruments/exchanges
- Strength analysis requires sufficient volume history
- Historical repainting: OB zones extend dynamically as price interacts with them
**Risk Considerations:**
This indicator is designed for educational and analytical purposes. It identifies potential institutional zones but does not predict price movement. Past identification of zones does not guarantee future trading success. OB and BB zones represent areas of interest, not guaranteed support/resistance. Always use proper risk management, combine with other analysis methods, and never risk more than you can afford to lose.
## 🎨 Visual Guide
**Colors & Symbols:**
- 🟢 Green boxes = Bullish Order Blocks / Bullish Breaker Blocks
- 🔴 Red boxes = Bearish Order Blocks / Bearish Breaker Blocks
- Horizontal lines = Market Structure Break levels
- "MSB" labels = Structure break points (above/below line)
- "OB" / "OB+" / "OB++" labels = Order Block strength (right side of box)
- "BB" labels = Breaker Block (converted from OB)
- "X% Buy/Sell" labels = Volume analysis (center of box)
**Box Behavior:**
- OB zones extend to the right as long as price interacts with them (not broken)
- When OB is invalidated, it stops extending and converts to BB
- BB zones remain fixed at their invalidation point
## 💡 Best Practices
- Focus on OB+ and OB++ zones for higher probability setups
- Confirm OB touches with price action (rejection wicks, engulfing patterns)
- Use multiple timeframe analysis (Daily OB + 4H entry)
- Avoid trading in the first 1-2 bars after OB creation (wait for touch alert)
- Consider volume % - avoid zones with <60% dominance
- Combine with other confluence factors (Fibonacci, support/resistance)
- Set realistic stop losses beyond the OB/BB zone
---
**Version:** 1.0
**Pine Script:** Version 6
**Category:** Smart Money Concepts, Order Flow, Market Structure
For questions or suggestions, use the TradingView comments section below.
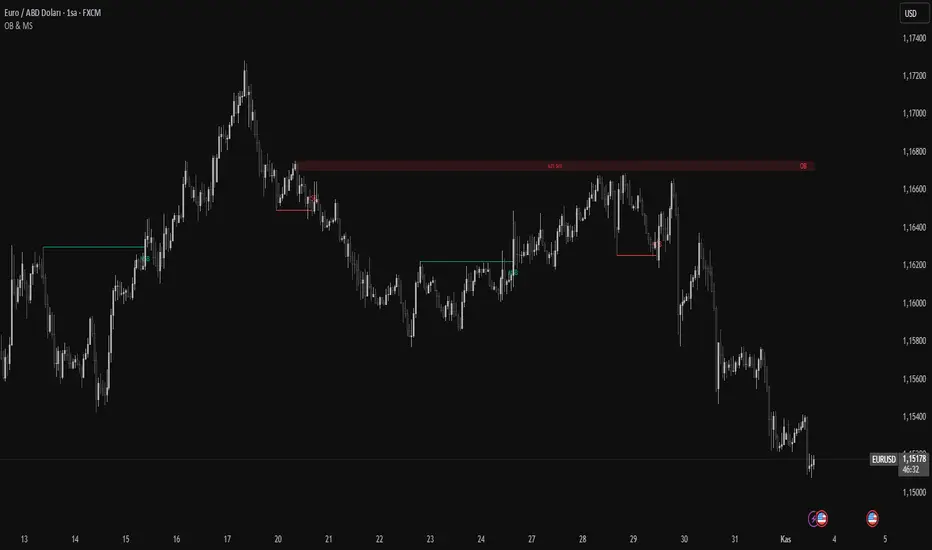
Custom Horizontal Lines | Trade Symmetry📊 Custom Horizontal Lines
🔍 Overview
The Custom Horizontal Lines is a precision utility designed for traders who perform manual higher-timeframe analysis and want to preserve their marked price levels directly on the chart.
It doesn’t calculate or detect anything automatically — instead, it acts as your personal level memory, preserving your analyzed zones and reference prices throughout the session.
Ideal for traders who manually mark the High, Low, Open, Close, Mean Thresholds, and Quarter Levels of Order Blocks, Fair Value Gaps, Inversion Fair Value Gaps and Wicks before the trading day begins.
⚙️ Key Features
✅ Manual Level Entry — Input your analyzed price levels (OB, FVG, WICK,etc) directly into the indicator settings.
✅ Preserved Levels — Once entered, your lines stay visible and consistent — even after switching symbols, timeframes, or reloading the chart.
✅ Supports All Level Types — Store any kind of manually defined level: OB highs/lows, FVG boundaries, Wicks, Mean Thresholds, Quarter levels, or custom reference prices.
✅ Clean Visualization — Customize line color, style, and labels for easy visual organization.
✅ Session-Ready Workflow — Built for pre-market preparation — enter your HTF levels once, and trade around them all day.
✅ No Auto Calculations — 100% manual by design — ensuring only your analyzed levels are shown, exactly as you defined them.
💡 How to Use
Open the indicator’s settings and manually enter those price values.
The indicator will plot and preserve those exact levels on your chart.
Switch to your lower timeframe and observe how price reacts around them — without ever needing to redraw.
🎯 Why It’s Useful
Keeps your HTF levels organized and persistent across sessions.
Saves time by avoiding redrawing.
Fits perfectly into ICT / Smart Money trading workflows.
Ensures full manual control and precision over what’s displayed on your chart.
🧩 Ideal For
ICT and Smart Money traders
Institutional-style manual analysts
Traders marking Mean Thresholds, or Quarter Levels of OBs, FVGs, Wicks etc
Anyone who wants a clean, reliable way to preserve their manual analysis

Lord Mathew ATSThe Smart Money Structure & Pattern Analyzer is a complete, all-in-one visual trading system that brings together every essential element of Smart Money Concepts (SMC), ICT methodology, and candlestick psychology into one powerful indicator.
It is designed to help traders instantly understand the market’s structure, liquidity flow, and potential turning points without switching tools or manually marking charts. Whether you trade forex, indices, crypto, or commodities, this indicator automatically identifies where institutional activity, imbalances, and price inefficiencies occur in real time.
With its advanced algorithm, it plots market structure shifts, equal highs and lows, liquidity zones, order blocks, fair value gaps (FVGs), and previous week and day levels (PWO, PWH, PWL, PWC, PDO, PDH, PDL, PDO). It also integrates a deep candlestick recognition engine that detects over ten classic and advanced candle formations including engulfing patterns, dojis, hammers, shooting stars, morning/evening stars, and spinning tops to provide precise confirmation at critical points of interest.
This indicator isn’t just a tool it’s a complete market map that helps traders visualize how institutional order flow and candlestick sentiment interact.
Core Features
📊 Market Structure Detection:
Automatically marks swing highs/lows, Break of Structure (BOS), and Change of Character (CHOCH) in real time.
💧 Liquidity Mapping:
Highlights equal highs/lows and liquidity grabs, showing where price is likely to target before a reversal or continuation.
🧱 Order Block Visualization:
Displays the last bullish or bearish candle before an impulsive displacement, acting as a potential institutional entry zone.
⚡ Fair Value Gap (FVG) Scanner:
Detects and highlights imbalances where price moved too fast, helping you identify high-probability retracement areas.
🕯️ Candlestick Pattern Recognition:
Recognizes key reversal and continuation patterns (engulfing, hammer, shooting star, doji, morning/evening star, etc.) in real time.
📅 Institutional Reference Points:
Plots previous week & day open (PWO, PDO), previous week & day high (PWH, PWH), previous week & day low (PWL, PDL), previous week & day close (PWC, PDC) and optionally previous day levels to help frame bias.
🎨 Customizable Design:
Toggle any feature, change colors, and set alerts when multiple Smart Money signals align for cleaner, faster decision-making.
How It Works
Add the indicator to your chart on any timeframe or market.
The algorithm automatically detects structure, liquidity, and imbalance zones.
Candlestick patterns are highlighted when they form near high-probability areas (like OBs or FVGs).
When confluence occurs such as a liquidity grab, FVG fill, and bullish engulfing candle—the indicator provides a visual signal zone for your confirmation-based entries.
You can refine your trades using higher-timeframe bias (HTF order flow) and lower-timeframe execution (LTF confirmation).
Best For
Traders using ICT, Smart Money Concepts, or price-action systems.
Intraday and swing traders looking for clear, data-driven chart structure.
Traders who want to simplify confluence analysis and focus on precision execution.
Why It Stands Out
Unlike standard candlestick or pattern scanners, this indicator merges institutional market logic with technical candle behavior, allowing traders to see where smart money might be entering or exiting positions.
It’s not about random signals it’s about context, structure, and confirmation.
Every feature in this indicator is built around the principle of liquidity engineering:
price creates liquidity, grabs it, and moves toward imbalance or order flow efficiency.
By merging that institutional logic with candlestick patterns, this tool gives traders an edge in recognizing not only where to trade but why price is reacting in that exact area.
Disclaimer
This indicator is intended for educational and analytical use. It does not provide financial advice or guaranteed trading results. Always backtest and manage your risk responsibly.

SMC INDICATORMoney Concepts (SMC) toolkit and issues buy / sell signals. It includes:
Structure (market structure shifts via pivots)
Order Blocks (last bearish/bullish candle before a structure shift)
Fair Value Gaps (3-bar gap detection)
Simple liquidity sweep detection
Buy / Sell signal generation & alert conditions
Rectangle drawings and on-chart arrows
This is a practical, best-effort SMC indicator suitable for 15m/30m/1H/etc. — feel free to tweak lookbacks and filters in inputs.
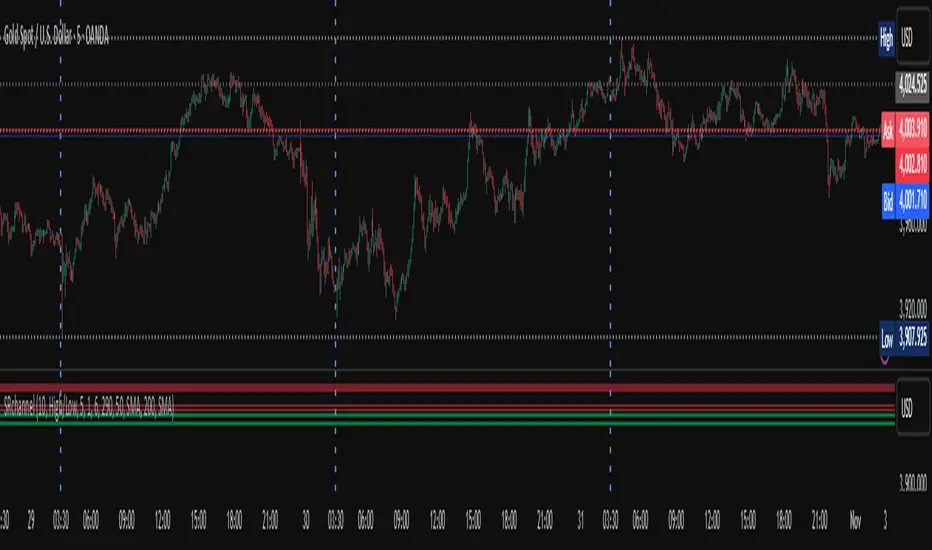
Premium/Discount Zones with Confirmation Signals📌 Indicator Description: Premium/Discount Zones with Confirmed Signals
This indicator identifies dynamic Premium, Discount, and Equilibrium zones based on recent swing highs and lows, helping traders visualize where price is considered expensive, cheap, or fair value. It’s designed for Smart Money Concepts (SMC), ICT-style trading, and anyone who values precision in zone-based analysis.
🔍 Key Features
Swing-Based Zones: Automatically detects swing highs/lows over a customizable lookback period (default: 48 bars — equivalent to 2 days on a 1-hour chart).
Premium & Discount Levels: Define overbought and oversold zones using percentage inputs (default: 25%).
Equilibrium Band (middle): Highlights the no-trade value zone with adjustable width (default: 5%).
Signal Engine: Generates trade signals based on two styles:
Bounce: Reversal signals when price reacts to a zone and confirms direction.
Breakout: Continuation signals when price breaks through a zone with momentum.
Trade Type Selector: Choose between Bounce, Breakout, or Both from the input menu.
Signal Filtering: Limits signals to one per direction at a time to reduce noise.
Visual Styling: Toggle between colored or monochrome themes for clean charting.
🧠 How It Works
Buy signals appear when price confirms strength from the discount zone or breaks above the premium zone.
Sell signals appear when price confirms weakness from the premium zone or breaks below the discount zone.
All signals include a built-in 3-bar confirmation delay to reduce false triggers.
🎯 Ideal For
Traders using SMC, ICT, or price action strategies
Zone-based scalping, swing trading, or intraday setups
Visualizing market structure and value areas with clarity
I hope you find this useful — and wish you Happy Trades!

Multi-Timeframe Fibonacci + Open Levels🟣 Multi-Timeframe Fibonacci Levels + Open Levels | Trade Symmetry
This indicator automatically plots Fibonacci levels derived from higher timeframe candle ranges — all at once, directly on your current chart.
It helps you quickly visualize confluence zones and reaction levels where institutional traders are likely to participate.
⚙️ Features
✅ Multi-timeframe Fibonacci Levels — Daily, Weekly, Monthly, Quarterly & Yearly
✅ Automatic Bullish/Bearish detection based on previous candle
✅ Dynamic overlap detection (combines overlapping Fib levels into a single clean label)
✅ Configurable Fibonacci levels, colors, and styles
✅ Optional Open-Price Levels (Daily, Weekly, Monthly)
✅ Clean memory management to keep your chart lightweight
🧠 How to Use
• Add it to any timeframe — it will automatically overlay higher timeframe Fibs.
• Use overlapping or aligned Fib zones as confluence areas.
• Combine with structure or liquidity indicators for high-probability setups.
💡 Inspired by
The concept of higher-timeframe Fibonacci confluences used in Smart Money Concepts (SMC) and ICT-style analysis.