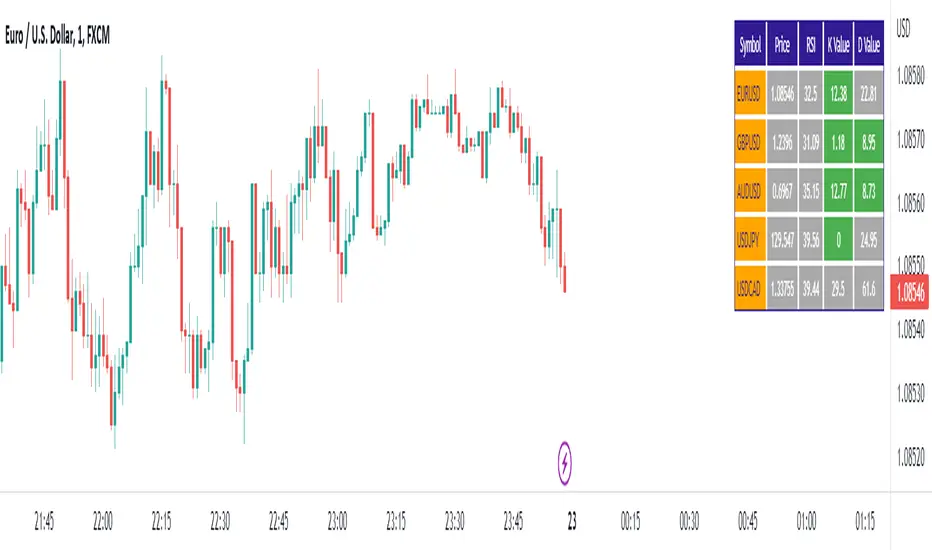
Stochastic RSI ScreenerStochastic RSI Screener is built as an indicator and can be applied to any chart.
It gives users the ability to choose 5 specific symbols to watch and then specify the required options to change the RSI and Stochastic settings in a way that fits their needs.
This screener shows the values of (CURRENT PRICE, RSI, K-VALUE, D-VALUE) for each one of the specified symbols. It will do the calculations based on the currently opened timeframe for all symbols.
Stochasticoscillator
AII - Average indicator of indicatorsThis Pine Script for TradingView is a technical analysis tool that visualizes the average of several popular indicators in the trading world. The indicators included are the RSI (Relative Strength Index), RVI (Relative Vigor Index), Stochastic RSI, Williams %R, relative MACD (ranging from 0 to 100), and Bollinger Bands price distance from 0 to 100. The script uses the "input" function to customize the length of the indicators and the "plot" function to display the results on the chart. In addition, options are included to turn off certain indicators and change the line colors if the user desires. All indicators can also be activated independently, allowing the user to see only the indicators they want. It is also mentioned that the script will be improved in the future to offer a better user experience. The calculated values are calculated with the default EMA of 14. Overall, this script is an excellent option for those looking for a combined view of several important indicators for making trading decisions.

RSI Pull-BackA pull-back occurs whenever the price or the value of an indicator breaks a line and comes back to test it before continuing in the prevailing trend.
The RSI has oversold and overbought levels such as 20 and 80 and whenever the market breaks them returns to normality, we can await a pull-back to them before the reversal continues.
This indicator shows the following signals:
* A bullish signal is generated whenever the RSI surpasses the chosen oversold level then directly shapes a pull-back to it without breaking it again.
* A bearish signal is generated whenever the RSI breaks the chosen overbought level then directly shapes a pull-back to it without surpassing it again.

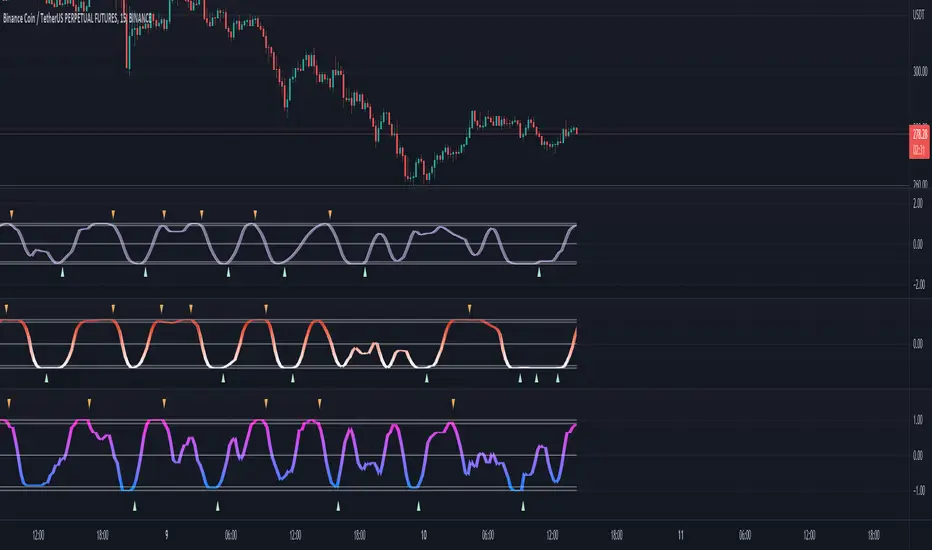
Stoch RSI 15 min - multi time frame tableABOUT THIS INDICATOR
This indicator calculates the Stochastic RSI for the time frames 15 min, 30 min, 1h, 4h, and 12h. However, the 15 min time frame should always be the default time frame for your chart.
IMPORTANT
* NOTE! It's extremely important that the chosen time frame for your chart is 15 min. Otherwise the Stochastic RSI for the longer time frames won’t be correctly calculated.
* Stochastic RSI will be calculated and displayed in a table for the time frames: 15 min, 30 min, 1h, 4h, 12h.
* All time frames are based on closed bars except the "15minR" that are realtime updated values calculated on a 15 min time frame.
ABOUT STOCHASTIC RSI
The Stochastic RSI (StochRSI) is a momentum indicator that ranges between 0 and 100. A Stochastic RSI value above 80 is considered overbought and below 20 is considered oversold.
By using different time frames you can get a better idea of what direction the trade could take in a "longer" perspective.
SETTINGS
1.) Length RSI = 14 (default period)
2.) Smoothing parameter of Stochastic RSI (Length Moving Average = 3) . Moving average of stochastic RSI
* By default the displayed Stochastic RSI values are smoothed values of the actual Stochastic RSI. The smoothnes is formed by a calculated moving average of with the length of 3 by default.
If you want Stochastic RSI with a sharper signal (higher risk for "false alarms" being more sensitive) change the Length Moving Average to = 1 (no smoothness at all)
You can see the selected "Length RSI" and "Length Moving Average" on top of the Stochastic RSI table.
Next version of this script will be updated with more a more flexible solution for different time frames.
* NOTE, Tradingview comes with a inbuilt Stochastic RSI. See the the chart below. The blue line in the Stochastic-RSI chart represents (K value = 3) the same value as the script calculate/display in the table.

Adaptive Fisherized Stochastic Center of GravityIntroduction
I modified the script "Fisher Stochastic Center of Gravity" of @DasanC for this indicator.
I added inverse Fisher transform, cycle period adaptiveness mode (Ehlers) and smoothing to it.
Moreover, I added buy and sell and beautified some stuff.
Lastly, it is also non-repainting!
Usage
This indicator can be used like a normal stochastic, but I don't recommend divergence analysis on it.
That fisherization stuff seems to make the graphs unuseable for that because it tries.
It works well on every timeframe I would say, but lower timeframes are recommended, because of the fast nature of stochastic.
Usually it does a good job on entry confirmation for reversals and trend continuation trades.
Recommended indicator to combine with this indicator is RSI cyclic smoothed v2 .
This is the best RSI version I know. In trending market it is recommended to look more on the inner bands and in flat market it is recommended to look more on the outer bands.
When RSI shows oversold and this indicator shows a crossover of the Center of Gravity plot through the bottom line -> Long entry is confirmed
When RSI shows overbought and this indicator shows a crossunder of the Center of Gravity plot through the top line -> Short entry is confirmed
Settings
The adaptive mode is enabled by default to give you straight the whole indicator experience.
The default settings are optimized, but should be changed depending on the market.
An example:
Market has a low volatility and a high momentum -> I want a slower/higher length to catch the slower new highs and lows.
Market has higher volatility and a low momentum, -> I want a faster/lower length to catch the faster new highs and lows
Signals
Crossover
Buy -> cog crossover signalLine
Sell -> cog crossunder signalLine
Overbought/Oversold Crossover
Buy -> cog crossover lowerBand
Sell -> cog crossunder lowerBand
I use this indicator a lot, because I don't know a better stochastic on this community here.
@DasanC did an awesome work with his version I used as base for this script.
Enjoy this indicator and let the profit roll! 🔥
Stochastic Vix Fix SVIX (Tartigradia)The Stochastic Vix or Stochastic VixFix (SVIX), just like the Williams VixFix, is a realized volatility indicator, and can help in finding market bottoms as well as tops without requiring bollinger bands or any other construct, as the SVIX is bounded between 0-100 which allows for an objective thresholding regardless of the past.
Mathematically, SVIX is the complement of the original Stochastic Oscillator, with such a simple transform reproducing Williams' VixFix and the VIX index signals of high volatility and hence of market bottoms quite accurately but within a bounded 0-100 range. Having a predefined range allows to find markets bottoms without needing to compare to past prices using a bollinger band (Chris Moody on TradingView) nor a moving average (Hesta 2015), as a simple threshold condition (by default above 80) is sufficient to reliably signal interesting entry points at bottoming prices.
Having a predefined range allows to find markets bottoms without needing to compare to past prices using a bollinger band (Chris Moody on TradingView) nor a moving average (Hesta 2015), as a simple threshold condition (by default above 80) is sufficient to reliably signal interesting entry points at bottoming prices.
Indeed, as Williams describes in his paper, markets tend to find the lowest prices during times of highest volatility, which usually accompany times of highest fear.
Although the VixFix originally only indicates market bottoms, the Stochastic VixFix can also indicate good times to exit, when SVIX is at a low value (default: below 20), but just like the original VixFix and VIX index, exit signals are as usual much less reliable than long entries signals, because: 1) mature markets such as SP500 tend to increase over the long term, 2) when market fall, retail traders panic and hence volatility skyrockets and bottom is more reliably signalled, but at market tops, no one is panicking, price action only loses momentum because of liquidity drying up.
Compared to Hesta 2015 strategy of using a moving average over Williams' VixFix to generate entry signals, SVIX generates much fewer false positives during ranging markets, which drastically reduce Hesta 2015 strategy profitability as this incurs quite a lot of losses.
This indicator goes further than the original SVIX, by restoring the smoothed D and second-level smoothed D2 oscillators from the original Stochastic Oscillator, and use a 14-period ZLMA instead of the original 20-period SMA, to generate smoother yet responsive signals compared to using just the raw SVIX (by default, this is disabled, as the original raw SVIX is used to produce more entry signals).
Usage:
Set the timescale to daily or weekly preferably, to reduce false positives.
When the background is highlighted in green or when the highlight disappears, it is usually a good time to enter a long position.
Red background highlighting can be enabled to signal good exit zones, but these generate a lot of false positives.
To further reduce false positives, the SVIX_MA can be used to generate signals instead of the raw SVIX.
For more information on Williams' Vix Fix, which is a strategy published under public domain:
The VIX Fix, Larry Williams, Active Trader magazine, December 2007, web.archive.org
Fixing the VIX: An Indicator to Beat Fear, Amber Hestla-Barnhart, Journal of Technical Analysis, March 13, 2015, ssrn.com
For more information on the Stochastic Vix Fix (SVIX), published under Creative Commons:
Replicating the CBOE VIX using a synthetic volatility index trading algorithm, Dayne Cary and Gary van Vuuren, Cogent Economics & Finance, Volume 7, 2019, Issue 1, doi.org
Note: strangely, in the paper, the authors failed to mention that the SVIX is the complement of the original Stochastic Oscillator, instead reproducing just the original equation. The correct equation for the SVIX was retroengineered by comparing charts they published in the paper with charts generated by this pinescript indicator.
For a more complete indicator, see:

Stochastic with DivergencesReuploading as there was an issue with the description.
This indicator uses the popular Stochastic indicator as its base. I have included the ability to draw divergences on the indicator as they occur live. By default it will be off, select the settings for the indicator and about halfway down there will be a dropdown menu that says "Off". Select it and then select which divergences you want to draw: Regular, Hidden, or Both. I like to draw both. I find that hidden divergence is really nice during a trending market and the regular divergence is works great in a range market. I also feel that the regular divergence is great during a trending market if you are given the signal but then wait for the next price movement for a double top/bottom to occur. The Stochastic indicator itself is often used in a ranging market by selling when it is overbought and buying once it indicates oversold (much like the RSI indicator). I find that it can work in trending markets if you only take overbought in a down trend and oversold in an up trend. In the above picture you can see that I had used it to trade this downtrend using both the Hidden Divergence and Sell Signals to catch the trend continuation until it failed on the fourth trade. From here I would usually start using the Stochastic as simply an oscillating indicator and buy/sell based on overbought/oversold. I've also added an option to enable the Stochastic RSI if you'd rather use that, as well as a fill option which simply colors in the space between the Stochastic and Signal lines. The Signals option will put on highlights of when to buy or sell based on overbought/oversold areas that agree with the long term trend (based on the 200 EMA).
Divergence is a short way of saying there was a higher or lower movement compared to normal but the price did not represent that movement, indicating strength or weakness in a specific direction.
Regular divergence is an indication of a trend reversal. Regular bullish divergence occurs when the price chart shows a lower low while the stochastic shows a higher low. Regular bearish divergence occurs when the price chart shows a higher high while the stochastic shows a lower high.
Hidden divergence is an indication of a trend continuation. Hidden bullish divergence occurs when the price chart shows a higher low while the stochastic shows a lower low. Hidden bearish divergence occurs when the price chart shows a lower high while the stochastic shows a higher high.
The "Only Trending Divergences" option, if enabled, will only show bearish divergences during a down trend (price is below 200 EMA) and only show bullish divergences during an uptrend (price is above 200 EMA). I like to use this option and have set it to ON by default.
The "Middle Filter" option, if enabled, ensures that Highs on the stochastic indicator will not be counted as Highs unless they are above the middle value of the oscillator (which is 50), same goes for lows: they will not be counted as Lows unless they are below the middle value of the oscillator.
I also include buy/sell signals that coincide with the trend (based on the 200 EMA). If price is currently below the 200 EMA and the stochastic indicator is overbought (over 80), you can get a sell signal when it the blue line crosses down below 80. This sell signal shows that you are in a down trend and the price just was overbought but is now likely to continue pushing downwards. The opposite works for buy signals: Above 200 EMA, stochastic goes below 20, when it crosses above 20 it will show a green highlight to indicate price is likely to push upwards.
I think the default options are likely the best to use. The only one I tend to change on occasion is the "Pivots to look back" which I adjust usually to either 1 or 3.
Stochastic GuppyDerived from TradingView's built-in Stochastic indicator. Switched from SMA to EMA and applied Guppy (GMMA) indicator short and long term periods.

KDJ [JoseMetal]============
ENGLISH
============
- Description:
This indicator is a modification of the common KDJ, as you may know the KDJ is just a Stochastic (K+D) with an extra line which is J, the J line can be used as "movement strength" filter and also for overbought and oversold conditions anticipating the K and D.
In this particular modification I've tested many different settings to find the best possible ones, it also has customizable MA type for the calculation and a histogram calculated with the difference between J and D, this is useful to spot divergences and determine trend strength easily, the histogram has a smooth option to make it even more clearer.
- Visual:
So you have K and D from the Stochastic (green and red lines) as well as the J line (white).
Then you have the histogram to show the difference between J and D, the histogram has a similar color scale as a MACD to determine the strength of the trend easily, lighter = stronger, darker = weaker, there are 2 default customizable color setups by the way.
Crossovers between lines (which generates LONG and SHORT entries) are presented with a DOT (green for long and red for short).
Background color also changes, green for bullish, red for bearish, crossovers also marks the background color even more.
- Customization:
As usual in my indicators, everything is customizable, you can pick yours, settings, colors, figures etc.
- Usage and recommendations:
I've tested many different setting setups, for now, the best are the default (14, 21, 21) for the KDJ and (7) for the histogram smooth, 20 and 80 for oversold and overbought levels.
Histogram is great to spot divergences, I recommend to wait for a divergence on a 4H timeframe and wait for the LONG or SHORT signal to appear to enter a trade in the divergence direction.
Enjoy!
============
ESPAÑOL
============
- Descripción:
Éste indicador es una modificación del KDJ común, como sabrás el KDJ es solo un estocástico (K+D) con una línea extra que es la J, la línea J puede ser usada como filtro de "fuerza de movimiento" y también para condiciones de sobrecompra y sobreventa anticipando la K y la D.
En esta modificación en particular he probado muchas configuraciones diferentes para encontrar las mejores posibles, también tiene un tipo de MA personalizable para el cálculo y un histograma calculado con la diferencia entre J y D, esto es útil para detectar divergencias y determinar la fuerza de la tendencia fácilmente, el histograma tiene una opción suave para hacerlo aún más claro.
- Visual:
Por lo tanto, tenemos por un lado la K y D del estocástico (líneas verde y roja), así como la línea J (blanco).
Luego tenemos el histograma para mostrar la diferencia entre J y D, el histograma tiene una escala de colores similar a la del MACD para determinar la fuerza de la tendencia fácilmente, más claro = más fuerte, más oscuro = más débil, hay 2 escalas de color personalizables por defecto.
Los cruces entre líneas (que generan entradas LARGAS y CORTAS) se presentan con un PUNTO (verde para LARGO y rojo para CORTO).
El color de fondo también cambia, verde para alcista, rojo para bajista, los cruces también resaltan el color de fondo aún más.
- Personalización:
Como es habitual en mis indicadores, todo es personalizable, puedes elegir los tuyos, ajustes, colores, figuras, etc.
- Uso y recomendaciones:
He probado muchas configuraciones diferentes, por ahora, las mejores son las predeterminadas (14, 21, 21) para el KDJ y (7) para el histograma suave, 20 y 80 para los niveles de sobreventa y sobrecompra.
El histograma es excelente para detectar divergencias, recomiendo esperar una divergencia en un marco de tiempo de 4H y esperar a que aparezca la señal de LARGO o CORTO para entrar en una operación en la dirección de la divergencia.
¡Que lo disfrutéis!

Rsi/W%R/Stoch/Mfi: HTF overlay mini-plotsOverlay mini-plots for various indicators. Shows current timeframe; and option to plot 2x higher timeframes (i.e. 15min and 60min on the 5min chart above).
The idea is to de-clutter chart when you just want real-time snippets for an indicator.
Useful for gauging overbought/oversold, across timeframes, at a glance.
~~Indicators~~
~RSI: Relative strength index
~W%R: Williams percent range
~Stochastic
~MFI: Money flow index
~~Inputs~~
~indicator length (NB default is set to 12, NOT the standard 14)
~choose 2x HTFs, show/hide HTF plots
~choose number of bars to show (current timeframe only; HTF plots show only 6 bars)
~horizontal position: offset (bars); shift plots right or left. Can be negative
~vertical position: top/middle/bottom
~other formatting options (color, line thickness, show/hide labels, 70/30 lines, 80/20 lines)
~~tips~~
~should be relatively easy to add further indicators, so long as they are 0-100 based; by editing lines 9 and 11
~change the vertical compression of the plots by playing around with the numbers (+100, -400, etc) in lines 24 and 25

MACD + RSI with Trade SignalsThis indicator by default comes with the MACD shown but can be switched to show the RSI instead. Settings for each indicator can also be customized as well as Buy/Sell signals given based on pull back crossovers that follow the 200 EMA of the price Chart. There's an above/below middle fill option you can use but I tend not to but I know some traders like to see when an oscillator is above/below the middle and use it as a trend diretion. By the way, the fourth setting for the MACD (which is 2 by default) is the size of the histogram.
Buy Signal = Price is above the 200 EMA. Current or previous MACD or RSI line is/was below middle line and now crossed above the signal line.
Sell Signal = Price is below the 200 EMA. Current or previous MACD or RSI line is/was above middle line and now crossed below the signal line.
There are alerts for each signal as well (MACD and RSI, both buy and sell).
Feel free to leave a comment regarding issues or suggestions for this indicator or ideas for the next one I should do :)

Dynamic Zones of On Chart Stochastic [Loxx]Dynamic Zones of On Chart Stochastic is a Stochastic indicator that sits on top of the chart instead of below as an oscillator. Dynamic zone levels are included to find breakouts/breakdowns and reversals.
What is the Stochastic Oscillator?
A stochastic oscillator is a momentum indicator comparing a particular closing price of a security to a range of its prices over a certain period of time. The sensitivity of the oscillator to market movements is reducible by adjusting that time period or by taking a moving average of the result. It is used to generate overbought and oversold trading signals, utilizing a 0–100 bounded range of values.
What are Dynamic Zones?
As explained in "Stocks & Commodities V15:7 (306-310): Dynamic Zones by Leo Zamansky, Ph .D., and David Stendahl"
Most indicators use a fixed zone for buy and sell signals. Here’ s a concept based on zones that are responsive to past levels of the indicator.
One approach to active investing employs the use of oscillators to exploit tradable market trends. This investing style follows a very simple form of logic: Enter the market only when an oscillator has moved far above or below traditional trading lev- els. However, these oscillator- driven systems lack the ability to evolve with the market because they use fixed buy and sell zones. Traders typically use one set of buy and sell zones for a bull market and substantially different zones for a bear market. And therein lies the problem.
Once traders begin introducing their market opinions into trading equations, by changing the zones, they negate the system’s mechanical nature. The objective is to have a system automatically define its own buy and sell zones and thereby profitably trade in any market — bull or bear. Dynamic zones offer a solution to the problem of fixed buy and sell zones for any oscillator-driven system.
An indicator’s extreme levels can be quantified using statistical methods. These extreme levels are calculated for a certain period and serve as the buy and sell zones for a trading system. The repetition of this statistical process for every value of the indicator creates values that become the dynamic zones. The zones are calculated in such a way that the probability of the indicator value rising above, or falling below, the dynamic zones is equal to a given probability input set by the trader.
To better understand dynamic zones, let's first describe them mathematically and then explain their use. The dynamic zones definition:
Find V such that:
For dynamic zone buy: P{X <= V}=P1
For dynamic zone sell: P{X >= V}=P2
where P1 and P2 are the probabilities set by the trader, X is the value of the indicator for the selected period and V represents the value of the dynamic zone.
The probability input P1 and P2 can be adjusted by the trader to encompass as much or as little data as the trader would like. The smaller the probability, the fewer data values above and below the dynamic zones. This translates into a wider range between the buy and sell zones. If a 10% probability is used for P1 and P2, only those data values that make up the top 10% and bottom 10% for an indicator are used in the construction of the zones. Of the values, 80% will fall between the two extreme levels. Because dynamic zone levels are penetrated so infrequently, when this happens, traders know that the market has truly moved into overbought or oversold territory.
Calculating the Dynamic Zones
The algorithm for the dynamic zones is a series of steps. First, decide the value of the lookback period t. Next, decide the value of the probability Pbuy for buy zone and value of the probability Psell for the sell zone.
For i=1, to the last lookback period, build the distribution f(x) of the price during the lookback period i. Then find the value Vi1 such that the probability of the price less than or equal to Vi1 during the lookback period i is equal to Pbuy. Find the value Vi2 such that the probability of the price greater or equal to Vi2 during the lookback period i is equal to Psell. The sequence of Vi1 for all periods gives the buy zone. The sequence of Vi2 for all periods gives the sell zone.
In the algorithm description, we have: Build the distribution f(x) of the price during the lookback period i. The distribution here is empirical namely, how many times a given value of x appeared during the lookback period. The problem is to find such x that the probability of a price being greater or equal to x will be equal to a probability selected by the user. Probability is the area under the distribution curve. The task is to find such value of x that the area under the distribution curve to the right of x will be equal to the probability selected by the user. That x is the dynamic zone.
Included
Bar coloring
Signals
Alerts
4 types of signal smoothing

DMI Stochastic Extreme Refurbished█ CONCEPTS
DMI Stochastic Extreme was originally published by Barbara Star, PhD, in TASC magazine of January 2013.
Basically it describes an improved version of the ADX DI+/DI- indicator, created by J. Welles Wilder.
In the setup described by the author, the DMI Oscillator is used together with a stochastic oscillator of DMI.
First, the DMI Oscillator is obtained by subtracting the minus directional movement indicator value (DI-) from the plus directional movement value (DI+).
The final result is the "DMI Stochastic Extreme" indicator, in which the stochastic oscillator is calculated. Only instead of using the price value, the stochastic is obtained through the DMI value.
█ Goals
The final indicator described by Barbara is the Stochastic Oscillator of DMI.
However, to use the DMI oscillator together (as described in the magazine), it is necessary to plot it in a separate indicator, which consumes screen space.
That's why the idea of joining both the DMI oscillator and the DMI Stochastic Oscillator into one thing came up, optimizing the visualization.
Taking advantage of the fact that my hands are already dirty :), I created some fine adjustments.
█ HOW TO USE IT
Here are some examples:
1. With default params:
2. With custom DI Length of 21 (Histogram), DI Length of 13 (for Stoch Oscilator), Stoch Length of 5, and another theme.
3. Another params with less noise:
█ THANKS AND CREDITS
- Barbara Star (original creator)
- ucsgears (arrow logic)

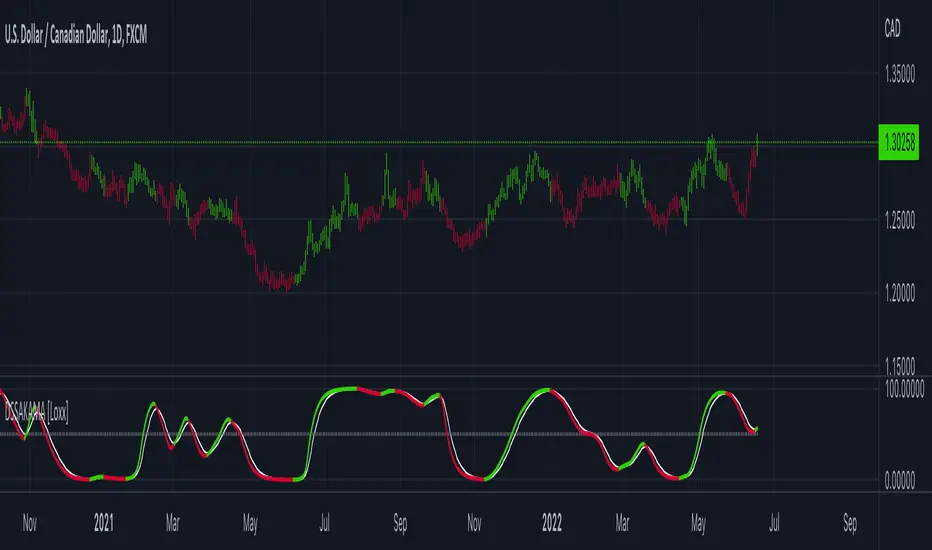
DSS of Advanced Kaufman AMA [Loxx]DSS of Advanced Kaufman AMA is a double smoothed stochastic oscillator using a Kaufman adaptive moving average with the option of using the Jurik Fractal Dimension Adaptive calculation. This helps smooth the stochastic oscillator thereby making it easier to identify reversals and trends.
What is the double smoothed stochastic?
The Double Smoothed Stochastic indicator was created by William Blau. It applies Exponential Moving Averages (EMAs) of two different periods to a standard Stochastic %K. The components that construct the Stochastic Oscillator are first smoothed with the two EMAs. Then, the smoothed components are plugged into the standard Stochastic formula to calculate the indicator.
What is KAMA?
Developed by Perry Kaufman, Kaufman's Adaptive Moving Average (KAMA) is a moving average designed to account for market noise or volatility . KAMA will closely follow prices when the price swings are relatively small and the noise is low. KAMA will adjust when the price swings widen and follow prices from a greater distance. This trend-following indicator can be used to identify the overall trend, time turning points and filter price movements.
What is the efficiency ratio?
In statistical terms, the Efficiency Ratio tells us the fractal efficiency of price changes. ER fluctuates between 1 and 0, but these extremes are the exception, not the norm. ER would be 1 if prices moved up 10 consecutive periods or down 10 consecutive periods. ER would be zero if price is unchanged over the 10 periods.
What is Jurik Fractal Dimension?
There is a weak and a strong way to measure the random quality of a time series.
The weak way is to use the random walk index ( RWI ). You can download it from the Omega web site. It makes the assumption that the market is moving randomly with an average distance D per move and proposes an amount the market should have changed over N bars of time. If the market has traveled less, then the action is considered random, otherwise it's considered trending.
The problem with this method is that taking the average distance is valid for a Normal (Gaussian) distribution of price activity. However, price action is rarely Normal, with large price jumps occuring much more frequently than a Normal distribution would expect. Consequently, big jumps throw the RWI way off, producing invalid results.
The strong way is to not make any assumption regarding the distribution of price changes and, instead, measure the fractal dimension of the time series. Fractal Dimension requires a lot of data to be accurate. If you are trading 30 minute bars, use a multi-chart where this indicator is running on 5 minute bars and you are trading on 30 minute bars.
Included
-Toggle bar colors on/offf
EMCHO Stochastic RangeCustom Stochastic Oscillator with range plot. Can be used to better identify overbought/oversold conditions within a single bar. In addition to the default Stochastic:
%K line smoothing algorithm selection;
%D line smoothing algorithm selection;
%K line high/low plotting;
%K line high/low calculation factor (in bars, default 1).

Stoch RSI, Div, Zone S3 by Gammaprod>> How to use this indicator :
1. Set your teadingview theme to dark theme.
2. My indicator is valid for forex, stock and but more valid for crypto.
3. Use three timeframe for more validation (choose between those, that fit to your trading style) :
- Timeframe 1m, 5m, and 15m for Scalping
- Timeframe 30m, 1h and 4h for Intraday
- Timeframe 4h, 1D and 1W for Swing Trading
4 . Always use THREE INDICATORS FROM GAMMAPROD, those three indicators is back to back each other, by the way, I only made those three indicators only (for now) :
- Trendlines Boll Ichi Crypto by Gammaprod
- Stoch RSI Divs Zone Crypto by Gammaprod
- MACD Volume Crypto by Gammaprod
>> How to setting :
1. Trendlines Boll Ichi Crypto by Gammaprod
A. Support and Resistence
- Well if you familiar with this indicator you can add it, but recommended for Timeframe 30m or more
B. Trendlines Primary or Trendlines Secondary
- Timeframe 1m you DON'T NEED Trendlines Primary or Trendlines Secondary
- Timeframe 5m you DON'T NEED Trendlines Secondary, but you CAN ADD Trendlines Primary if you fell it helpful (for me, it is helpful to find where the candles start or the end trend or a consolidation or where the candles will surpass a resistance or a support).
- Timeframe 15m you DON'T NEED Trendlines Secondary, DEFENITELY add Trendlines Primary it will help to find where the candles stop or a consolidation or where the candles will surpass a resistance or a support).
- Timeframe 30m or more, DEFENITELY NEED BOTH Trendlines Primary and Secondary Trendlines, it will help to find where the candle stop or consolidation or where the candle will surpass a resistance or support).
C. Bolinger, Ichimoku Cloud and Lagging Span
- Please DON'T CHANGE IT at all, it's really helpful to know when and where to make an entry decesion or a trend or a consolidation, if you don't understand how to read it, you better to learn it first (on "how to read" section and "How to OPEN position" the section below)
2. Stoch RSI Divs Zone Crypto by Gammaprod (DON'T CHANGE IT)
3. MACD Volume Crypto by Gammaprod (DON'T CHANGE IT)
>> How to read :
1. Sell or Buy Priority :
A. Buy Priority
- Color background on macd and stoch rsi is pink or purple sell is the priority, (if you're not sure to buy, just wait until the best moment to sell)
B. Buy Priority
- Color background on macd and stoch rsi Teal or light green buy is the priority, (if you're not sure to sell, just wait until the best moment to buy)
C. Indecision / Golden Moment
- Color background on stoch rsi yellow is indecision / golden moment of reversal pattern (wait until it formed background only on Stoch RSI), please becareful at this moment.
2. Trend / Consolidation :
A. BULLISH trend
- When Stoch RSI and MACD have teal or light green background that's means BULLISH trend, better to confirm by the candle is above green cloud and lagging span (red line) is also above the candle.
B. BEARISH trend
- When Stoch RSI and MACD have the Pink or purple background that's means BEARISH trend, better to confirm by the candle is above purple cloud and lagging span (red line) is also below the candle.
C. CONSOLIDATION
- When Stoch RSI have the mix background that's means CONSOLIDATION, better to confirm by the candle is in or near to green / purple cloud and lagging span (red line) is also on the candle.
3. Special Mark
A. Ideal Bullish :
- Near line 20 and green / teal background = When Stoch RSI have the char R / H on lime color label, that's means divergence or hidden divergence for buy position, if you not see this label that's means just a standard confirmation for buy
B. Not an Ideal Bullish :
- Near line 80 and green / teal background = if this happens make sure you know what happen, it could be a false signal or bullish continual pattern
C. Ideal Bearish :
- Near line 80 and pink / purple background = When Stoch RSI have the char R / H on lime color label, that's means divergence or hidden divergence for buy position, if you not see this label that's means just a standard confirmation for sell position.
D. Not an Ideal Bearish:
- Near line 20 and pink / purple background = if this happens make sure you know what happen, it could be a false signal or bearish continual pattern
E. The Beginning of Reversal (from BEARISH to BULLISH) :
- When Stoch RSI line shaping GREEN position is near 20.
- MACD lines still PINK, position lines is UNDER the HISTOGRAM, but the HISTOGRAM start to SHAPE FALL PINK (light pink) and the BACKGROUND still PINK / PURPLE.
- Position CANDLES NEAR BLUE line, NEAR PURPLE CLOUD, and lagging span (red line) STILL ON the area candle. (it used to be confirmed with the golden moment).
F. The Beginning of Reversal (from BULLISH to BEARISH) :
- When Stoch RSI line shaping PINK position is near 80.
- MACD lines still GREEN, position lines is ABOVE the HISTOGRAM, but the HISTOGRAM start to SHAPE FALL GREEN (light green) and the BACKGROUND still TEAL / GREEN.
- Position CANDLES NEAR WHITE line, NEAR TEAL CLOUD, and lagging span (red line) STILL ON the area candle. (it used to be confirmed with the golden moment).
G. False Signals, or It could be a Golden Moment (better to see it on TF 15 or bigger):
- Near line 20 or 80 and yellow background = When Stoch RSI have the char R / H on color label, that's means divergence or hidden divergence for buy / sell position, if you not see this label that's means just a standard confirmation for buy / sell depends on where the Stoch RSI line if near 20 that's means buy, near 80 means sell
>> How to OPEN position:
A. Bullish
1. Trendlines Boll Ichi Crypto by Gammaprod
- The candles above the green cloud.
- Lagging span (red line) above the candles.
- then open buy near yellow line (the first option) / blue line (the second option) (always confirm the position with two other indicators below).
2. Stoch RSI Divs Zone Crypto by Gammaprod
- Teal or Green background.
- The lines is shaping green.
- Better if on the bottom (at a range 20).
3. MACD Volume Crypto by Gammaprod
- Teal or Green background.
- The lines is shaped or shaping green.
- Better if at the green histogram.
B. Bearish
1. Trendlines Boll Ichi Crypto by Gammaprod
- The candles below the purple cloud.
- Lagging span (red line) below the candles.
- then open buy near yellow line (the first option) / white line (the second option) (always confirm the position with two other indicators below).
2. Stoch RSI Divs Zone Crypto by Gammaprod
- Pink or purple background.
- The lines are shaping pink.
- Better if the line on the top (at a range 80).
3. MACD Volume Crypto by Gammaprod
- Pink or purple background.
- The lines are shaped or shaping green.
- Better if at the pink histogram.
C. Consolidation
1. Trendlines Boll Ichi Crypto by Gammaprod
- The candles on the cloud (green or purple).
- Lagging span (red line) on the candles.
- then open buy near the white or blue line (always confirm the position with two other indicators below).
2. Stoch RSI Divs Zone Crypto by Gammaprod
- Mix background specially on a timeframe 15m or more.
- The line move fast up and down.
- Better if on the bottom or the top of the lines (at a range 20 or 80).
3. MACD Volume Crypto by Gammaprod
- Changing the background.
- The line is near the middle line.
- Have small Histogram.
>> The secret ingridient is comparing the timeframe :
The example scalping (Timeframe 1m, 5m and 15m)
- TF 1m is for making an open position.
- TF 5m is for making a judgement of the trend market.
- TF 15m is to confirm that judgement from TF 5m, be careful if it not similar then it used to be a consolidation or the beginning of the reversal.
There's a lot a way to open the position than above information that i gave it to you, but consider there are a limit char on this column, I hope it will help your trading and make a more profit on it.

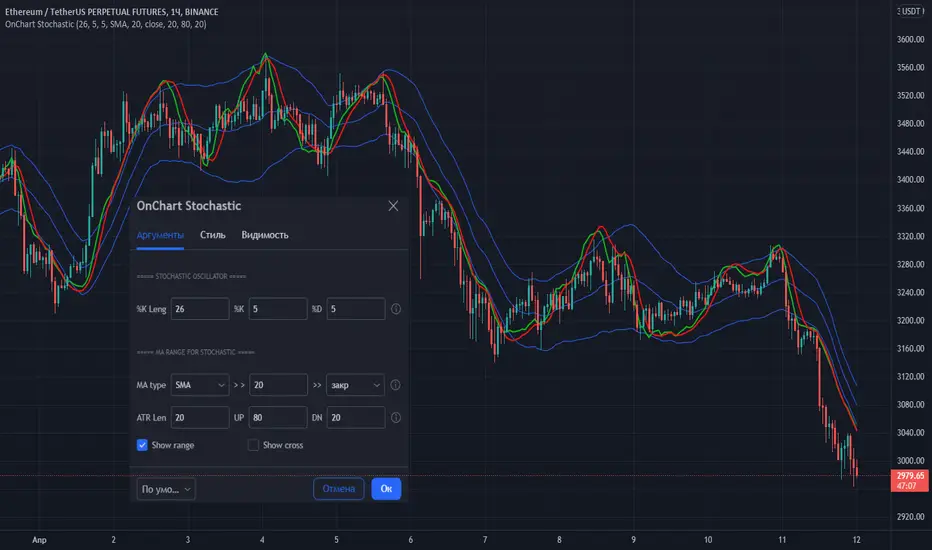
OnChart Stochastic💡 Stochastic oscillator superimposed on the chart!
👉 This is a very convenient visualization for trading in any market and TF!
Stochastic settings are standard.
The exit of the Stochastic lines above the upper border (High band) indicates that the price has entered the overbought zone (here you should look for a sale), the exit below the lower border (Low band) indicates the entry into the oversold zone (here you should look for purchases). The intersection of the "stochastic" lines indicates a probable reversal of the direction of price movement.
The indicator also has a range setting, in which the "stochastic" moves with reference to the MA. For MA, you can select the type, period and data type.
The values are adapted based on the daily values of the previous bar and adjusted by the period (ATR Len) for smoothing.
The values of the upper and lower bounds for the "stochastic" are also set.
It is possible to show on the chart the points of intersection in the oversold/overbought zones (show cross).
👉 I wish everyone profit and be sure to follow the risk management in trading!
You can set alerts for "stochastic" line crossings in oversold/overbought zones (use UP cross/DN crross "Once per bar close").
If you have any questions, you can write to me in private messages or by using the contacts in my signature.
----------------------------------------------------
💡 Стохастический осциллятор наложенный на график!
👉 Это очень удобная визуализация для торговли на любом рынке и ТФ!
Параметры настройки "стохастика" - стандартные.
Выход линий "стохастика" выше верхней границы (High band) говорит о входе цены в зону перекупленности (здесь следует искать продажу), выход ниже нижней границы (Low band) говорит о входе в зону перепроданности (здесь следует искать покупки). Пересечение линий "стохастика" говорит о вероятном развороте направления движения цены.
В индикаторе также есть настройка рейнджа, в котором двигается "стохастик" с привязкой к МА. Для МА можно выбрать вид, период и тип данных.
Адаптация значений выполнена на базе дневных значений предыдущего бара и регулируется периодом (ATR Len) для сглаживания.
Также задаются значения верхней и нижней границы для "стохастика".
Есть возможность показать на графике точки пересечения в зонах перепроданности/перекупленности (show cross).
Вы можете установить оповещения для пересечения линий "стохастика" в зонах перепроданности/перекупленности (используйте UP cross/DN crross "на закрытии бара").
👉 Желаю всем профита и обязательно соблюдайте риск-менеджмент в торговле!
По любым вопросам Вы можете написать мне в личные сообщения или по контактам в моей подписи.
Vol Buy/Sell %s, CMF, and Stocahstic Osc & UOPlots % Buy / Sell Volume , Chaikin Money Flow , Stochastic Oscillator, and Ultimate Oscillator on same axis, bound -1 to 1.
Show Volume Percentage, displaying buying as green and positive, selling as red and negative.
Showing the CMF, with green / red fill for positive / negative values.
Modified Stochastic Oscillator, converting bounds to -1 and 1, moving overbought/sold to -0.6 and 0.6, accordingly. Green fill (buy signal) with %D below -0.6 and %K lower than %D. Red fill (sell signal) with %D above 0.6 and %K higher than %D. Fill is between %D and bound, to be more visible.
Modified Ultimate Oscillator, converting bounds to -1 and 1, moving overbought/sold to -0.6 and 0.6, accordingly.

Stochastic with Lines - ChartWhat is Stochastic with Lines - Chart and why do you need it?
I use it for chart analysis to identify key K/D levels from which bullish / bearish market structure continues to develop.
Chart means that every K/D cross above/below the signal lines will be notified on your Chart and not on the stocahstic oscillator. To see them on your chart please choose "Stochastic with Lines - Default" in my library.
Once K or the D line cross over or under your upper or lower signal line you will see background colors which you can adjust in the settings menu.
This small indicator is for a larger project which will be uploaded in several days/weeks.

(JS) Double StochasticThe idea for this indicator came from looking at the Stochastic RSI. The Stochastic RSI takes the RSI reading then applies the Stochastic formula to it - an indicator on top of an indicator. Using this logic, I decided to try using a Stochastic on the existing Stochastic in order to smooth it out - hence the "Double Stochastic". I have also added the option to add RSI on to the indicator as well (with smoothing if you'd like).
Resolution:
I added this so you can look at the reading on any time frame.
K & D:
This is the standard K% and D% used with the Stochastic indicator - the numbers modify the length of their calculations.
Smooth:
This is the smoothing calculation, also from the normal Stochastic indicator.
Use Second Stochastic:
This adds a second Stochastic on to the chart for analysis.
K & D 2:
This is the parameters used to calculate the second K% and D% lines.
Smooth 2:
This is the smoothing interval for the second K% and D% lines.
Use K% and D%:
The default for this is to have it on. What it means is that you wish to see both the K% and D% lines (watching for a cross). If you turn this off, the plot switches to a K% & D% difference line. It is just one line that plots the distance between the two.
SMA Length Using Difference:
If this is on, then you can smooth the difference plot with an SMA, obviously if you just want the raw difference to plot, then set this to 1.
Use RSI:
Since both RSI and Stochastic use a 0-100 scale, I added the ability to plot the RSI along with the Stochastic. This will not plot if you are using the Difference plot, being that plot isn't on a 0-100 scale.
Smooth RSI:
I also added the ability to smooth the RSI if you'd like, you can turn this off for the standard RSI reading.
RSI Length:
This is the period of bars used to calculate the RSI.
RSI Smoothing Length:
This is the smoothing interval if you'd like to apply a moving average on the regular RSI reading.
RSI Smoothing Use EMA:
This makes the RSI smoothing use an EMA, when off an SMA is used instead.
RSI Source:
And finally, this is the source used to calculate the RSI value.
I hope that you all may find this useful, I have been using it myself with a lot of success. Any questions, please leave them in the comments, thanks!

Stochastic CandlesA series of up to 28 stochastics oscillators used to form an average stochastic value, which is then used to colour the candles based on the momentum.
Each candle can be coloured one of ten colours and each one represents a position on the stochastic oscillator.
The indicator helps traders to visualise the momentum and helps trend following.
Inputs:
MA: multiple smoothing methods
Theme: multiple colours
Increment: stochastic length start and increments
End: stochastic length end
Smooth: smooth stochastic
Lane's Stochastics (yasujiy)This script is original Lane's Stochastics.
Default script uses SMA for %D, but this %D is calculated separately numerator and denominator.

Function : Stochastic Oscillator Here is the Stochastic Oscillator function.
Now you can easily use length with mutable variables !!
