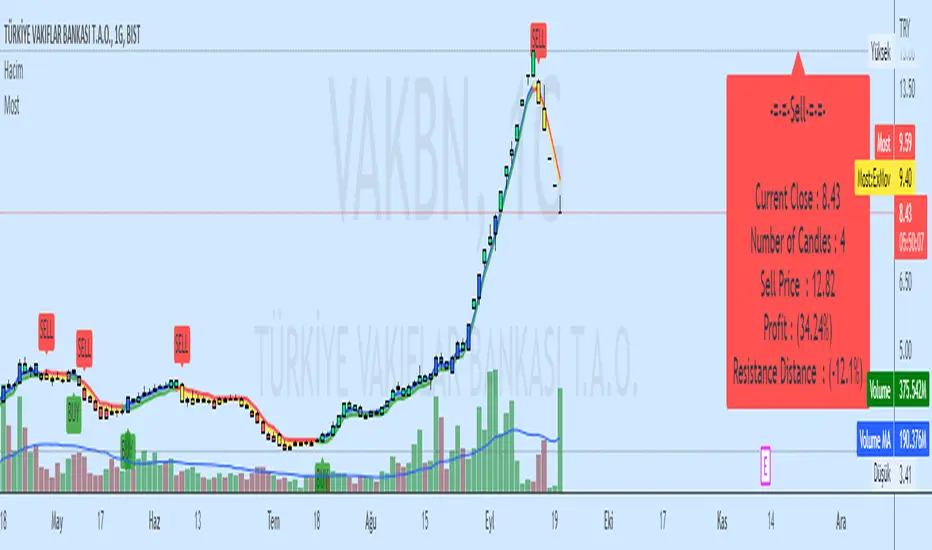
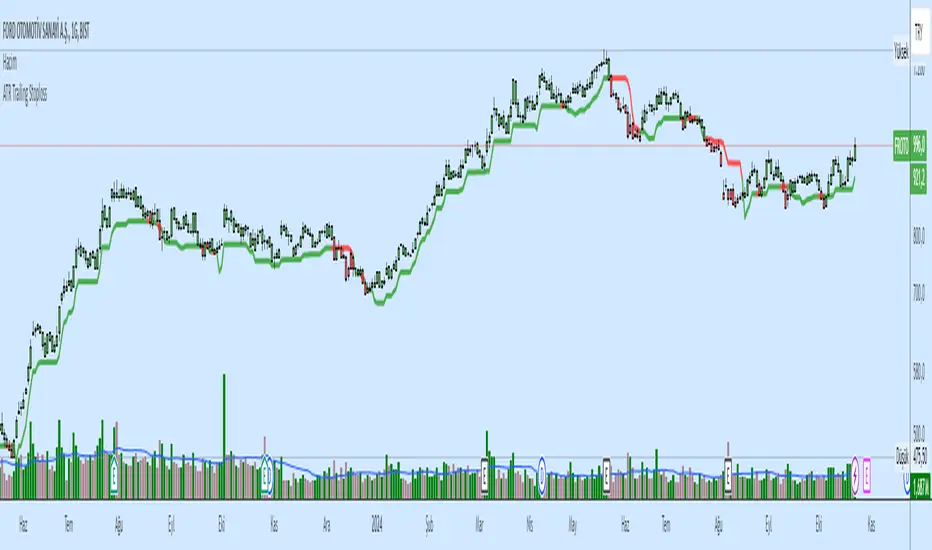
Moving Stop Loss (Most) by ceyhunATR is an indicator that has been removed and replaced with a moving average.Bar colors and infopanel have been added.
//Barcolor
Green = ExMov > Most and close > Most and low > Most
Blue = ExMov > Most and close > Most and low < Most
Red = Most > ExMov and close < Most and high < Most
Yellow = Most > ExMov and close < Most and high > Most
//It gives White color where there is deterioration.
//InfoPanel
Buy Price = Blue draws the circles at the purchase price.
Profit Long>20 = Risk level taken as a percentage, I got the highest 20%, you can determine as you wish.
Sell Price = Red draws the circles at the purchase price.
Profit Short>20 = Risk level taken as a percentage, I got the highest 20%, you can determine as you wish.
==Atr Original Code==
CDC ATR Trailing Stop V2.1 (2013)
==Most Code==
MOST by Anıl ÖZEKŞİ
Barcolor
Barcolor
Stoploss
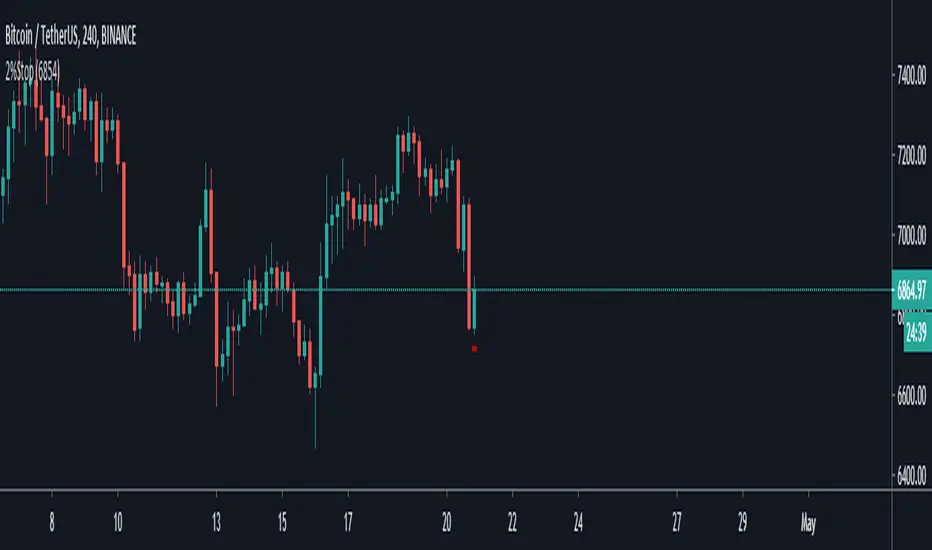
2% StopThis indicator is simply based on the 2% rule, you must insert the entry point (the price at what you bought) by clicking the gear on the top left.
If you see the chart different is becouse the default entry is set to 1 and but it fixes if you set the proper entry price.
a little bit about the 2% rule :
Following the 2% Rule will keep any loss in your account to a rela-
tively small, livable size.
The 2% Rule prohibits you from risking more than 2% of your account
equity on any single trade.
This Rule does
not limit your position size—it only limits your risk.
Of course, if you are planning to hold your position down to zero,
then its maximum size would have to be capped at 2%. On the
other hand, if you do a much more sensible thing and use a stop, your
risk per share will decrease, and your permitted size will increase.
The distance from your entry price to the stop level defines your
maximum dollar risk per coin.
The 2% Rule defines your maximum risk for the entire position.
Knowing the risk per share and the total permitted risk makes it
easy to calculate the maximum number of coins /shares you may trade.
Credit about this idea goes to Dr Elder Alexander.
High/Low stopFirst of all let me quote some important points :
• You need stops; a trade without a stop is a gamble.
• You need to know where you’ll put your stop before you enter
a trade.
• Everybody needs hard stops.
• Whenever you change a stop, you may move it only in the direc-
tion of the trade.
There is a variety of techniques available to traders who like to use
trailing stops:
• You can use a multibar low as a trailing stop; for example, you
can keep moving your stop to the lowest low of the last three
bars (but never against your trade).
• You can trail prices with a very short moving average and use its
level for a trailing stop.
• You can use a Chandelier stop—every time the market makes a
new high, move the stop within a certain distance from the top—
either a specific price range or a number based on an ATR (aver-
age true range). Any time your stock makes a new high, you place
your stop within that distance from the top, like hanging a chan-
delier (this method is described in Come into My Trading Room).
• You can use a Parabolic stop .
• You can use a SafeZone stop .
• You can use a Volatility-Drop stop (described below, for the first
time in trading literature).
• You can use a Time Stop to get out of your trade if it does not
move within a certain time. For example, if you enter a day-trade
and the stock does not move within 10 or 15 minutes, it is clearly
not doing what you expected and it is best to scratch that trade.
If you put on a swing trade which you expect to last several
days, but then a week goes by and the stock is still flat, it is
clearly not confirming your analysis and the safest action would
be to get out.
This is a summary taken from Dr Elder book and this indicator i coded from one of his book where he briefly mention this trailing stop technique but don't dive a lot into it, but still i found to be very effective.
You can use even the short stop (the green dots) as an entry point.

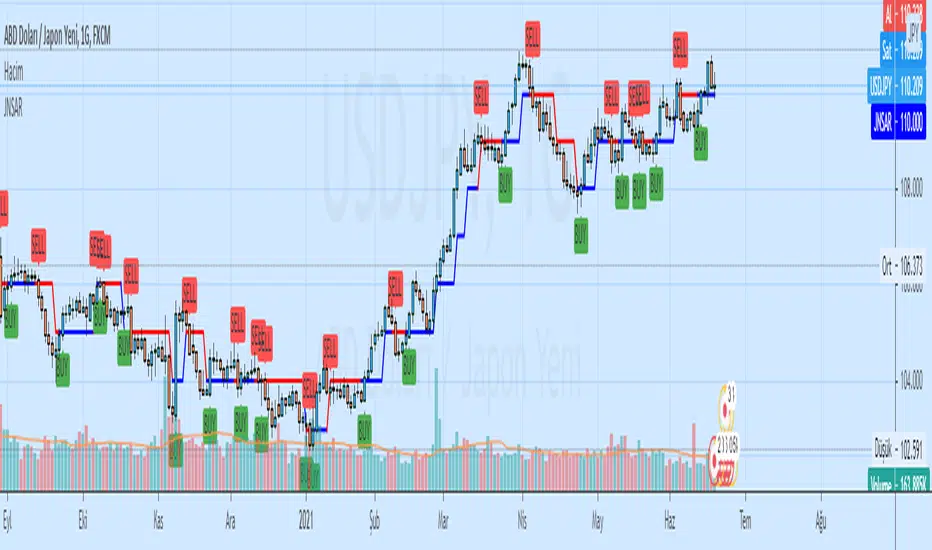
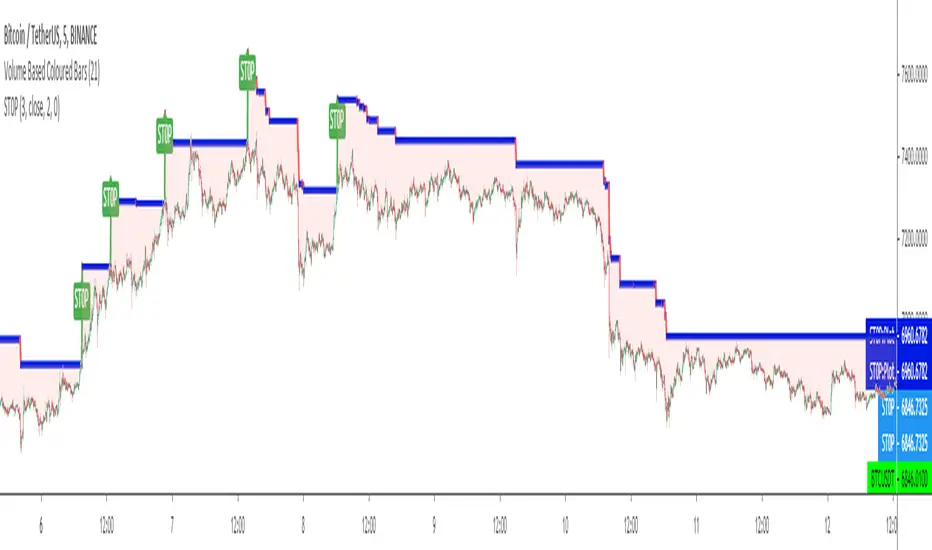
ST0PST0P is a kind of a TRAILING STOP LOSS INDICATOR in which users can set up LONG or SHORT trade versions and also can set up a STOP LOSS level by percent % or unit difference.
It tries to solve the problem of stop loss indicators' default BUY or SELL settings and non adjustable stop levels of % and difference change in price levels.
(Will try to make updates to add user defined start bars.)
Kıvanç Özbilgiç
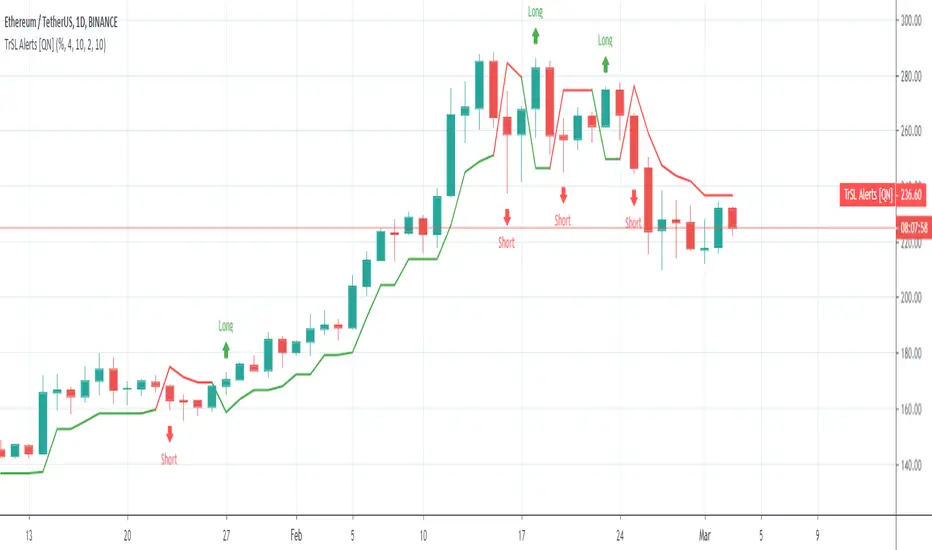
Trailing SL Alerts [QuantNomad]It's alerts version of my Trailing SL strategy:
Use "Once Per Bar" param when creating alerts.
Profit and Stoploss CalculatorThis script is designed to display three stop loss areas to assist either with automation of risk management or identify and alert when price is in a range of a trade for risk to reward ratio.
In this version there are three stop losses and 1 PT. Mainly because i will most likely only be using 1 of the SL to pair with the PT.
Stoploss areas are displayed on both sides of the price for long and short calculations along with the two profit factors but the settings in the indicator it self apply to both sides in terms of percentage.

ATR based Stop and Take-Profit levels in realtime Little tool to quickly identify stops and take-profit levels based on Average True Range. User can change ATR multipiers, as well as the ATR length used. Green and red lines show these levels; plot is visible over last 8 bars only to reduce clutter. Label showing the current ATR, up above the last bar

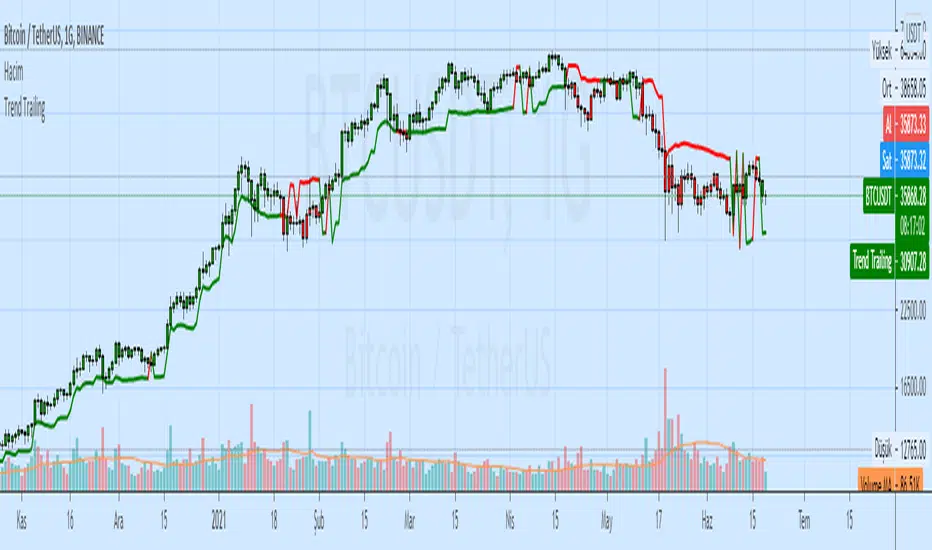
Trend TrailingAndrew Abraham
It can be used as:
- stop loss indicator
- indicator of support and resistance
- buy and sell signals
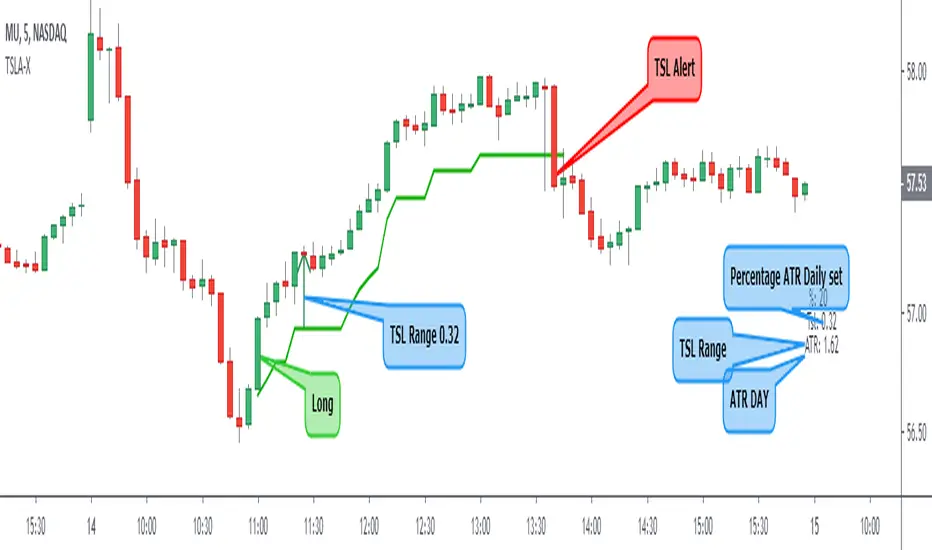
Trailing Stop Loss ATR + AlertI share this TSL indicator with alert (I use it only for Stocks), the configuration is very simple, you must select if it is a Short or Long operation, time at which the operation was opened,% of the daily ATR for TSL. It also contains:
- Alert
- Panel Info
Calculator (weighted) - evoA tool to calculate the average price and position size.
The "Risk Amount" input means the amount of dollars you lose if the trade gets stopped out (it should be based on a small percentage of your account).
TIPS
- If you use the weights to calculate an average price, make sure it adds up to 100% in total or you will get a weird number.
- Keep an eye on the risk amount if you take a trade, if I ever update the script it might set back to default which will change your position size.
- I tested it all but you might trade in a different way than me, so do your own calculation for every new thing you try with it.
If you find any bug please tell me so that no one ends up with a weird calculation or position size.

Maximum True RamgePlots the the highest true range for the entire dataset.
Beneficial for determine an emergency stopp loss.

Guppy CBLThis is the Count Back Line script from the book Guppy Trading by Daryl Guppy.
It is usually used as a stop loss line, but can also be used to find entries.
Hope someone finds it usefull, if you find anything that is wrong with it, please let me know and I will try to fix it.
This is my first PineScript, hope it is working as intended.

Market Adaptive Stop-LossI realized that the zone changes in the stoploss remained slow, so I couldn't make enough use of the characteristics of technical indicators when opening positions.
This pushed me to keep stop-loss under the influence of a dependent variable.
This script helped me a lot (everget) :
I've redesigned the stop-loss to be affected by intersections.
Therefore, this script is also suitable for adaptive moving averages, fractional periods.
Script features:
1.You can select calculation methods created by using various technical analysis methods from the scripts' settings:
-Moving Average Convergence Divergence ( Macd )
-Stochastic Oscillator ( Stoch )
-Stochastic Relative Strength Index (StochRSI)
-Stochastic Money Flow Index (StochMFI ) (More info : )
-Know Sure Thing ( KST )
-OBV ( On Balance Volume )
-SMA ( Simple Moving Average )
-EMA ( Exponential Moving Average )
-FISHERTRANSFORM ( Fisher Transform )
-AWESOMEOSCILLATOR( Awesome Oscillator )
-PSAR ( Parabolic Stop and Reverse - Parabolic SAR )
-HULLMA( Hull Moving Average )
-VWMA ( Volume Weighted Moving Average )
-RMA (Moving Average using in Relative Strength Index calculations.)
-COG (Center of Gravity )
-ACC-DIST ( Accumulation / Distribution Index )
2 - The region is determined according to the above calculation methods and if it is larger or smaller than the previous stop loss level.
And if the price in the negative zone is lower than the stoploss, it is the exact signal and is shown with more highlighted colors.
And, in the positive zone, where the price is greater than the stoploss, the trade zones are certain.
Shown with more highlighted colors.
If the zones are correct but stop-loss is not suitable for opening positions:
In other words, if the stop-loss is above/under the highest-lowest levels in the positive zone or if the stop loss is located in the lower zone in the negative zone, these zones are shown to be darker and dimmed so that they do not cause false movements.
*** SUMMARY : As a result, you can use this script with support and resistances,and trend lines to get good results.
I hope it helps in your analyzes. Best regards.

Experimental Entry Interface (Buy Arrows with TP & SL)This script provides high probability entry points and includes Take Profit and Stop Loss targets.
It attempts to predict when the market conditions are set to move up, and prints long positions.
In addition to Long Entry Arrows, it will print Take Profit / Stop Loss targets.
This indicator is highly adjustable. Hence the name 'Experimental' in the title. Experiment with it to find the results you want.
Designed for use on the 1H timeframe in Forex, but could possibly be useful elsewhere. Do your own testing.
This indicator can repaint. It is best used with alerts set for once per bar close, so that your alerts do not repaint and your trades are solid.
Not ever signal is a winner. Backtest thoroughly. Adjust accordingly.
Arrows
Four sets of colored arrows are included.
💵 💶 Green and Blue Entry Arrows are formed when the market is in an uptrend, and has a momentary pullback.
💴 💷 Yellow and Purple Entry Arrows are formed when the market is just starting to recover from being severely oversold.
Backtest Mode
Turn on Backtest Mode to easily see if an entry ended up as a winner or loser. A Take Profit and Stop Loss line will be drawn to show results.
Take Profit & Stop Loss Targets
You have two options for this.
Price will show you where your TP/SL exits should be placed. These values will show up under the arrow, based on your Risk/Reward ratio.
Pips are much more simple, and will only show you the market entry point and how many pips up/down to place your SL/TP. Warning: This is fixed at a 1:1 RRR .
Risk/Reward Adjustment
Each entry arrow color allows custom risk/reward ratio adjustment.
Dollar Amounts Displayed
Change your account value and leverage to see how much you would have won on each trade.
How to trade with it?
(Forex, 1H) Open the settings, and turn on all the arrow entries. Turn on Backtest mode to see how past trades would have played out. Turn on TakeProfit/StopLoss Targets to see where to set your targets, for each arrow. Set an alert to notify you once per candle close when there is an Entry. Trade happy!
Bill Williams Alligators are also included, if you want. Not necessary though. Some of the calculations depend on them for trend direction analysis.

Average True Range Multiplied (Volatility Stop)Plots crosses above and below the current price giving you the ability to quickly set your stop loss (or the 1st profit target) depending on a custom variable by which the average true range is multiplied with the option to specify the length as well as the type of the moving average (RMA, SMA, EMA or WMA) that are taking into account.
Optionally, you can disable showing of the crosses on the chart and just let the indicator display the calculated value by itself.

ATR ChannelsATR Channels help you to identify where to place your stop-loss or trailing stop-loss based on price volatility, according to the Average True Range (ATR).

Two MM Cross (Signal version)Hi everyone
This is a dummy two MM cross script to be used for the Trade Manager
I'll publish a video explaining how to use the Trade Manager as I received many questions.
This was my fault for not being clear enough. A video will do great wonders here
Dave

Trade Manager (Open Source Version)Hello my young padawans looking for the FORCE to get richer on your next trade
I got pinged at least three times today asking where the hell is the indicator of the day. You asked, I delivered :)
Here's your free open-source Trade Manager Version. My associates might kill me for sharing that one... anyway this is a real GIFT.
I won't share such quality indicators too often for FREE so hope you'll appreciate its value. It can really help with your day to day trading (on top of making your charts looking more awesome)
This is an even better version compared to my previous Trade Manager Trade-Manager . It's basically a standalone version, meaning you'll have to update with 2 lines your own indicator and follow my educational post from yesterday (pasted it below also) to learn how to do it
Please read this educational post I published for you before proceeding further : How-to-connect-your-indicator-with-the-Trade-Manager
From here you normally connected the data source of your own indicator to the Trade Manager. If not, here's a reminder of the article mentionned above
Step 1 - Update your indicator
For the screenshot you see above, I used this indicator : Two-MM-Cross-MACD/ . "But sir are you really advertising your other indicators here ??" ... hmmm.... YES but I gave them for free so ... stop complaining my friend :)
Somewhere in the code you'll have a LONG and a SHORT condition. If not, please go back to study trading for noobs (I'm kidding !!!)
So it should look to something similar
nUP = ma_crossover and macd_crossover
nDN = ma_crossunder and macd_crossunder
What you will need to add at the very end of your script is a Signal plot that will be captured by the Trade Manager. This will give us :
// Signal plot to be used as external
// if crossover, sends 1, otherwise sends -1
Signal = (nUP) ? 1 : (nDN) ? -1 : na
plot(Signal, title="Signal")
The Trade Manager engines expects to receive 1 for a bullishg signal and -1 for bearish .
Step 2 - Add the Trade Manager to your chart and select the right Data Source
I feel the questions coming so I prefer to anticipate :) When you add the Trade Manager to your chart, nothing will be displayed. THIS IS NORMAL because you'll have to select the Data Source to be "Signal"
Remember our Signal variable from the Two MM Cross from before, now we'll capture it and.....drumb rolll...... that's from that moment that your life became even more AWESOME
The Engine will capture the last signal from the MM cross or any indicator actually and will update the Stop Loss, Take Profit levels based on the parameters you set on the Trade Manager
It should work with any indicator as long as you're providing a plot Signal with values 1 and -1 . In any case, you can change the Trade Manager you'll find a better logic for your trading
Now let's cover the different parameters of the tool
It should be straightforward but better to explain everything here
+Label lines : if unchecked, no SL/TPs/... will be displayed
+Show Stop Loss Signal : Will display the stop loss label. You have the choice between three options :
By default, the Stop Loss is set to NONE. You'll have to select a different option to enable the Stop Loss for real
++Percentage : Will set the SL at a percent distance from the price
++Fixed : SL fixed at a static price
++Trailing % : Trailing stop loss based on percentage level
The following is a KEY feature and I got asked for it many times those past two days. I got annoyed of getting the same request so I just did it
++Trailing TP: Will move the Stop Loss if the take profit levels are hit
Example: if TP1 is hit, SL will be moved to breakeven. If TP2 is hit, SL will be moved from TP1 to TP2
+Take Profit 1,2,3 : Visually define the three Take Profit levels. Those are percentage levels .
Meaning if you set TP1 = 2, it will set the TP1 level 2% away from the entry signal
Please note that once a Take profit level is reached, it will magically disappear. This is to be expected
I'll share in the future a way more complete version with invalidation, stop loss/take profits based on indicator, take profit based on supports/resistances, ...
I believe is such a great tool because can be connected to any indicator. I confess that I tried it only with a few... if you find any that's not working with the Trade manager, please let me know and I'll have a look
PS
I want to give a HUUUUUUUGE shoutout to the PineCoders community who helped me finishing it
Wishing you all the best and a pleasant experience with my work
David

RSI Stop LossExperiment for using RSI as a stop loss value, shows where the price will be when the RSI increases or decreases by a specified amount.

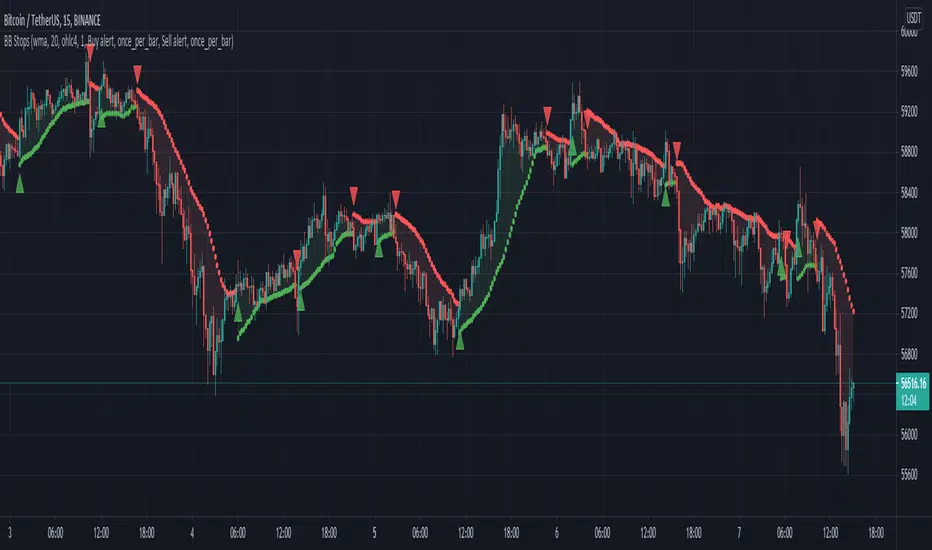
Bollinger Band stops - JDI didn't find a BB stops indicator on TV, so I wrote one myself.
You can select various ma types as a base anchor for the calculations.
This indicator can have various use cases similar to Supertrend or Parabolic SAR: as a trend indicator, as a training stop loss,...
JD.