Beakdoo swing trading boxHi forks,
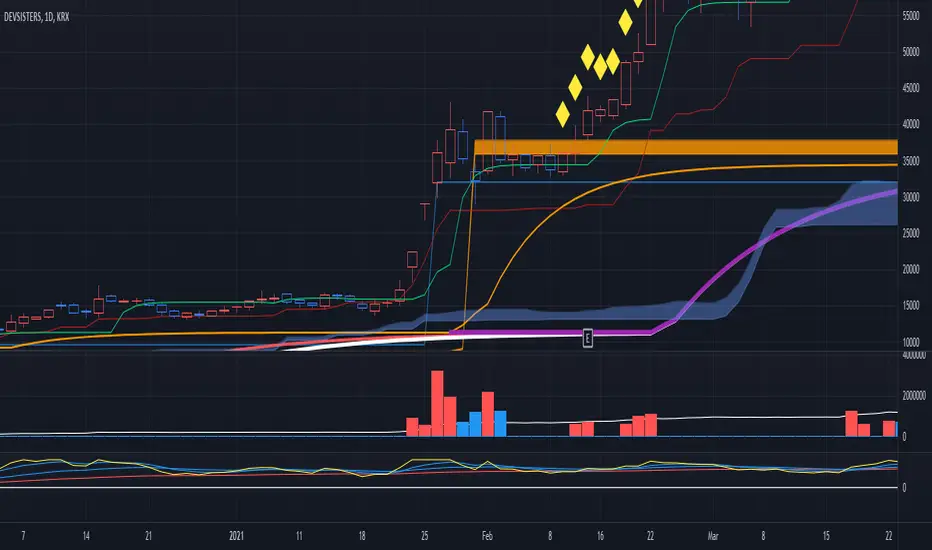
I'm trader Baekdoosan who trading Equity from South Korea. This Baekdoo swing trading box indicate good buying position when it crossover the box.
Here's the ideas
1. It needs to crossover 1 month highest value and higher than 5 ema and 20 ema line
2. It also needs to crossover 1 month volume as well
3. Once 1,2 soaring candle emerge, it needs to correction time
4. 5 ema or 20 ema or center candle's 2/3 point x 0.95 (5% lower) would be the resistant line
5. center candle's 2/3 point line would be the buying point (you may can trade when it cross over
you can check above example chart and take a look what you have interested in.
hope this will help your trading on equity as well as crypto. I didn't try it on futures . Best of luck all of you. Gazua~!
אינדיקטור Pine Script®