Zeta ScalperWhat is Scalping?
Scalping is a trading strategy aimed at profiting from quick momentum in a volatile index or stock.
Traders who use such strategies place anywhere from 10 to a few hundred trades in a single day.
The idea behind such type of trading is that small moves in an index or stock price are much easier to capture than the larger moves.
Traders who use such strategies are known as scalpers. When you take many small profits a number of times, say 10 points scalped 20 times per day, they can easily add up to large gains.
An Option Buyer's Biggest Enemy is Time Decay and when you scalp, you do not allow the time decay to eat your Option Premium as your Entry and Exit is often quick enough.
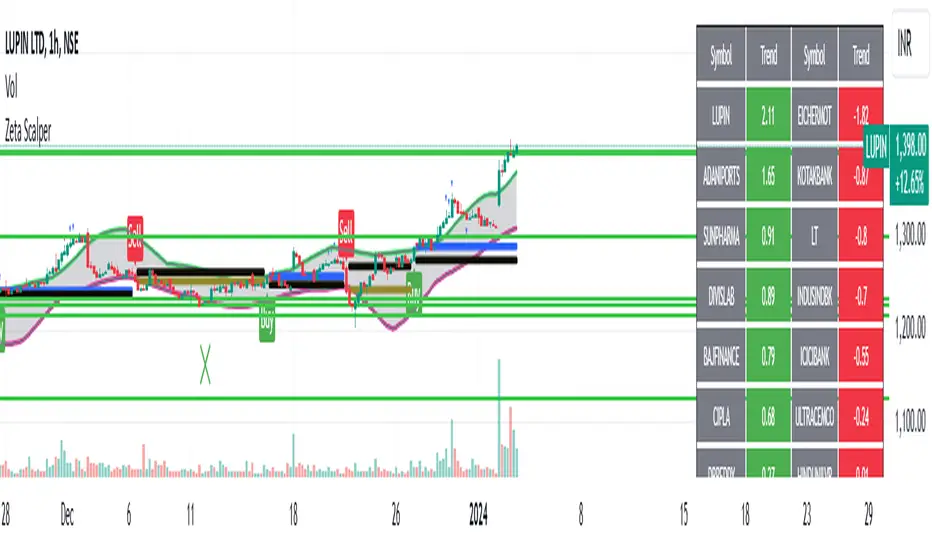
What is Zeta Scalper?
Zeta Scalper indicator is a momentum based indicator which tries to detect momentum based upon a number of Candle Stick Patterns.
When it thinks a move has the potential to turn into a big move, it generated its Buy/Sell Signals.
It is a well known fact that actual drivers of the market are Big Institutions, Mutual Funds & Big Guys with deep pockets.
They have large amounts of money to invest and they buy & sell in bulk.
When they buy, often their objective is to buy at lower levels (below average price of the day) & when they sell they sell at higher levels (above average price of the day).
Zeta Scalper seeks to detect this activity. When aggressive buying or selling starts where Buying & Selling Forces become unequal, the Price starts moving in one direction with candles making Higher Highs or Lower Lows.
Zeta Scalper detects these Higher Highs or Lower Lows and generates Buy or Sell signals when this happens.
In order to use this indicator, simply deploy this on your chart, and wait for Buy/Sell signals.
It works on all time frames including 1 min. 3min. 5min. & 10min. etc.
When a Buy Signal is followed by Sell signal (let it be after 3 - 4 candles or after many candles) or vice-versa, you have to switch your position to make most of the reverse move.
It is a general purpose indicator and may be used on stocks, commodities and currencies alike and is not meant for any specific market.
How to Take Buy/Sell Entry with Zeta Scalper?
Whenever you see a Buy Signal, mark its closing price with a horizontal line and as soon as a candle breaks this candle's High, it is time for you to take Entry.
Your STOP LOSS could be just 0.5% below your Entry Price, hence, no big loss even if things go wrong.
Keep moving your STOP LOSS up as the price moves in your favour and when market turns around and you see a SELL signal, it is time to book your BUY position profit and take Entry on SELL Side now and so on.
How to get this indicator?
This is invite-only indicator. Get in touch with us using information given below in Signature field to try this tool FREE.
אינדיקטור Pine Script®