זמן
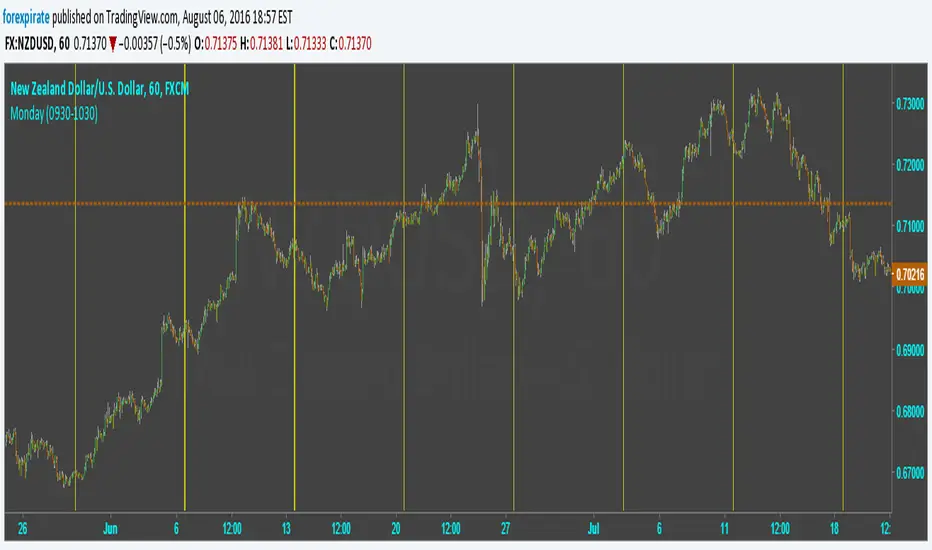
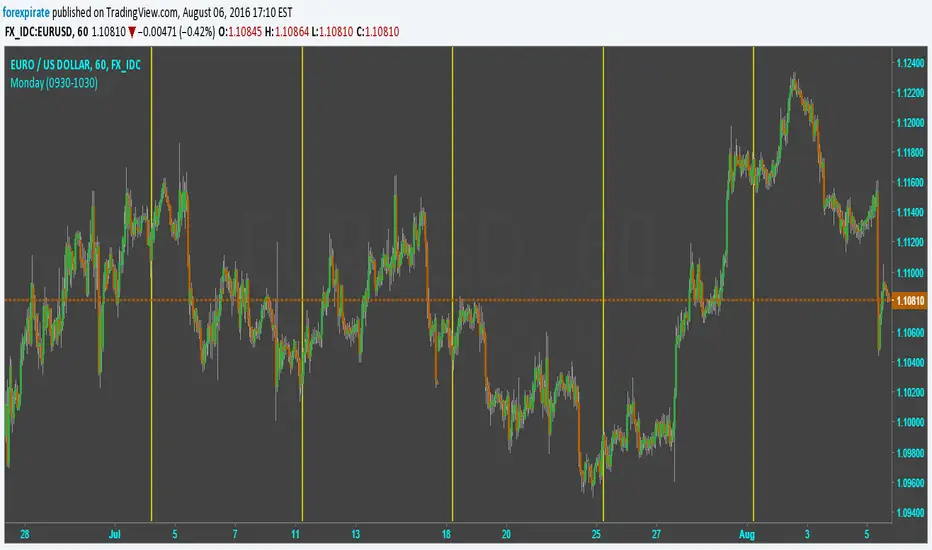
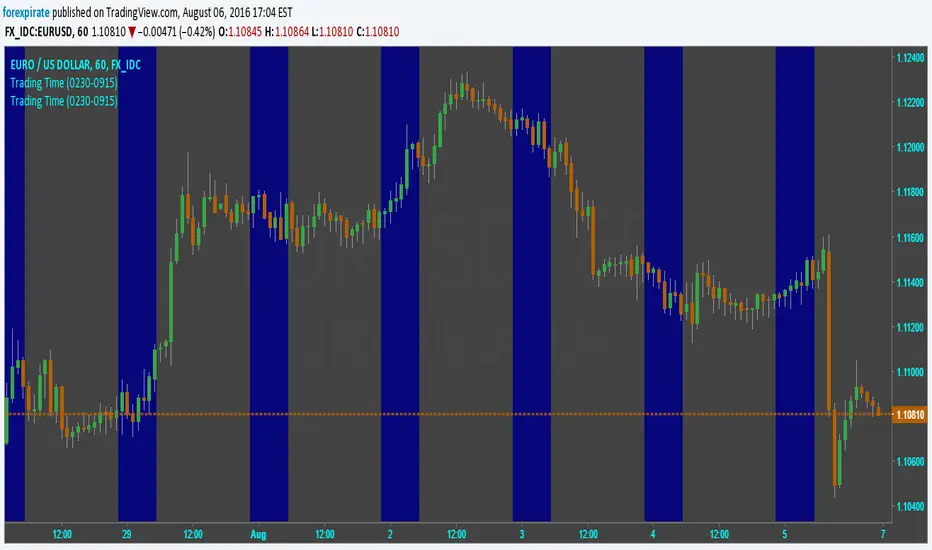
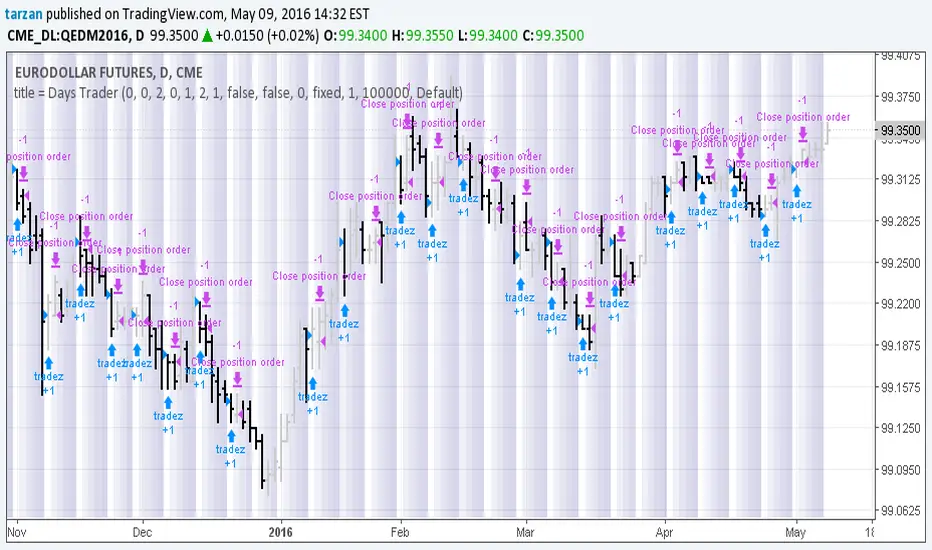
Trading TimeCode put blue bars during times you input. I put it to show times I am asleep and not alert to trade. I also put code into strategy to control when trades can open or close. FXCM and IDC exchanges have different time zones, as well as AMEX, etc. You will have to change it for each zone.
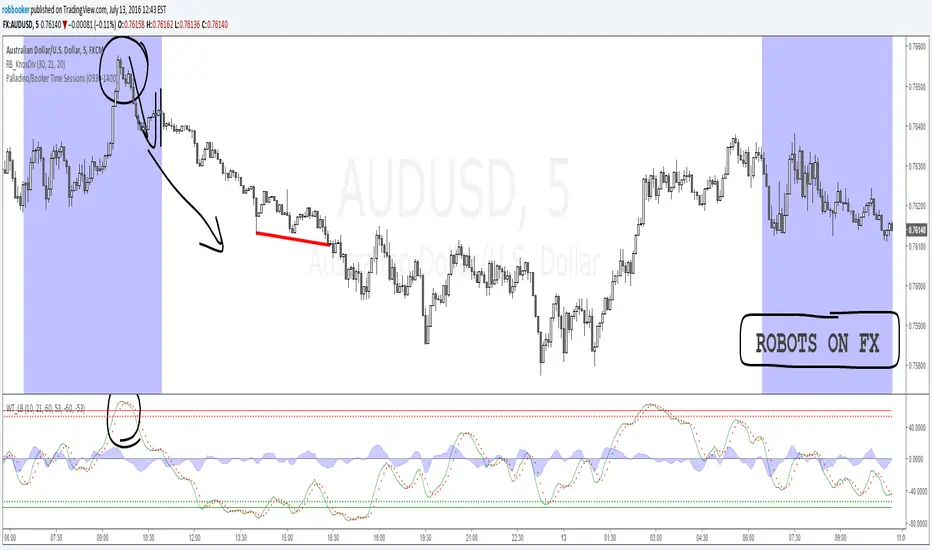
Palladino/Booker Time SessionsThe Palladino/Booker Time Sessions script will allow you to highlight certain periods of time during the day that are best suited to your trading. Add the script to your chart as many times as you like to highlight as many Time Sessions as you like.
Strategy Code Example 2 - Time Limiting*** THIS IS JUST AN EXAMPLE OF STRATEGY TIME LIMITING CODE IMPLEMENTATION ***
This is a follow up to my example for risk management implementation here:
Code remains mostly unchanged, but now includes a time limiting implementation.
Relevant code blocks for the time factor are preceded with a comment stating:
*** FOCUS OF EXAMPLE ***
Cheers!

Days Trader 1.0Simple program to look for day of week or day of month patterns in chart data.
All original work by Boffin Hollow Lab
Author: Tarzan
Forex Trading Sessions with Daylight Savings TimeV1 - Max WarrenDifferent version of the CM one but everything is configurable and easy to manage.
Daylight savings may also be toggled, I cannot automatically toggle it yet but hopefully with a pine update I will be able to.
It had the four main sessions but version two could possibly have all of them as optional toggles
Hope it is useful

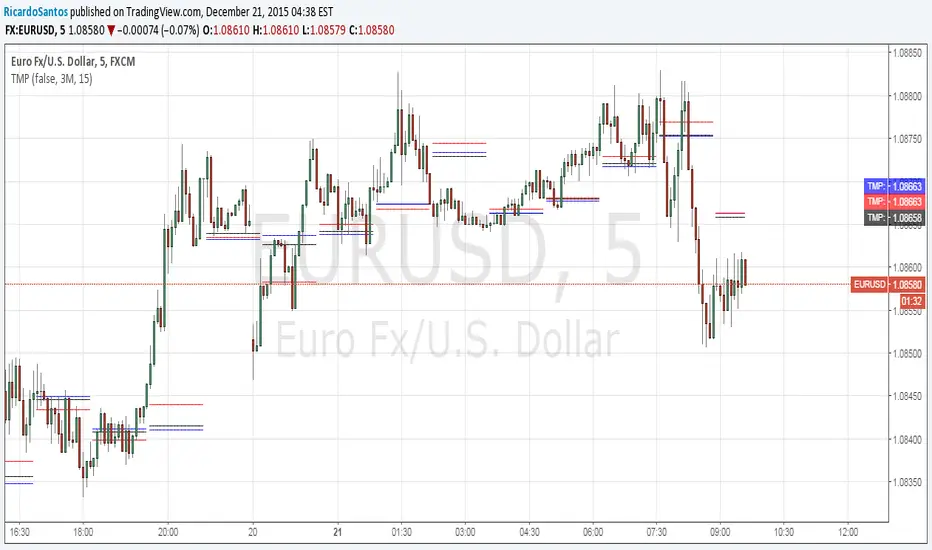
[RS]Temporal Median Price V1EXPERIMENTAL: previous custom time window median price and current time window open price in a neat package :p
(JeanLouisHardy) added option for bar count system, also added a donchian average.
[RS]Shifted Pivots V1update: added weekly and monthly pivots, the offset is a average approximation so there may be inconsistency on the date forecasted to be end of week/month.
(using diferent sessions or limited time intervals is not possible).

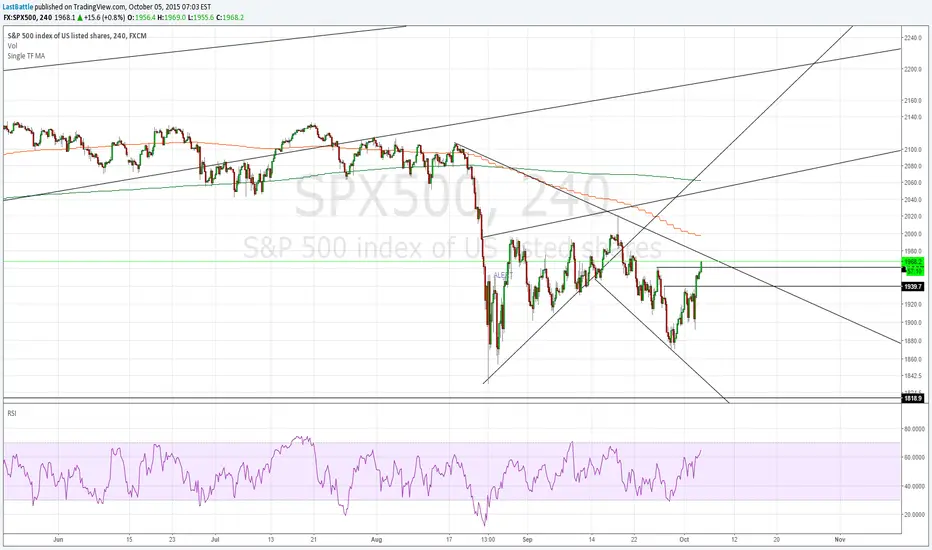
Single Timeframe Moving AverageProvides Moving average of 200 and 50 at the specific timeframe regardless of what interval you're looking at.
Saving the need to change it manually each time you switch the interval.
In this chart, I am looking at 4H interval with EMA of 50/200 of daily timeframe.
alpha Renko intraday wave timeI was asked to share my experimental Renko intraday wave time. So here it is warts and all. The same for the rest - except the Weis cumulative volume.
Renko wave time is in minutes. This script is strictly intraday and has not been played with extensively.
You must use traditional Renko and set the script wave size to the same size as the Renko brick size.
If you click on the sideways wishbone or "V" in the middle upper part of the chart you will get all of the scripts in this particular sandbox. After clicking the sideways wish bone click on "make it mine". You will then have the whole sandbox. The only published script is the Weis cumulative wave.
The "Boys MAs" is supposed to be a script for daily charts and from within some kind of consolidation. In any case I am intrigued by some signals. You have a variety of sandbox options in the format section of the boys MAs.
These codes are pretty rough with lots of abandoned lines of script.

[RS]Timed Percentual Change V0EXPERIMENTAL: time based percentual change.
note: each series uses it self as base reference so there's a bit a divergence.

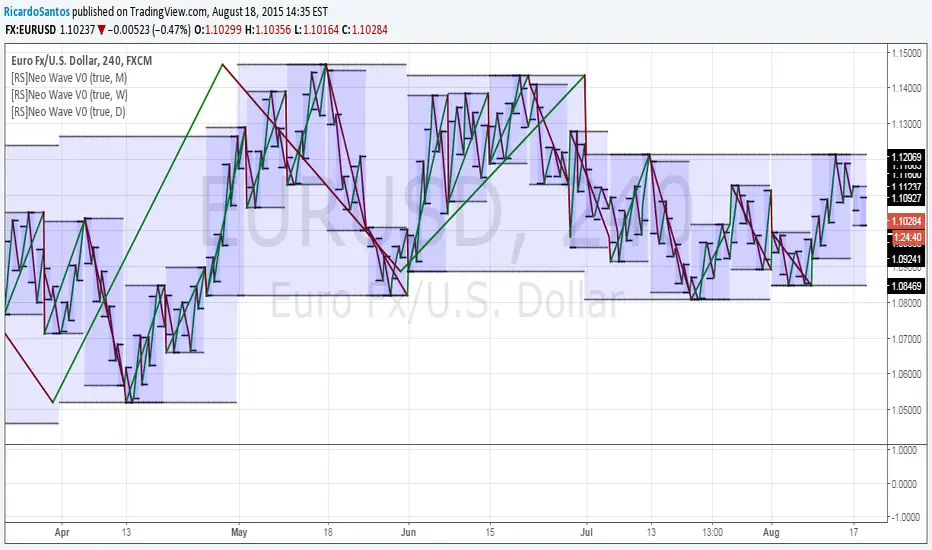
[RS]Neo Wave V0EXPERIMENTAL: Request for IvanLabrie.
Method for reading Neo Wave's.
note: some issues arent possible to work around/fix due to limitations in pinescript.
3BBands (3 Spirolinas)The script combines 3 single Bollinger bands into one script for easy plotting and range modification. It can be used for analyzing a market with multiple time frames and ranges using Fibonacci series as the range.

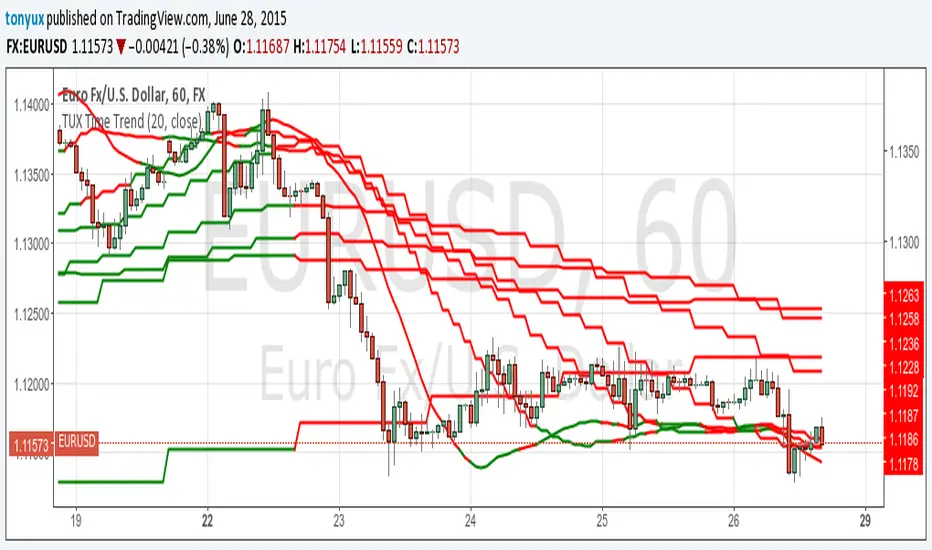
TUX Time TrendThis script was inspired by @ChartArt.
GREEN = UPTREND
RED = DOWNTREND
TREND IS DETERMINED BY IF THE CLOSE IS BELOW OR ABOVE THE SMA SET (DEFAULT 20)
It has the trend of the following time-frames:
1 HR
2 HR
3 HR
4 HR
6 HR
8 HR
12 HR
1 DAY
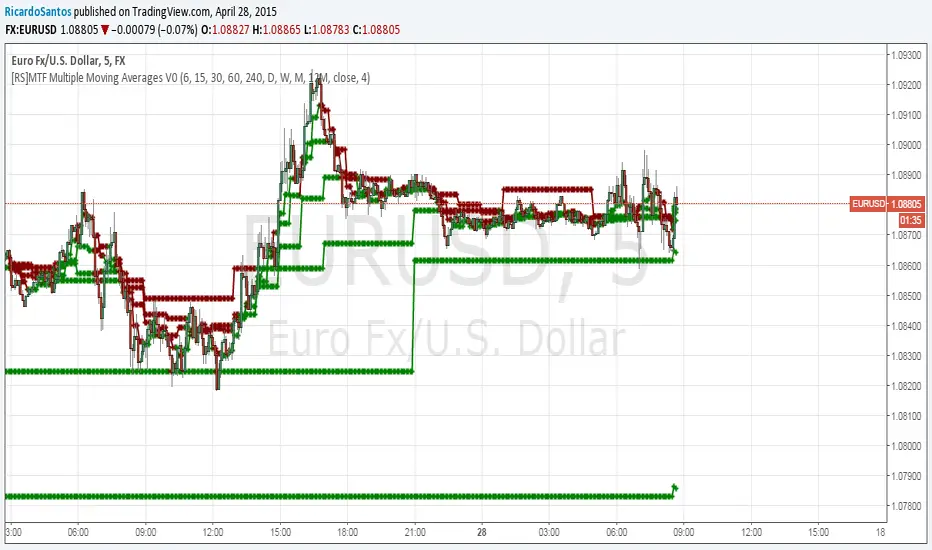
[RS]MTF Multiple Moving Averages V0Multiple moving averages with same interval in candle bar smoothness over multiple time frames.
option to show/hide the level of resolution for the mtf's default shows 1 ma can go up to 8th resolution.
option for manual input timeframes and configure ma.
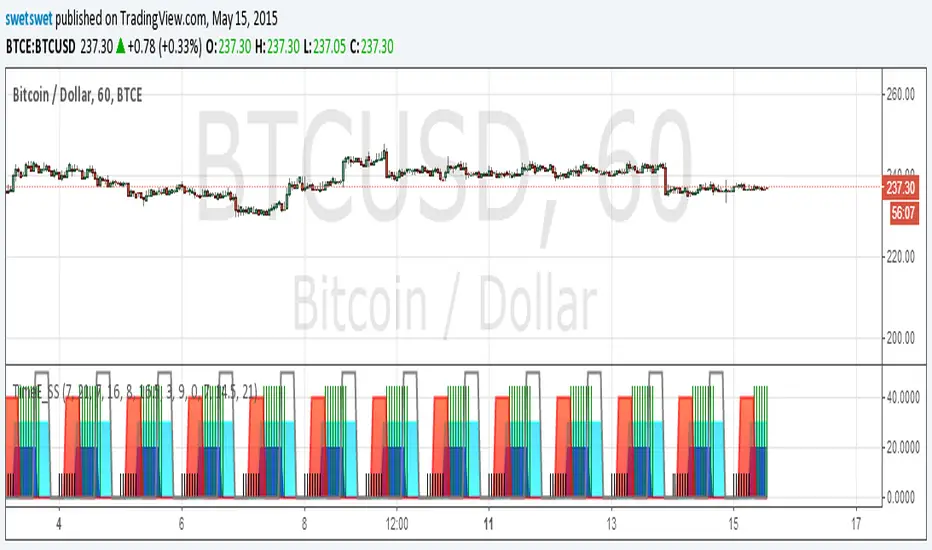
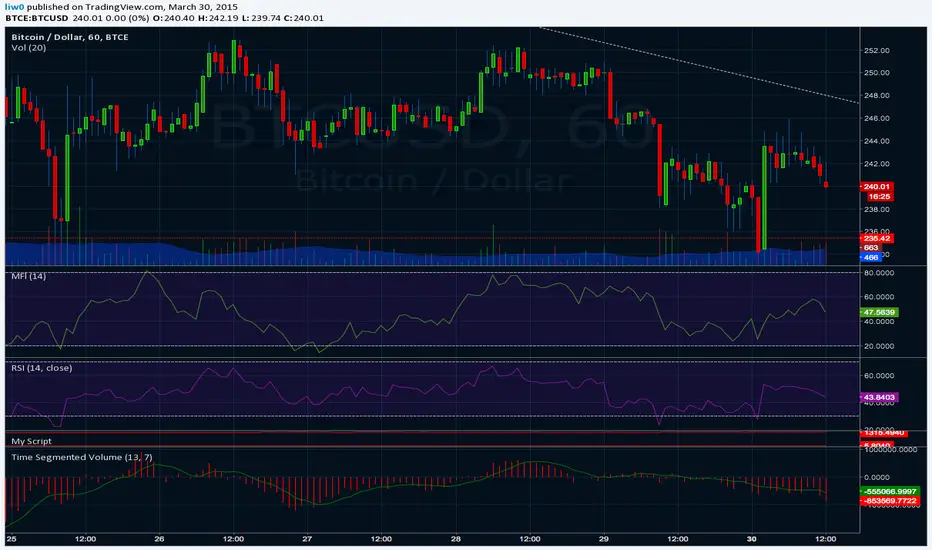
Time Segmented VolumeTime Segmented Volume
an indicator I was asked to port by sunnyd76
CREDITS: quant.stackexchange.com
If you like it I would also be happy about a small donation
BTC 1GyfGTBsVHMbPovFGFeipe7b7ET1aebGx5
Questions or Comments? Just send me a PM!
[RS]Temporal Median Price V0EXPERIMENTAL: previous custom time window median price and current time window open price in a neat package :p
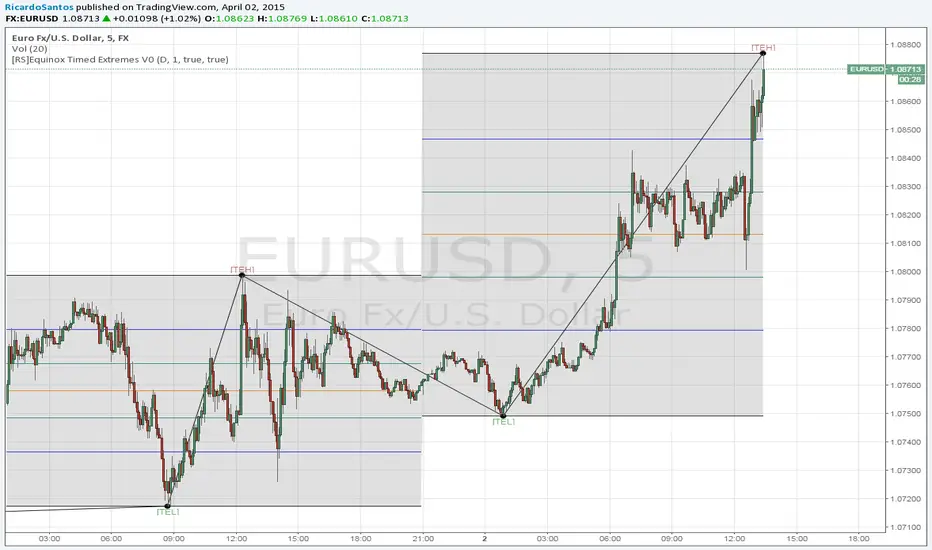
[RS]Temporal Extreme Spliter V0EXPERIMENTAL: this script can be used as a trend follower if bgcolor is active, it can be used to catch extremes and target levels for a pull back to the mean, can be used as support and resistance with the time period open price and extreme. other uses, improvements let me know :p.
True Strength Indicator MTFHere is an example of a script showing a multi-time frame of TSI.
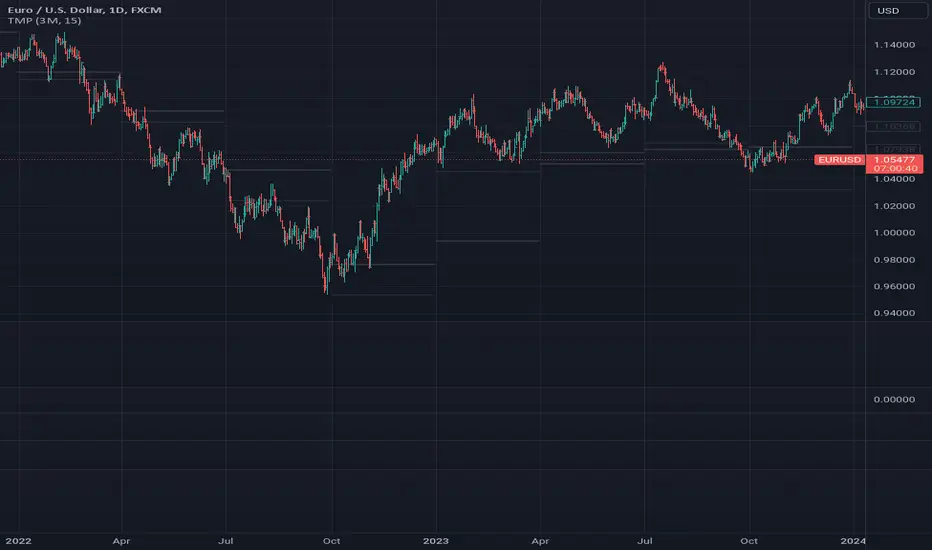
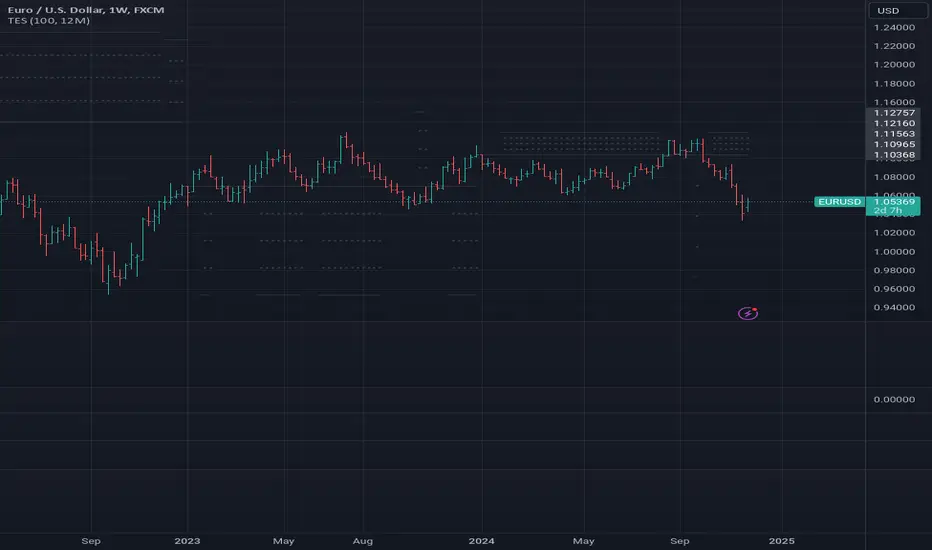
Chart below compares FX EURUSD Daily TSI to 1H TSI
Here is an updated version
study("True Strength Indicator MTF", shorttitle="TSI MTF")
resCustom = input(title="Timeframe", type=resolution, defval="60" )
long = input(title="Long Length", type=integer, defval=25)
short = input(title="Short Length", type=integer, defval=13)
signal = input(title="Signal Length", type=integer, defval=13)
price = close
double_smooth(src, long, short) =>
fist_smooth = ema(src, long)
ema(fist_smooth, short)
pc = change(price)
double_smoothed_pc = double_smooth(pc, long, short)
double_smoothed_abs_pc = double_smooth(abs(pc), long, short)
tsi_value = 100 * (double_smoothed_pc / double_smoothed_abs_pc)
tsi = security(tickerid, resCustom,tsi_value)
plot(tsi, color=black)
plot(ema(tsi, signal), color=red)
hline(0, title="Zero")

Fisher Transform MTFThis is a simple code that allows a user to use Fisher Transform Indicator for multiple time frames.
