Standardized MACD Heikin-Ashi TransformedThe Standardized MACD Heikin-Ashi Transformed (St. MACD) is an advanced indicator designed to overcome the limitations of the traditional MACD. It offers a more robust and standardized measure of momentum, making it comparable across different timeframes and securities. By incorporating the Heikin-Ashi transformation, the St. MACD provides a smoother visualization of trends and potential reversals, enhancing its utility for traders seeking a clearer view of the underlying market direction.
Methodology:
The calculation of St. MACD begins with the traditional MACD, which computes the difference between two exponential moving averages (EMAs) of the price. To address the issue of non-comparability across assets, the St. MACD normalizes its values using the exponential average of the price's height. This normalization process ensures that the indicator's readings are not influenced by the absolute price levels, allowing for objective and quantitatively defined comparisons of momentum strength.
Furthermore, St. MACD utilizes the Heikin-Ashi transformation, which involves deriving candles from the price data. These Heikin-Ashi candles provide a smoother representation of trends and help filter out noise in the market. A predictive curve of Heikin-Ashi candles within the St. MACD turns blue or red, indicating the prevailing trend direction. This feature enables traders to easily identify trend shifts and make better informed trading decisions.
Advantages:
St. MACD offers several key advantages over the traditional MACD-
Standardization: By normalizing the indicator's values, St. MACD becomes comparable across different assets and timeframes. This makes it a valuable tool for traders analyzing various markets and seeking consistent momentum measurements.
Heikin-Ashi Transformation: The integration of the Heikin-Ashi transformation smoothes out the indicator's fluctuations and enhances trend visibility. Traders can more easily identify trends and potential reversal points, improving their market analysis.
Quantifiable Momentum: St. MACD's key levels represent the strength of momentum, providing traders with a quantifiable framework to gauge the intensity of market movements. This feature helps identify periods of increased or decreased momentum.
Utility:
The St. MACD indicator offers versatile utility for traders-
Trend Identification: Traders can use the color-coded predictive curve of Heikin-Ashi candles to swiftly determine the prevailing trend direction. This aids in identifying potential entry and exit points in the market.
Reversal Signals: Colored extremes within the St. MACD signal potential price reversals, alerting traders to potential turning points in the market. This assists in making timely decisions during market inflection points.
Overbought/Oversold Conditions: The histogram version of St. MACD can be used in conjunction with the bands to detect short-term overbought or oversold market conditions, allowing traders to adjust their strategies accordingly.
In conclusion, this tool addresses the limitations of the traditional MACD by providing a standardized and comparable momentum indicator. Its incorporation of the Heikin-Ashi transformation enhances trend visibility and assists traders in making more informed decisions. With its quantifiable momentum measurements and various utility features, the St. MACD is a valuable tool for traders seeking a clearer and more objective view of market trends and reversals.
Key Features:
Display Modes: MACD, Histogram or Hybrid
Reversion Triangles by adjustable thresholds
Bar Coloring Methods: MidLine, Candles, Signal Cross, Extremities, Reversions
Example Charts:
-Traditional limitations-
-Comparisons across time and securities-
-Showcase-
See Also:
-Other Heikin-Ashi Transforms-
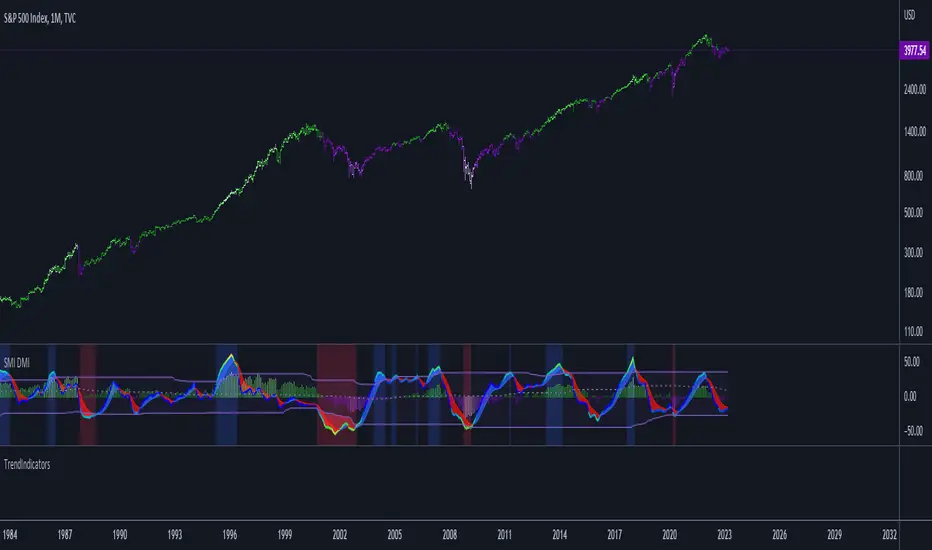
Trendindicator

Days Higher Than Current PriceThe "Days Higher Than Current Price" indicator is a color-coded tool that provides insights into the historical price performance of an underlying asset. By analyzing the number of bars prior to the selected day that had higher closing prices, this indicator visually represents the comparative strength or weakness of the current price level.
The "Days Higher" indicator utilizes a color-coded scheme to indicate the number of days in the asset's price history where the closing prices were higher than the current day's price. The color spectrum ranges from red to blue, representing varying levels of historical price strength.
Color Coding:
The color coding scheme of the indicator offers a quick and intuitive understanding of the price performance:
Red: Represents a higher number of days in the asset's price history where the closing prices were higher than the current day's price. This suggests a weaker price trend or a potential reversal and indicates relative price weakness.
Blue: Represents a lower number of days in the asset's price history where the closing prices were higher than the current day's price. This indicates a strong trend of higher prices and suggests relative price strength.
Orange & Green: Correspond to different numbers of days where the closing prices were higher than the current day's price. The specific color gradations between red and blue reflect increasing or decreasing historical price strength.
Methodology:
The "Days Higher" indicator examines each bar in the asset's price history leading up to the selected day. It counts the number of bars where the closing prices were higher than the current day's price.
The indicator then assigns a specific color to the price chart based on the count of such days, providing a visual representation of historical price strength relative to the current price level.
Utility:
The "Days Higher" indicator offers traders and investors a unique perspective on the historical price performance of an asset. By assessing the color-coded chart, market participants can quickly gauge the presence of strong or weak historical price trends.
This information can be used to identify potential support or resistance levels, assess the overall strength of a trend, or evaluate the likelihood of a price reversal. Traders may incorporate this indicator into their analysis to make more informed trading decisions based on the historical price strength indicated by the color-coded chart.
It is important to note that this tool should be used in conjunction with other technical analysis tools and indicators to validate signals and make well-rounded trading decisions.
Example Charts:
-Indices-
-Stocks-
-Cryptos-
-Multi-Timeframe-

On Balance Volume Heikin-Ashi Transformed
The OBV Heikin Ashi indicator is a modified version of the On-Balance Volume indicator that incorporates the Heikin Ashi transformation. This technical tool aims to provide traders with a smoother representation of volume dynamics and price trends.
The OBV Heikin Ashi indicator combines the principles of OBV and Heikin Ashi to offer insights into the volume and price behavior of an asset. Understanding OBV and Heikin Ashi individually will provide a foundation for comprehending the uniqueness and utility of this indicator.
On-Balance Volume:
OBV is a volume-based indicator that measures the cumulative buying and selling pressure in the market. It considers the relationship between volume and price movements to determine the overall strength and direction of a trend. Rising OBV values suggest bullish buying pressure, while falling values indicate bearish selling pressure.
Heikin Ashi:
Heikin Ashi is a Japanese candlestick charting technique that aims to filter out noise and provide a smoother representation of price trends. It calculates each candlestick based on the average of the previous candle's open, close, high, and low prices. Heikin Ashi candles can reveal the underlying trend more clearly by reducing market noise.
Methodology:
The 𝘖𝘉𝘝 𝘏-𝘈 indicator applies the Heikin Ashi transformation to the OBV values. Each OBV value is replaced with a Heikin Ashi equivalent, which is calculated based on the average of the previous Heikin Ashi candle's open and close prices. This transformation smooths out the OBV values and helps identify the overall trend with reduced noise. Additionaly, 2 optional EMAs are included for convergence-divergence analysis.
By applying the Heikin Ashi transformation to OBV, the indicator aims to enhance the readability of volume and trend information, providing traders with a clearer understanding of market dynamics.
Utility:
The 𝘖𝘉𝘝 𝘏-𝘈 indicator can be a valuable tool for traders and investors in analyzing volume and price trends. It offers a smoother representation of OBV values, allowing for easier identification of trend reversals, bullish or bearish market conditions, and potential trading opportunities. Traders can utilize the indicator to confirm price trends, validate support and resistance levels, and enhance their overall trading strategies.
It is worth noting that the effectiveness of the indicator may vary depending on the specific market and trading strategy. It is recommended to combine its analysis with other technical indicators and perform thorough backtesting before making trading decisions.
Key Features:
2 Adjustable EMAs
Normalized Oscillator Mode
Example Charts:
See Also:
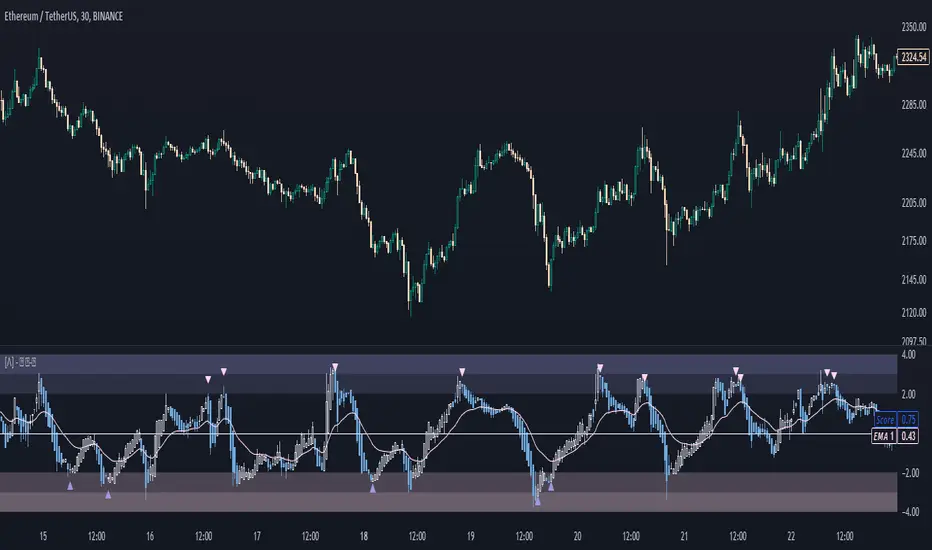
Z-Score Heikin-Ashi Transformed

Z-Score Heikin-Ashi TransformedThe Z-Score Heikin-Ashi Transformed (𝘡 𝘏-𝘈) indicator is a powerful technical tool that combines the principles of Z-Score and Heikin Ashi to provide traders with a smoothed representation of price movements and a standardized measure of market volatility.
The 𝘡 𝘏-𝘈 indicator applies the Z-Score calculation to price data and then transforms the resulting Z-Scores using the Heikin Ashi technique. Understanding the individual components of Z-Score and Heikin Ashi will provide a foundation for comprehending the methodology and unique features of this indicator.
Z-Score:
Z-Score is a statistical measure that quantifies the distance between a data point and the mean, relative to the standard deviation. It provides a standardized value that allows traders to compare different data points on a common scale. In the context of the 𝘡 𝘏-𝘈 indicator, Z-Score is calculated based on price data, enabling the identification of extreme price movements and the assessment of their significance.
Heikin Ashi:
Heikin Ashi is a popular charting technique that aims to filter out market noise and provide a smoother representation of price trends. It involves calculating each candlestick based on the average of the previous candle's open, close, high, and low prices. This approach results in a chart that reduces the impact of short-term price fluctuations and reveals the underlying trend more clearly.
Methodology:
The 𝘡 𝘏-𝘈 indicator starts by calculating the Z-Score of the price data, which provides a standardized measure of how far each price point deviates from the mean. Next, the resulting Z-Scores are transformed using the Heikin Ashi technique. Each Z-Score value is modified according to the Heikin Ashi formula, which incorporates the average of the previous Heikin Ashi candle's open and close prices. This transformation smooths out the Z-Score values and reduces the impact of short-term price fluctuations, providing a clearer view of market trends.
This tool enables traders to identify significant price movements and assess their relative strength compared to historical data. Positive transformed Z-Scores indicate that prices are above the average, suggesting potential overbought conditions, while negative transformed Z-Scores indicate prices below the average, suggesting potential oversold conditions. Traders can utilize this information to identify potential reversals, confirm trend strength, and generate trading signals.
Utility:
The indicator offers valuable insights into price volatility and trend analysis. By combining the standardized measure of Z-Score with the smoothing effect of Heikin Ashi, traders can make more informed trading decisions and improve their understanding of market dynamics. 𝘡 𝘏-𝘈 can be used in various trading strategies, including identifying overbought or oversold conditions, confirming trend reversals, and establishing entry and exit points.
Note that the 𝘡 𝘏-𝘈 should be used in conjunction with other technical indicators and analysis tools to validate signals and avoid false positives. Additionally, traders are encouraged to conduct thorough backtesting and experimentation with different parameter settings to optimize the effectiveness of the indicator for their specific trading approach.
Key Features:
Optional Reversion Doritos
Adjustable Reversion Threshold
2 Adjustable EMAs
Example Charts:
See Also:
On Balance Volume Heikin-Ashi Transformed
Rough AverageThe Rough Average indicator is a unique technical tool that calculates a modified average to provide insights into market conditions. It incorporates a combination of mathematical operations and existing indicators to offer traders a different perspective on price movements.
The Rough Average indicator aims to capture market dynamics through a specific calculation method. It utilizes two main components: a check for the approximate scale of the price and a profile calculation based on the Relative Strength Index (RSI) of the closing price.
Methodology:
Approximate Scale: The indicator determines the approximate scale of the price by analyzing the magnitude of the closing price. This step involves a mathematical process that identifies the power of 10 that best represents the scale. This function reduces overall lag and gives a better smoothing to the output of the calculation
Profile Calculation: The indicator calculates a profile value by summing the absolute values of the RSI of the closing price over a specified period. The RSI provides insights into the strength or weakness of price movements. The profile calculation considers a range of prices based on the determined scale.
Indicator Calculation:
The Rough Average is derived by applying the Exponential Moving Average (EMA) to the calculated profile. The EMA is a smoothing technique that emphasizes recent price data. The resulting value represents the modified average of the indicator.
Utility:
The Rough Average indicator offers traders an alternative perspective on market conditions. By utilizing a modified average calculation, it can reveal potential trends, reversals, or periods of market strength or weakness. Traders can use the Rough Average to complement their analysis and identify possible trading opportunities.
It is important to note that the effectiveness of the Rough Average indicator may vary depending on the specific market and trading strategy. It is recommended to combine its analysis with other technical indicators and conduct thorough testing before making trading decisions.
Key Features:
Customizable OB\OS Levels
Bar coloring methods: Trend, Reversions, Extremities
Example Charts:

Major and Minor Trend Indicator by Nikhil34aScript Description:
This script is designed to provide a visual indication of the major and minor trends of an asset, along with potential buy and sell signals. It calculates two Simple Moving Averages (SMA): a longer-term 200-period SMA (Major SMA) and a shorter-term 20-period SMA (Minor SMA). The script determines whether the asset's closing price is above or below these moving averages to identify the major and minor trends. It also detects potential buying and selling opportunities based on the intersection of the asset's price with the SMA lines.
Usefulness:
This script can be useful for traders and investors who follow trend-based strategies and want to monitor the major and minor trends of an asset. By visually displaying the trends and potential buy and sell signals, it helps traders make informed decisions about entering or exiting positions.
Simple Explanation on BTC Chart:
In the context of a BTC chart, let's consider the following scenario:
BTC is currently trading above the 200-period SMA (Simple Moving Average), which is located at 29,059.
BTC is trading below the 20-period SMA, positioned at 30,178.
The current price of BTC is 29,916.
Based on this information, we can conclude that:
The major trend is bullish since BTC is trading above the 200-period SMA.
The minor trend is bearish as BTC is trading below the 20-period SMA.
The intersection of the price with the moving averages indicates a potential selling opportunity.
Traders using this script would observe that BTC is in a bullish major trend, a bearish minor trend, and there is a possibility of a sell signal. They may consider these factors when making trading decisions, such as adjusting their positions or taking profits.
Remember to conduct your own analysis and consider additional factors before making any trading decisions.

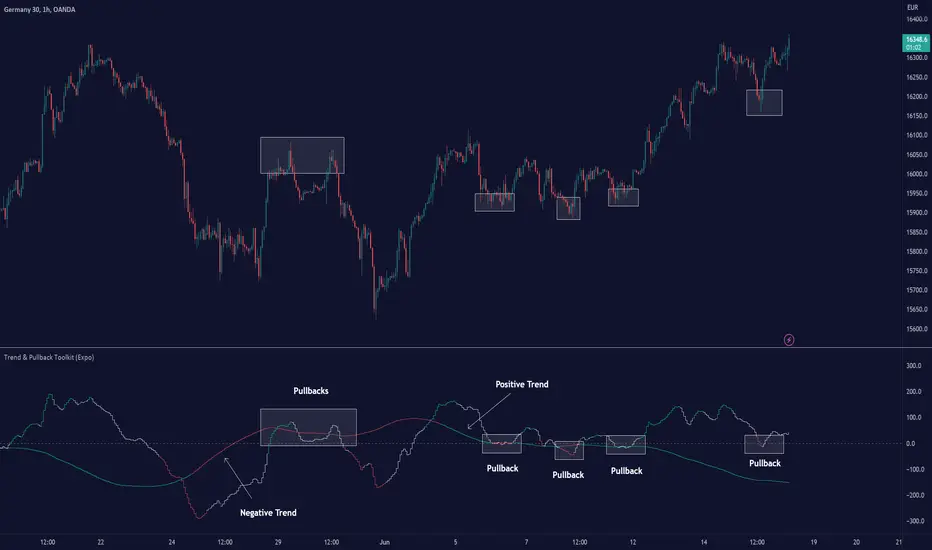
Trend & Pullback Toolkit (Expo)█ Overview
The Trend & Pullback Trading Toolkit is an all-encompassing suite of tools designed for serious traders who want a comprehensive trend approach. It empowers traders to align their strategies with prevailing market trends, thereby mitigating risk while maximizing profit potential.
The Toolkit helps traders spot, analyze, and react to market trends, pullbacks, and significant trends. It combines multiple trading methodologies, such as the Elliott Wave theory, cyclical analysis, retracement analysis, strength analysis, volatility analysis, and pivot analysis, to provide a thorough understanding of the market. All these tools can help traders detect trends, pullbacks, and major shifts in the overall trend. By integrating different methodologies, this toolkit offers a multifaceted approach to analyzing market trends.
In essence, the Trend & Pullback Toolkit is the complete package for traders seeking to detect, evaluate, and act upon market trends and pullbacks while being prepared for major trend shifts.
The Trend & Pullback Toolkit works in any market and timeframe for discretionary analysis and includes many oscillators and features, but first, let us define what a cycle is:
█ What is a cycle
This involves the analysis of recurring patterns or events in the market that repeat over a specific period. Cycles can exist in various time frames and can be identified and analyzed with various tools, including some types of oscillators or time-based analysis methods.
Traders must also be aware that cycles do not always repeat perfectly and can often shift, evolve, or disappear entirely.
█ Features & How They Work
Elliott Wave Cycles: This is a method of technical analysis that traders use to analyze financial market cycles and forecast market trends. Elliott Wave theory asserts that markets move in repetitive cycles, which traders can analyze to predict future price movement. The core principle behind the theory is that market prices alternate between an impulsive, or driving phase, and a corrective phase on all time scales of trend. This pattern forms a fractal, meaning it's a self-similar pattern that repeats regardless of the degree or size of the waves.
The Elliott Wave Cycle Feature uses the principle of the Elliott Wave to identify trends and pullbacks in real-time.
Ratio Wave Cycle: This method elaborates on the concept of how negative volatility, or the degree of variation in the negative returns of a financial instrument, influences the effectiveness of a relative price move. Essentially, it delves into the relationship between the negative fluctuations in the market and the resulting relative price change, exploring how the two aspects interact with each other.
The central concept is that trends are generally more stable and predictable than rapid retracements. Therefore, the indicator calculates the relationship between these two market movements. By doing so, it establishes a trend-based identification system. This system aids in forecasting future market movements, allowing traders to make informed decisions based on these predictions. Essentially, it uses the calculated relationship to discern the overall direction (trend) of the market despite temporary counter-movements (retracements), thereby providing a more robust trading signal.
Periodic Wave Cycle: Thi refers to patterns or events in price action that recur over a specific time period. Periodic cycles can range from short-term intraday cycles (like the tendency for stock market volatility to be high at the opening and close of trading) to long-term cycles trend cycles. Traders use this to predict future price movements and trends.
By identifying the phases of a cycle, traders can predict key turning points in the market.
Retracement Cycles: Retracements are temporary price reversals that occur within a larger trend. These retracements are a common occurrence in all markets and timeframes, representing a pause or counter-move within a larger prevailing trend. Retracements can be driven by a variety of factors, including profit-taking, market uncertainty, or a change in market fundamentals. Despite these periodic reversals, the overall trend (upwards or downwards) often continues after the retracement is complete.
Fibonacci retracement functions are primarily used to identify potential retracement levels.
Volatility Cycle: A volatility cycle refers to the periodic changes in the degree of dispersion or variability of a security's returns, expressed as a standard deviation or variance. This feature uses both measures.
Strength Cycle: Gauges the power of a market trend and its inherent impulses. This feature offers a broad perspective on the cyclical nature of markets, which alternate between periods of strength, often referred to as bull markets, and periods of weakness, known as bear markets. It effectively tracks the direction, intensity, and cyclic patterns of market behavior.
Let us define the difference between strength and impulse:
Strength: This refers to the power or force behind a price move. In trading, this refers to the momentum or volume supporting a price move.
Impulse: In the context of trading, an impulse usually refers to a strong move in price. Impulse moves are typically followed by corrective moves against the trend.
Pivot Cycles: Pivot cycles refer to the observation of recurring price patterns or turning points in the market. Pivots can be defined as significant highs or lows that act as potential reversal or support/resistance points. Pivot point analysis helps traders understand the prevailing market sentiment. Overall, pivot cycles provide traders with a framework to identify potential market turning points and price levels of interest.
█ How to use the Trend & Pullback Toolkit
Elliott Wave Cycles
Ratio Wave Cycle
Periodic Wave Cycle
Retracement Cycles
Volatility Cycle:
Strength Cycle
Pivot Cycles
█ Why is this Trend & Pullback Toolkit Needed?
The core philosophy of this toolkit revolves around the popular adage in trading circles: "The trend is your friend." This toolkit ensures that you are always in sync with the trend, thereby increasing the chances of successful trades.
Here's an overview of the key benefits:
Trend Identification: The toolkit includes sophisticated algorithms and indicators that help identify the prevailing trend in the market. These algorithms analyze price patterns, momentum, volume, and other factors to determine the direction and strength of the trend.
Risk Reduction: By enabling traders to trade with the trend, this toolkit reduces the risk of betting against market momentum.
Profit Maximization: Trading with the trend increases the likelihood of successful trades.
Advanced Analysis Tools: The toolkit includes tools that provide a deeper insight into market dynamics. These tools enable a multi-dimensional analysis of market trends, from Elliott Wave cycles and period cycles to retracement cycles, ratio wave cycles, pivot cycles, and strength cycles.
User-friendly Interface: Despite its sophistication, the toolkit is designed with user-friendliness in mind. It allows for customization and presents data in easy-to-understand formats.
Versatility: The toolkit is versatile and can be used across different markets - stocks, forex, commodities, and cryptocurrencies. This makes it a valuable resource for all types of traders.
█ Any Alert Function Call
This function allows traders to combine any feature and create customized alerts. These alerts can be set for various conditions and customized according to the trader's strategy or preferences.
█ In conclusion, The Trading Toolkit is a powerful ally for any trader, offering the capabilities to navigate the complexities of the market with ease. Whether you're a novice or an experienced trader, this toolkit provides a structured and systematic approach to trading.
-----------------
Disclaimer
The information contained in my Scripts/Indicators/Ideas/Algos/Systems does not constitute financial advice or a solicitation to buy or sell any securities of any type. I will not accept liability for any loss or damage, including without limitation any loss of profit, which may arise directly or indirectly from the use of or reliance on such information.
All investments involve risk, and the past performance of a security, industry, sector, market, financial product, trading strategy, backtest, or individual's trading does not guarantee future results or returns. Investors are fully responsible for any investment decisions they make. Such decisions should be based solely on an evaluation of their financial circumstances, investment objectives, risk tolerance, and liquidity needs.
My Scripts/Indicators/Ideas/Algos/Systems are only for educational purposes!
סקריפט בתשלום
Regularized-Moving-Average Oscillator SuiteThe Regularized-MA Oscillator Suite is a versatile indicator that transforms any moving average into an oscillator. It comprises up to 13 different moving average types, including KAMA, T3, and ALMA. This indicator serves as a valuable tool for both trend following and mean reversion strategies, providing traders and investors with enhanced insights into market dynamics.
Methodology:
The Regularized MA Oscillator Suite calculates the moving average (MA) based on user-defined parameters such as length, moving average type, and custom smoothing factors. It then derives the mean and standard deviation of the MA using a normalized period. Finally, it computes the Z-Score by subtracting the mean from the MA and dividing it by the standard deviation.
KAMA (Kaufman's Adaptive Moving Average):
KAMA is a unique moving average type that dynamically adjusts its smoothing period based on market volatility. It adapts to changing market conditions, providing a smoother response during periods of low volatility and a quicker response during periods of high volatility. This allows traders to capture trends effectively while reducing noise.
T3 (Tillson's Exponential Moving Average):
T3 is an exponential moving average that incorporates additional smoothing techniques to reduce lag and provide a more responsive indicator. It aims to maintain a balance between responsiveness and smoothness, allowing traders to identify trend reversals with greater accuracy.
ALMA (Arnaud Legoux Moving Average):
ALMA is a moving average type that utilizes a combination of linear regression and exponential moving average techniques. It offers a unique way of calculating the moving average by providing a smoother and more accurate representation of price trends. ALMA reduces lag and noise, enabling traders to identify trend changes and potential entry or exit points more effectively.
Z-Score:
The Z-Score calculation in the Regularized-MA Oscillator Suite standardizes the values of the moving average. It measures the deviation of each data point from the mean in terms of standard deviations. By normalizing the moving average through the Z-Score, the indicator enables traders to assess the relative position of price in relation to its mean and volatility. This information can be valuable for identifying overbought and oversold conditions, as well as potential trend reversals.
Utility:
The Regularized-MA Oscillator Suite with its unique moving average types and Z-Score calculation offers traders and investors powerful analytical tools. It can be used for trend following strategies by analyzing the oscillator's position relative to the midline. Traders can also employ it as a mean reversion tool by identifying peak values above user-defined deviations. These features assist in identifying potential entry and exit points, enhancing trading decisions and market analysis.
Key Features:
Variety of 13 MA types.
Potential reversal point bubbles.
Bar coloring methods - Trend (Midline cross), Extremities, Reversions, Slope
Example Charts:

David Varadi Intermediate OscillatorThe David Varadi Intermediate Oscillator (DVI) is a composite momentum oscillator designed to generate trading signals based on two key factors: the magnitude of returns over different time windows and the stretch, which measures the relative number of up versus down days. By combining these factors, the DVI aims to provide a reliable and objective assessment of market trends and momentum.
Methodology:
To calculate the DVI, a specific formula is applied. The magnitude component involves averaging smoothed returns over various lengths, weighted according to user-defined parameters. This calculation helps determine the magnitude of price changes. The stretch component follows a similar process, averaging smoothed returns over different lengths to gauge market momentum. Users have the flexibility to adjust the weights and lengths to suit their trading preferences and styles.
Utility:
The DVI offers versatility in its applications. It can be used for both momentum trading and trend analysis due to its smooth and consistent signals. Unlike some other oscillators, the DVI provides longer and uncorrelated signals, allowing traders to effectively combine trend-following and mean-reversion strategies. For example, the DVI is adept at identifying overbought levels above the 200-day moving average, serving as a useful tool for determining exit points during price strength and even potential shorting opportunities. Traders can develop simple trading systems based on the DVI, buying above the 200-day moving average and selling when the DVI exceeds a specified threshold. Conversely, they can consider short positions below the 200-day moving average and cover when the DVI falls below a specific threshold. The DVI's objective approach to analyzing market momentum makes it a valuable resource for traders seeking to identify trading opportunities.
Key Features:
Bar coloring: based on Trend, Extremeties or Reversions
Reversions: Potential reversal points marked with triangles above\below oscillator
Extremity Hues: Highlighting oxcillator reaching traditional OB\OS levels
Example Charts:

SuperBollingerTrend (Expo)█ Overview
The SuperBollingerTrend indicator is a combination of two popular technical analysis tools, Bollinger Bands, and SuperTrend. By fusing these two indicators, SuperBollingerTrend aims to provide traders with a more comprehensive view of the market, accounting for both volatility and trend direction. By combining trend identification with volatility analysis, the SuperBollingerTrend indicator provides traders with valuable insights into potential trend changes. It recognizes that high volatility levels often accompany stronger price momentum, which can result in the formation of new trends or the continuation of existing ones.
█ How Volatility Impacts Trends
Volatility can impact trends by expanding or contracting them, triggering trend reversals, leading to breakouts, and influencing risk management decisions. Traders need to analyze and monitor volatility levels in conjunction with trend analysis to gain a comprehensive understanding of market dynamics.
█ How to use
Trend Reversals: High volatility can result in more dramatic price fluctuations, which may lead to sharp trend reversals. For example, a sudden increase in volatility can cause a bullish trend to transition into a bearish one, or vice versa, as traders react to significant price swings.
Volatility Breakouts: Volatility can trigger breakouts in trends. Breakouts occur when the price breaks through a significant support or resistance level, indicating a potential shift in the trend. Higher volatility levels can increase the likelihood of breakouts, as they indicate stronger market momentum and increased buying or selling pressure. This indicator triggers when the volatility increases, and if the price is near a key level when the indicator alerts, it might trigger a great trend.
█ Features
Peak Signal Move
The indicator calculates the peak price move for each ZigZag and displays it under each signal. This highlights how much the market moved between the signals.
Average ZigZag Move
All price moves between two signals are stored, and the average or the median is calculated and displayed in a table. This gives traders a great idea of how much the market moves on average between two signals.
Take Profit
The Take Profit line is placed at the average or the median price move and gives traders a great idea of what they can expect in average profit from the latest signals.
-----------------
Disclaimer
The information contained in my Scripts/Indicators/Ideas/Algos/Systems does not constitute financial advice or a solicitation to buy or sell any securities of any type. I will not accept liability for any loss or damage, including without limitation any loss of profit, which may arise directly or indirectly from the use of or reliance on such information.
All investments involve risk, and the past performance of a security, industry, sector, market, financial product, trading strategy, backtest, or individual's trading does not guarantee future results or returns. Investors are fully responsible for any investment decisions they make. Such decisions should be based solely on an evaluation of their financial circumstances, investment objectives, risk tolerance, and liquidity needs.
My Scripts/Indicators/Ideas/Algos/Systems are only for educational purposes!

Trend IndicatorThis indicator has different features:
1. Ichimoku = this indicator can plot Ichimoku calculated both in the common formula and with the volume average, you can choose the calculator method for each line.
2. Channel and Bands = this mode allows the user to choose from channel and band, "channel" shows the Keltner channel, and "band" shows the Bollinger bands. Both the indicators are calculated including the volume in the formula of the average midpoint.
3. Color candle = this function allows the user to see two different colors of candles on the chart, the positive color occurs when both the long-term average and the short team average of price calculated using the volume is above the two averages calculated without the volume. This function is great to analyze the volume pressure, useful to identify trend continuation and exhaustion.
4. Extreme reversal zones = this is a version of the Keltner channels calculated over a high number of candles and with high deviation, to identify the potential zones of reversal.
Note that in the "Ichimoku" indicator, the backline is the T.R.A.M.A. indicator, created and published open source by Lux Algo, which I thank for the script.

TrendIndicatorsLibrary "TrendIndicators"
This is a library of 'Trend Indicators'.
It aims to facilitate the grouping of this category of indicators, and also offer the customized supply of
the source, not being restricted to just the closing price.
Indicators (this is a work in progress):
1. Absolute DI (Directional Moviment Index) (Difference between DI+ and DI-).
Used in 'DMI Stochastic Extreme' by Barbara Star.
2. DMI
DI_Abs(lengthDI, smoothDI, typeMA, lengthMA)
@description Absolute DI (Directional Moviment Index).
Used in 'DMI Stochastic Extreme' by Barbara Star.
Difference between DI+ and DI-
Parameters:
lengthDI : (int) Length of DI+/DI-
smoothDI : (bool) Sets whether absolute DI should be smoothed
typeMA : (int) Type of moving average of smoothing
lengthMA : (int) Length for moving average of smoothing
Returns: (float) Absolute value of DI
dmi(diLength, adxSmoothing)
@description DMI (Directional Movement Index)
Same as ta.dmi()
Parameters:
diLength : (int) Length of DI+/DI-
adxSmoothing : (int) ADX Smoothing
Returns: Tuple of three DMI series: Positive Directional
Movement (+DI), Negative Directional Movement (-DI) and Average Directional Movement Index (ADX).
dmi(source, diLength, adxSmoothing)
@description DMI (Directional Movement Index)
Customized version of ta.dmi(), with custom source
Parameters:
source : (float) Source for DI+/DI-
diLength : (int) Length of DI+/DI-
adxSmoothing : (int) ADX Smoothing
Returns: Tuple of three DMI series: Positive Directional
Movement (+DI), Negative Directional Movement (-DI) and Average Directional Movement Index (ADX).
Multi indicators tableThis is a comprehensive trading tool that presents an overview of the market in a tabular format. It consists of five distinct categories of trading indicators : Volatility, Trend, Momentum, Reversal, and Volume. Each category includes a series of indicators that are widely used in the trading communauty.
The Volatility category includes the Average True Range (ATR) and Bollinger Bands indicators. The Trend category comprises the Average Directional Index (ADX), four Exponential Moving Averages (EMAs), Aroon, Parabolic SAR, and the Supertrend. The Momentum category includes the Stochastic Relative Strength Index (StochRSI), Money Flow Index (MFI), Williams %R, Relative Strength Index (RSI), and Commodity Channel Index (CCI). The Reversal category includes Parabolic SAR, Moving Average Convergence Divergence (MACD), and PP Supertrend. Finally, the Volume category includes the Volume Exponential Moving Average (EMA) indicator.
The indicators states are easily readable, the indicator case is colored based on his actual state. A bullish color (green by default), a bearish color (red by default),
a very bullish color (dark green by default), a very bearish color (dark red by default) and a neutral color (gray by default) displayed when the indicator doesn't give us a clear signal. Some indicators do not have a very bullish or very bearish state. Concerning volatility indicators, the bullish color indicates high volatility, the bearish color indicates low volatility, and the neutral color indicates normal volatility.
Most of the indicators displayed in the table are customizable, and traders can choose to hide the categories they don't want to use. The Indicator provides a quick and easily readable view on the market and allows traders to reduce the number of indicators on their chart making it lighter and more readable.

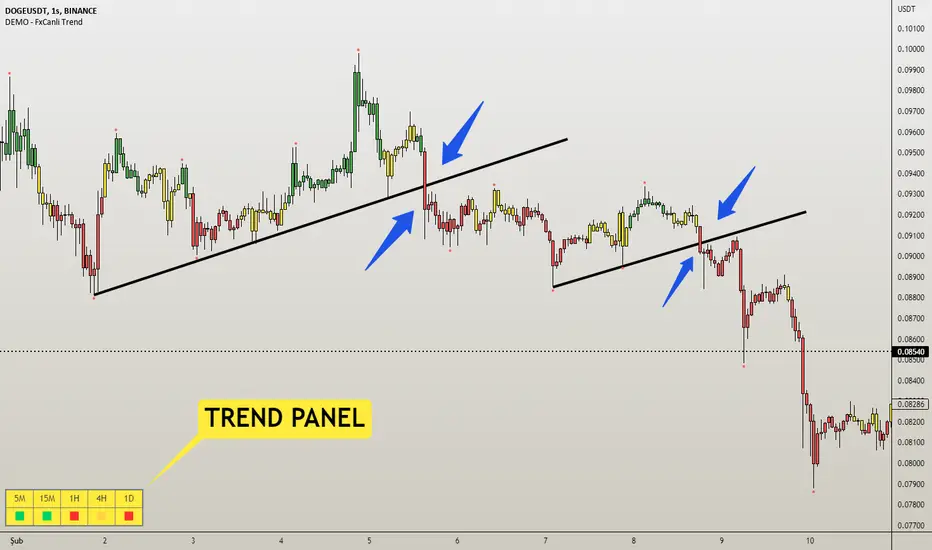
DEMO - FxCanli TrendEN - FxCanli Trend indicator will help you to show the way of the trend and give alerts when trend changed
DEMO VERSION of FXCANLI TREND Indicator work with any NZD or any DOGE symbols
TR - FxCanli Trend İndikatörü grafiklerinizde trendin yönünü veren ve trend değiştiğinde alarm veren TradingView indikatörüdür.
FXCANLI TREND indikatörünün DEMO VERSİYONUNU herhangi bir NZD veya DOGE sembolü ile kullanabilirsiniz.
EN - For Example | TR - Örnek
NZD|...
NZD|USD
NZD|CAD
NZD|CHF
NZD|JPY
DOGE|...
DOGE|USD
DOGE|USDT
DOGE|USDTPERP
DOGE|BTC
EN - FxCanli Trend indicator will help you to show the way of the trend and give alerts when trend changed
When the candles are;
Green Candles - Up Trend
Yellow Candles - Trend may Change
Red Candles - Down Trend
TR - FxCanli Trend İndikatörü grafiklerinizde trendin yönünü veren ve trend değiştiğinde alarm veren TradingView indikatörüdür.
Yeşil Mumlar - Yukarı Trend
Sarı Mumlar - Trend Dönebilir
Kırmızı Mumlar - Aşağı Trend
HOW TO USE BUY & SELL SIGNALS ?
(ALIŞ & SATIŞ SINYALLERI NASIL KULLANILIR?)
1) Never use BUY or SELL signals without any chart patterns. (Alış veya Satış sinyallerini asla formasyonsuz kullanmayın)
it can give good results with the candle color change when chart pattern triggered
(Formasyon gerçekleştiğinde, mum rengi değişimi takip edilmeli)
Ex 1) Wedge Pattern (Takoz Formasyonu) - BTC|USDT
Ex 2) Flag Pattern (Bayrak Formasyonu) - ETC|USDT
Ex 3) Head and Shoulders Pattern ( Omuz Baş Omuz Formasyonu)
Ex 4) Triangle Pattern ( Üçgen Formasyonu)
Features - Özellikler
1) Trend Panel - Trend Paneli
2)EN - Panel Width - to get better view at mobile phones and tablets
TR - Cep telefonları ve tabletlerde daha güzel görünüm için Panel Genişliği
3) Multi Timeframe Trend Tracking - Çoklu Zaman Dilimi Trend Takibi
4) Alert Control / Alarm Kontrolü
EN - Selected Alert - when all timeframes have same trend it will give selected time frame alert
TR - Seçilmiş Zaman Dilimi - Tüm seçilen zaman dilimleri aynı trend olunca, seçilmiş zaman dilimi alarmı verir
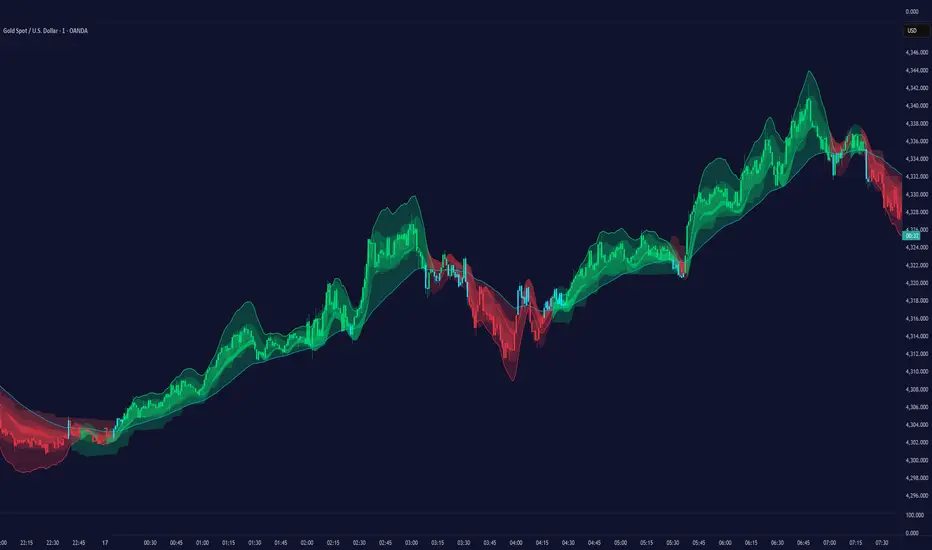
Trend Tracer [Cloud] (Expo)█ Overview
The Trend Tracer (Expo) indicator identifies and predicts the future market direction. The cloud is designed to make it easier to see when a market is trending in one direction or another and to help traders identify potential entry and exit points, as well as trend changes. It is a visual representation of the price's momentum, price action, and volatility by using the trend range in a cloud-like pattern. The bigger the cloud, the more momentum the price has.
█ How is the trend tracer cloud calculated?
The primary function used in the code is an extension of traditional single-smoothed moving averages, using a more sophisticated weighting system to reduce the effect of short-term fluctuations and provide a clearer view of the underlying trend. Using this function, we get a unique leading trend tracer while maintaining a robust long-term trend tracer. This allows for more accurate trending signals and helps reduce the amount of noise in the data.
█ Trend Cloud Trading
Trend Cloud Trading is a type of trading based on technical analysis that uses a tool called a trend cloud. A trend cloud is a graphical representation of how a certain asset or instrument is trending over a specific period of time. The trend cloud will highlight areas where there is high volatility, low volatility, and the current trend direction and its strength.
█ How to use
One way of using the indicator is to look for a "cloud break," which is when the cloud turns from red to green (or vice versa) and indicates a change in the trend.
S/R Levels
The Trend Tracer Cloud can be used to find support in a bullish trend and resistance in a bearish trend. If the cloud is sloping downwards in a bearish trend, traders can look for potential resistance levels at the highs of the cloud. Similarly, if the cloud is sloping upwards in a bullish trend, traders can look for potential support levels at the lows of the cloud.
Volatility
The width of the cloud is used to determine if there is high or low volatility.
Strength
The deviation between the leading trend advisor line and the price determines whether a trend is strong or weak. The larger the deviation, the stronger the trend move.
█ Indicator Features
Trend Cloud
It highlights the trending range, current volatility, and trend direction.
Trend Advisor - leading and trending + cloud
The leading trend advisor highlights the short-term trend strength and momentum, while the trending trend advisor highlights the underlying long-term trend.
Trend Tracker
The Trend Tracker is a fast-moving trend-following line that combines long-term and short-term trend characteristics.
Trend Candlesticks
The Bar coloring uses momentum to highlight the current trend direction.
-----------------
Disclaimer
The information contained in my Scripts/Indicators/Ideas/Algos/Systems does not constitute financial advice or a solicitation to buy or sell any securities of any type. I will not accept liability for any loss or damage, including without limitation any loss of profit, which may arise directly or indirectly from the use of or reliance on such information.
All investments involve risk, and the past performance of a security, industry, sector, market, financial product, trading strategy, backtest, or individual's trading does not guarantee future results or returns. Investors are fully responsible for any investment decisions they make. Such decisions should be based solely on an evaluation of their financial circumstances, investment objectives, risk tolerance, and liquidity needs.
My Scripts/Indicators/Ideas/Algos/Systems are only for educational purposes!
Trend & Time Reset Indicator (TTRI)
TTRI (Trend & Time Reset Indicator) is an indicator based on the consecutive candles trend and time to identify the beginning and the end of the trend.
It is not meant to be a one-size-fits-all indicator for trading (Just Buy or Sell signal), it is an indicator for traders who have taken the time to fully understand its features such as trend reset, trend expansion and so on.
An important element of TTRI based on time is, for example, that as it gets closer to the Top/Bottom in a daily time frame, it becomes a single trend and continues to an extended trend. In a weekly time frame, it is an organic instance where TTRI trend begins and the duration of the trend increases over time. In addition, traders can use the proposed moment when the trend can be reset to strategically structure trading cycles.
TTRI indicatior is useful in all time frames and traders can select the time frame that provides the clearest TTRI (Top and Bottom) by considering the liquidity of the asset.
All education on the features of TTRI indicator will be provided through separate videos in my Telegram community space (see Instructions) and I hope to regularly research and provide discoveries for better trading with users.
As there is no single publicly available information resources that explains everything about the code of TTRI indicator, I will explain the functionality of TTRI indicator through the charts below.
TTRI indicator suggests the beginning and end of a trend using arrow signals displayed at the top of the candles. Green arrows indicate an upward trend and red arrows indicate a downward trend. These arrows are accumulated for past trend analysis. Yellow arrows are also displayed at the top of the previous candle to indicate that a trend reset is imminent, and this is also accumulated.
When the signal that proposes trend changes has a high level of reliability, the text 'P' will be displayed above the arrow.
If the trend is extended, it can be identified by consecutive numbers, and if the second trend is consecutively extended, it will be easily distinguished by displaying it as '2'. (If the trend extension continues, the reset signal will also be numbered in order 1,2,3.. accordingly) Obtained the next bottom signal from TTRI Top, the price has dropped by about 25% until then.
When yellow candlesticks with no shadows appear, it means that the probability of a trend reset signal appearing is high. It can be useful to trade according to the proposed trend change point.
As the number of candles increases, it indicates a stronger trend, and there is a tendency for the length and shape of later candles that reach TTRI signal condition to be affected by the length of the middle 5 candles.
To clearly identify the shape of closing candlesticks and the trend resistance/support levels, the candlestick numbers are arranged below the candles so that they do not interfere, and they are arranged in an area that does not overlap with the trend extension signal.
To reduce unnecessary noise signals, the candlestick numbers and reset signals for 70 candlesticks are displayed, and the signals in the area you want to confirm can be obtained clearly by not displaying the numbers for all candlesticks. (When you move to the area you want to confirm, you can check the numbers and signals for the 70 candlesticks in that area.)
There are two types related to trend extension, one is signal A which is more sensitively responding and the other is signal C which is displayed based on conditions after the trend extension is sufficiently progressed. The number of candles in the series of an extended trend can be hidden and only the trend switching signals A, C (Buy & Sell) can be selected to display.
The chart below is a daily Uber chart. After the breakout of TTRI resistance trend level, an extension is in progress and an extension A is printed with a warning, alerting for a topping.
Risk line is formed from the trend extension candles, TTRI Bottom/Top which is followed by the extended trend has a set of rules that are correlated with trend support/resistance level, detailed explanation of this will be provided in a separate video for those who have purchased access.
In the mode that only trend reset signals (Top/Bottom) are displayed, the table function below is useful. Users can directly check the status of TTRI progress in the upper time frame in the current frame.
The default time frame of the table is month, week, 3day, day, and the table position and hiding feature are user-selectable.
The diamond at the top of the candlestick, which is formed by the combination of the shape of the price-based candlestick (such as dragonfly doji types) and time-based TTRI indicator, suggests that the trend can be strongly progressed in one direction. Weakness is indicated in red, strength is indicated in green.
*Disclaimer : TTRI signals do not guarantee absolute profits through buy/sell calls. Traders must evaluate TTRI signal for a series of trends that move organically and time-frame-by-frame
A signal expands into consecutive trends and becomes a single trend on higher time frames, are you ready to enjoy the changes of the wave?
“A rising tide lifts all boats”
I express my gratitude to Tone Vays for sharing methods of actively thinking about establishing trading criteria and risk management (Completing Trader Advanced course on site in Hongkong) and sincerely thank Mr. Vngvar for providing the knowledge to build TTRI.
"With sincere gratitude to all, i wish for laughter and blessings to always be abundant for you and your family"

Trend and Momentum DashboardI created this indicator to tell me when it's time to trade (going long) and when it's time to wait (or going short).
You can enter up to 13 ticker (default is S&P500 and key market segments).
For each ticker, fibonacci levels are calculated and represented either in 5 color or 3 color mode as single lines.
(Thanks to eykpunter for the fibonacci level implementation. I'm using his code and modified it slightly).
Color coding (5 color mode) explanation:
blue = in uptrend area
light blue = in prudent buyers area
gray = in center area
light red = in prudent sellers area
red = in downtrend area
The topline is a combination of all ticker and shows if the market is either bullish or bearish (threshold adjustable in settings)
The bullish/bearish trend can also be used as background color. Alternatively the last bar in the selected time period is been highlighted.
How to use it:
The indicator works on all timeframes. Use the color coding explanation above to see the status of each asset.
a) You can evaluate "long" term trend using day or week timeframe. e.g. I'm usually trading only long and stay out of the market when it is not bullish (top line & background = blue). I'm also using it to know which segments/assets are currently "hot".
b) You can evaluate short term momentum (using 1h or lower timeframe) and see in which direction the market/assets are moving. e.g. I use this when the exchanges open to see how the day is going to move.
I've attached 3 examples in the screenshot - first is the default, in the second one I'm using different asset classes and the third one is for crypto.
Limitations:
There are security request limits as well as string limitations for the security calls in pine script, so I went to the maximum what is currently possible.
(No financial advise, for testing purposes only)

Wave Strength Oscillator By CryptoScriptsThe Wave Strength Oscillator uses a combination of wave strength and momentum to help catch the best entries for reversals and does so using a few methods. I'm currently using the 1h timeframe for BTC but feel free to experiment on different timeframes to see what works best for you. In the description below, I'll go over each signal, how it's derived, and how to use them!
Oversold (Green shaded area) - The oversold indication appears whenever both oscillators are oversold and is usually a good indicator that a reversal to the upside is around the corner (at least for a short period). Be advised these are the weakest of the three signals so I recommend using this signal with other indicators.
Overbought (Red shaded area) - The overbought indication appears whenever both oscillators are overbought and is usually a good indicator that a reversal to the downside is around the corner (at least for a short period). Be advised these are the weakest of the three signals so I recommend using this signal with other indicators.
Green Diamond - The green diamonds indicate whenever one or both of the oscillators are oversold AND they are both outside of the bollinger bands which is great for catching reversals to the upside (as seen in the chart). These may come two or three at a time so it may be best to wait until they have all printed before entering.
Red Diamond - The red diamonds indicate whenever one or both of the oscillators are overbought AND they are both outside of the bollinger bands which is great for catching reversals to the downside (as seen in the chart). These may come two or three at a time so it may be best to wait until they have all printed before entering.
Rocket - The rocket symbol occurs whenever BOTH oscillators are oversold and BOTH oscillators are outside of the bollinger bands. This is great for catching reversals to the upside but may come two or three at a time so it may be best to wait until they have all printed before entering.
Red Alarm - The red alarm symbol occurs whenever BOTH oscillators are oversold and BOTH oscillators are outside of the bollinger bands. This is great for catching reversals to the downside but may come two or three at a time so it may be best to wait until they have all printed before entering.
Input Options
Show Histogram - I also included a Histogram in the indicator to help gauge the level of buys/sell strength but kept it hidden for the default levels (i.e a green diamond with a red histogram bar is usually a good sign a reversal is about to happen to the upside whereas a green diamond with a green histogram bar may indicate a false reversal and there's still more room to the downside until a red bar appears. Always backtest this!)
Show Overbought/Oversold Levels - This is if you want to ignore all of the green/red shaded areas and only focus on the diamonds and rocket/alarm signals
Wave Overbought/Oversold Levels - Free free to change to value of the overbought/oversold levels to change where the green/red shades areas print
Momentum Overbought/Oversold Levels - Free free to change to value of the overbought/oversold levels to change where the green/red shades areas print
Histogram Length - This will not change anything with the signals but I included it so you can change the visuals if it helps you
Momentum Length - This will change where the signals plot
Momentum Signal - This only changes the yellow signal line and nothing else. It's not incorporated into any equation
Average Length - This will change where the signals plot
Alerts
I've set alerts on this indicator for each icon (Oversold, Overbought, Green Diamond, Red Diamond, Rocket, Red Alarm). I HIGHLY recommend setting the alerts for Candle Close so that you can be sure the signal is confirmed.
You may notice that the indicator can give multiple signals back-to-back or be overbought/oversold for multiple candles. When this happens, it's best to look at other indicators such as the RSI , MFI Pro, etc to nail the best entry and have confluence with your decision. With that said, having multiple signals back-to-back can also be an indication that the move is close to happening. This indicator works with crypto and stocks as well.
If you have any questions or would like to purchase this indicator, please comment below or PM me. I also made a video tutorial for the indicator on my Youtube channel (link is next to my profile pic)
Be advised past performance is not indicative of future returns. Backtest EVERY timeframe and NEVER blindly take signals! Also, never invest more than you can afford to lose.
Enjoy :)

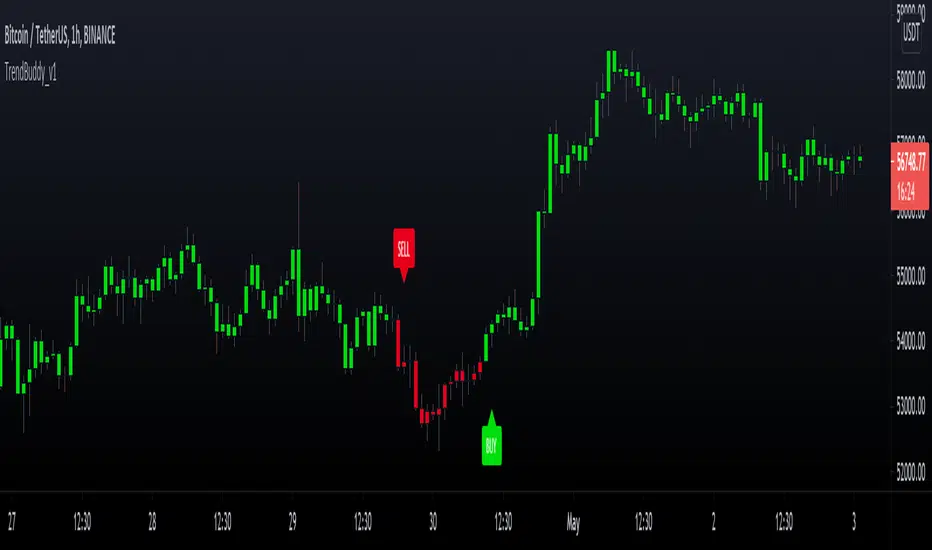
TrendBuddy_v1TrendBuddy is a trend signal generator indicator.
options:
control sensitivity of the signals
Sideways Market Detector
Filter signals based on Side Market
Indicator is based on combination of oscillators, moving averages, bollinger bands and price action.
The traders can use this tool to get trends when market is about to come out of choppy regions.
FXBABATRADING ~ ZTRENDOur ZTREND indicator is an outstanding Trend indicator to determine the Direction and Strength of the current price movement in units of Standard Deviation from a set period average, that is, helps you visualize the strength of the trend in relation to a set average. This indicator is part of a bundle of 5 indicators which we call the ZScore Indicator Suite all based on the ZScore function of statistics.
In this particular mode (ZTREND) you can see whether price is trending above or below the mean average of it, a simple moving average (period of your choice) determined by a + or - value. The value itself represents a custom function that indicates strength. A value above 1 or below -1 can be sustained ONLY if price is trending in such direction
In the example above we have the ZTrend indicators set at periods 253. It is best to use this indicator with a longer period setting in order to eliminate noise. You can add another ZTrend with a lower period to determine entries within a Trend.
Alerts can be turned off in settings
Each indicator in the ZScore Suite has a particular function:
ZClassic: Measures the position of Price in relation to a set average in units of standard deviation.
ZRange: Measures the position of the Standard Deviation itself in relation to a set average, in units of standard deviation.
ZVolumeDelta: Measures the position of Volume Delta in relation to a set average, in units of standard deviation.
ZTrend: Its a custom mathematical function that allows to measure the strength and direction of the Trend in reference to a set average.

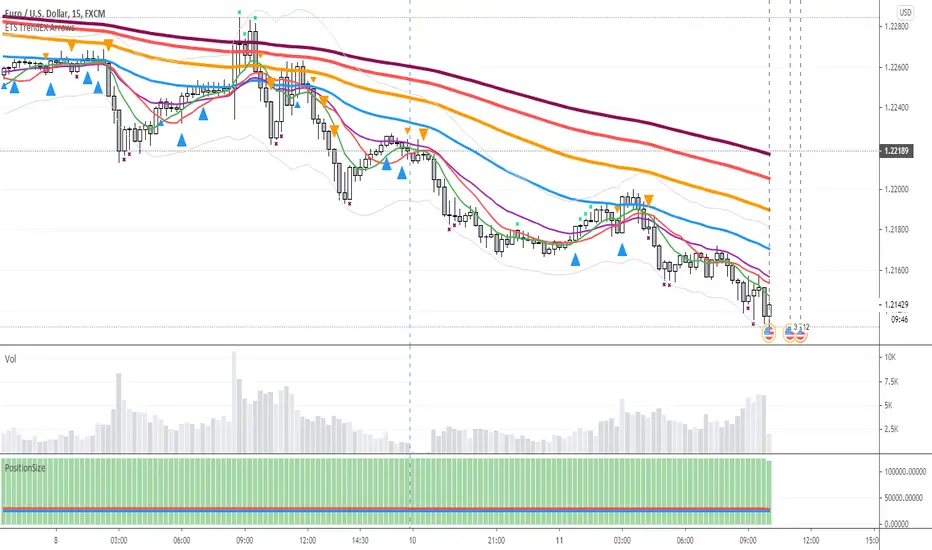
ETS Trend Early Cross ArrowsThis indicator is an updated version and alternative to the ETS Trending Arrows indicator that contains the results of years of trial and error to create an indicator aiming to mimic market entry points that a professional trader would take.
It has arrows to clearly show potential market entry points, and suggested stop-loss levels. This particular updated version of the Trending Arrows indicator responds faster to market direction changes, even before the main trend starts to change.
To use this indicator in the best way, with the best entry point, wait for the market to return close to, or touch, one of the moving averages. The larger the moving average, the better, and then enter in the direction indicated by the arrow. The arrow will not repaint once the bar closes, so use the initial arrow's appearance to prepare yourself to enter a trade, and then wait for your perfect entry that is close to a moving average or support/resistance level.
What Makes It So Powerful?
- Give you a signal as early as possible and does not "repaint" once the bar completes
- Reacts to fast market direction changes like a master trader
- Is super easy to understand and implement in your trading
- Can be used for Forex, Stocks and Crypto
- Works on all timeframes
How To Use The ETS Trend Early Cross Arrows (ETS TrendEX Arrows) Indicator
1. Add the indicator to any chart you wish to trade, Crypto, Forex or Stocks and set it to the timeframe you prefer. For instance, I use it on 1 minute and 5 minute charts for daytrading Stocks. For Forex I generally use a 15 minute chart, and longer timeframes for Crypto.
2. Open the Settings. Generally you should not need to change anything:
2.1. "Show 20, 50, 200 Moving Averages" - This is just a convenience, and is provided to help you identify where the market is trading in relation to the trend.
2.2. "Show Small Expo Moving Average" - Also provided for convenience, and goes with "SMAX" - Simple Moving Average - and the "EMAX" - Exponential Moving Average settings
2.3. "Show Potential Reversal Points" - You will notice small X indicators that appear when it's detected that the market might soon be reversing or at least halting and going sideways. A small red X at the bottom of a candle indicates that the market might not be moving further down much, warning you against taking a short position. While a small green X above a candle indicates that the market may be exhausted and soon reverse or at least stall. When the market eventually goes past the highs and lows indicated by these levels, the market often continues on its previous trend.
2.4. "Delength" - The length setting for the DeMarker indicator that's used internally.
2.5. "KC Length" - the Keltner Channel length setting.
2.6. "KC Multiplier" - the Keltner Channel multiplier setting.
2.7. "KC Source" - the Keltner Channel source setting.
2.8. "KC Exponential" - the Keltner Channel exponential or simple setting.
3. Now that you've set things up, all you need to do is to wait for a signal. Pay attention to where the market currently is in relation to the closest moving average, like the 10 SMA or 12 EMA . Keep in mind that price will often signal a new move, but then first move back to the average, before continuing in the new direction identified by the trading arrow.
4. Larger arrows are signals that go with the shorter term trend, and smaller arrows indicate a potential change in the market direction that is not yet in line with the shorter term trend. Typically it should be best to enter using the larger arrows, and be cautious, or exit a trade, that is counter to the smaller arrows.
5. These signals are intended to identify new trending moves, and for that reason, if the market moves against the signal, you should not hold on to your position hoping that it will turn in your favor.
6. When the market is moving in your favor, resist the urge to exit quickly, and use the smaller moving averages or support/resistance levels to exit your trades.
This is an "invite only" script, which means that you will need to let me know that you're interested in it before you can get access to it. This is a paid script, please follow the link in my profile to get the details or ask me directly. It may take up to 48 hours for me to respond, but I do my best to respond as quickly as possible. You will get 7 days to test it for yourself on all your charts with no restrictions.
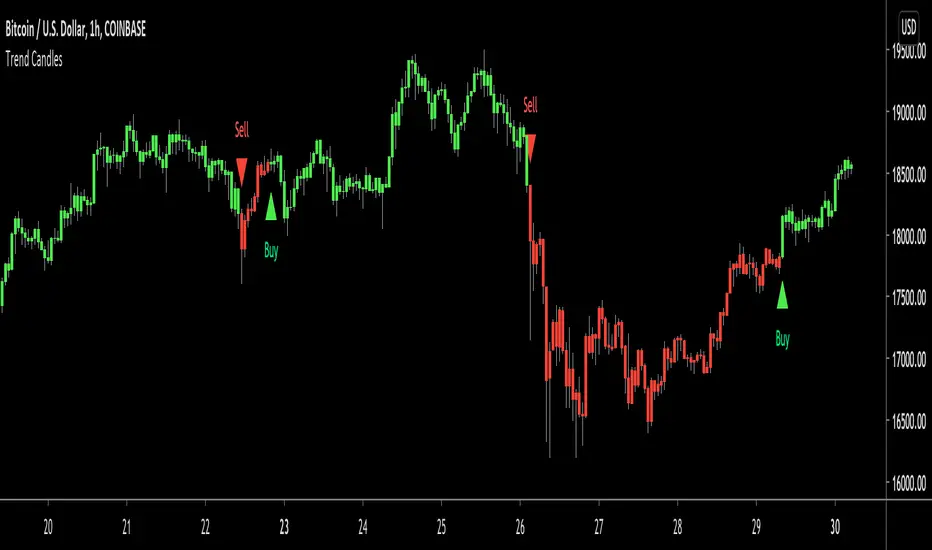
Trend CandlesTrend Candles is a simple indicator based on the trend following strategy that shows you exactly when to buy, sell and close trades on every chart, market and timeframe. It's always in a trade, either long or short as indicated by the color of the candles, when the candles are green that means go long, when they switch to red that means go short until the next green candle appears.
It's best used on markets that tend to trend a lot like currencies, futures and cryptos, however it also works well on stocks and ETFs (long-only).
How Is It Different From Other Indicators?
- Designed specifically for the trend following strategy
- Color coded candles for visually appealing chart guidance
- Signals are based on current and past volatility
- They aren't as sensitive to false signals after periods of contracted volatility
- Helps to keep you in the trend without being "shaken out"
- Can be applied to all markets and timeframes
How To Use The Indicator?
1) Visit our website URL shown below this description and subscribe
2) We will then grant your TradingView username permission to use our indicators
3) Go to your Indicators window, then the Invite-Only section and add our indicators to your chart
4) Our indicators will then show on every chart you now look at
5) You can set up alerts to be notified in real time of trading signals from our indicators
6) Read our user manual for all the best tips on how to use our indicators
7) Feel free to reach out to us for personal one-on-one help with getting setup
What Markets and Conditions Does It Work Best On?
All markets cycle between trending and ranging modes, and the key to successfully using these indicators is identifying when the market is in or likely to go into a trending mode, and as such it can be applied to all markets and timeframes. After a market has contracted for a period of time in a tight range, the 1st entry signal after the period of consolidation can become the start of a powerful trend. On the flip side taking every signal when a market is ranging will result in churn.
Our indicators are primarily designed for day trading and swing trading, however they can also be used for position trading and investing by keeping you invested in the trend which can be very difficult to do without a good indicator due to all of us being vulnerable to getting "shaken out" of a trend. This indicator will always respond to changes in price and will never keep you in a trend going against you, and like all good trend following it adheres to the principles of cutting your losses and letting your winners run so long as the trend is intact. It's the top 1-5% of your trades that account for 80-90% of your profits, as fat tail moves happen more often in markets than a normal distribution would suggest and that's why trend following albeit difficult to practice, will always work.
With stocks and ETFs, we recommend sticking to long only as shorting stocks is very difficult no matter the strategy or indicator used. If you're an investor you can use Trend Candles on the daily or weekly charts to help keep you in good stocks and industries and avoid holding onto perpetual losers.
As always indicators should be used as part of a trading strategy to assist in making decisions, instead of just blindly following every signal they produce you should always seek to compliment technical trading signals with additional analysis to reduce your risk and increase your odds of making a winning trade.
Examples Of Trend Candles On Various Markets and Timeframes
FOREX - EURJPY (5 Minute Chart)
CRYPTOCURRENCY - ETHUSD (30 Minute Chart)
STOCKS - TSLA (Daily Chart)
COMMODITIES - GOLD (Daily Chart)

To gain access to Trend Candles today visit our website shown below.
Happy Trend Following :)
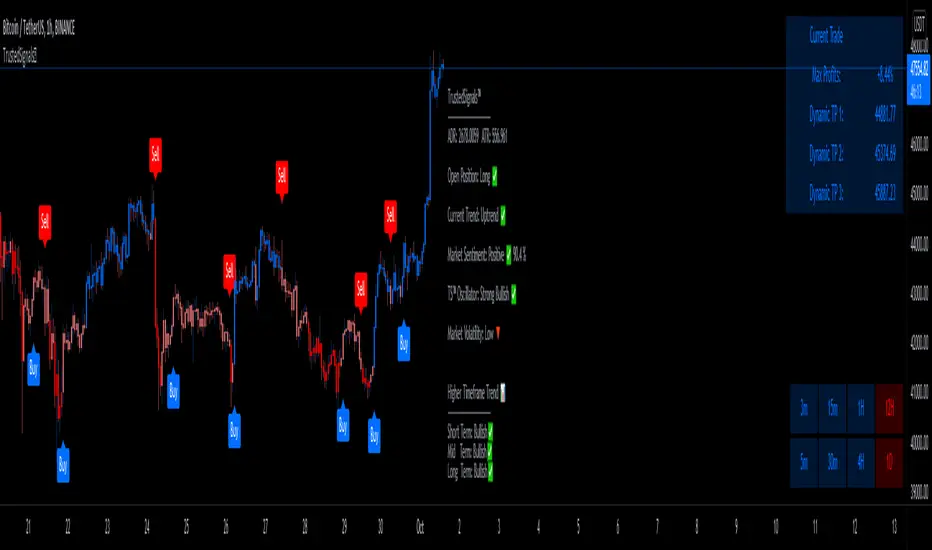
TrustedSignals™TrustedSignals Indicator includes standard Buy and Sell signals on the chart, Support & Resistance lines, Auto-Trendlines, AutoFibs and an All-in-One Market Dashboard.
(All these signals can be set up as Live Alerts directly in Tradingview)
The 2 main Input options for this algorithm are ' Reactivity ' and ' Depth '. By default, the indicator is added to your chart with the best settings we've found so far.
-The ' Reactivity ' controls how quickly the algorithm reacts to trend changes. The higher the reactivity, the fewer trades on the chart. If the Reactivity input is low, the algorithm will react more quickly, and show more frequent trades.
-The ' Depth ' controls the position of the signals relative to the trend swing. A lower Depth will allow for more frequent and earlier entries, while a higher Depth will give slower entries.
Our third (secondary) input is ' Trend Length ' (the Lookback of the ' Current Trend ' indicator). TrustedSignals™ is coloring the candles based on the current trend direction. The blue color shows an uptrend, while the red color shows a downtrend. Buy and Sell signals alerted while the current trend is showing pink (Sideways Market) should be taken carefully, as the market direction is not decided.
Since we believe in the idea of an ' All-in-One ' Indicator, we have included 3 more extremely useful and powerful trading tools.
-The first optional feature is the ' Support and Resistance ' lines. This feature can be activated to draw the key levels of Support and Resistance, easing your decision making and reinforcing the entry signals. Those levels can also be used as Stop Loss or Take Profit
-The second optional feature is the ' Auto-Trendlines '. This part of our amazing indicator automatically draws Trendlines based on the Lookback period the user inputs.
-The last and most important optional feature is the ' AutoFibs '. TrustedSignals™ will automatically draw Fibonacci Retracement levels from trend swing key points. (the lookback length can be adjusted by the user)
- Market Dashboard -
Within one simple panel on your chart, our Dashboard displays the most relevant data from all of our features in real-time.
Current Trend
(The bar color) is an indicator based on Murrey Math's lines. These lines are based on the idea that according to Gann, price moves in 1/8's that act as points of support and resistance. Given this 1/8 characteristic of price action, we assigned properties to each of the lines in a given octave, obtaining a perfect Trend Indicator shown by the candle color, ranging from red to orange to blue.
Market Sentiment
Market Sentiment is a zero lag, 'noise-free', custom improved version of the old 'Relative Strength Indicator ( RSI )' It measures trend velocity and momentum, while it charts the current and historical strength or weakness of the market. It is a much more accurate and vastly superior than the usual RSI.
Trusted Sginals Oscillator
TS Oscillator is our own branded indicator used to measure market momentum and determines whether bullish or bearish trend dominates the market. It measures the market momentum, with the aim to detect potential trend direction. Helping you to identify if the price is high or low in comparison to the recent price behavior.
Outputs: "Strong Bearish ", "Weak Bearish", "Strong Bullish ", "Weak Bullish"
Higher Timeframe Trend is a trend indicator based on our own non-repainting calculation of higher timeframe trend. It is based on a custom method that builds synthetic support and resistance lines from higher time, without repainting, while keeping the output extremely accurate.
Use the link below to obtain access to this indicator