Adaptive Vol Gauge [ParadoxAlgo]This is an overlay tool that measures and shows market ups and downs (volatility) based on daily high and low prices. It adjusts automatically to recent price changes and highlights calm or wild market periods. It colors the chart background and bars in shades of blue to cyan, with optional small labels for changes in market mood. Use it for info only—combine with your own analysis and risk controls. It's not a buy/sell signal or promise of results.Key FeaturesSmart Volatility Measure: Tracks price swings with a flexible time window that reacts to market speed.
Market Mood Detection: Spots high-energy (wild) or low-energy (calm) phases to help see shifts.
Visual Style: Uses smooth color fades on the background and bars—cyan for calm, deep blue for wild—to blend nicely on your chart.
Custom Options: Change settings like time periods, sensitivity, colors, and labels.
Chart Fit: Sits right on your main price chart without extra lines, keeping things clean.
How It WorksThe tool figures out volatility like this:Adjustment Factor:Looks at recent price ranges compared to longer ones.
Tweaks the time window (between 10-50 bars) based on how fast prices are moving.
Volatility Calc:Adds up logs of high/low ranges over the adjusted window.
Takes the square root for the final value.
Can scale it to yearly terms for easy comparison across chart timeframes.
Mood Check:Compares current volatility to its recent average and spread.
Flags "high" if above your set level, "low" if below.
Neutral in between.
This setup makes it quicker in busy markets and steadier in quiet ones.Settings You Can ChangeAdjust in the tool's menu:Base Time Window (default: 20): Starting point for calculations. Bigger numbers smooth things out but might miss quick changes.
Adjustment Strength (default: 0.5): How much it reacts to price speed. Low = steady; high = quick changes.
Yearly Scaling (default: on): Makes values comparable across short or long charts. Turn off for raw numbers.
Mood Sensitivity (default: 1.0): How strict for calling high/low moods. Low = more shifts; high = only big ones.
Show Labels (default: on): Adds tiny "High Vol" or "Low Vol" tags when moods change. They point up or down from bars.
Background Fade (default: 80): How see-through the color fill is (0 = invisible, 100 = solid).
Bar Fade (default: 50): How much color blends into your candles or bars (0 = none, 100 = full).
How to Read and Use ItColor Shifts:Background and bars fade based on mood strength:Cyan shades mean calm markets (good for steady, back-and-forth trades).
Deep blue shades mean wild markets (watch for big moves or turns).
Smooth changes show volatility building or easing.
Labels:"High Vol" (deep blue, from below bar): Start of wild phase.
"Low Vol" (cyan, from above bar): Start of calm phase.
Only shows at changes to avoid clutter. Use for timing strategy tweaks.
Trading Ideas:Mood-Based Plays: In wild phases (deep blue), try chase-momentum or breakout trades since swings are bigger. In calm phases (cyan), stick to bounce-back or range trades.
Risk Tips: Cut trade sizes in wild times to handle bigger losses. Use calm times for longer holds with close stops.
Chart Time Tips: Turn on yearly scaling for matching short and long views. Test settings on past data—loosen for quick trades (more alerts), tighten for longer ones (fewer, stronger).
Mix with Others: Add trend lines or averages—buy in calm up-moves, sell in wild down-moves. Check with volume or key levels too.
Special Cases: In big news events, it reacts faster. On slow assets, it might overstate swings—ease the adjustment strength.
Limits and TipsIt looks back at past data, so it trails real-time action and can't predict ahead.
Results differ by stock or timeframe—test on history first.
Colors and tags are just visuals; set your own alerts if needed.
Follows TradingView rules: No win promises, for learning only. Open for sharing; share thoughts in forums.
With this, you can spot market energy and tweak your trades smarter. Start on practice charts.
Trendpattern

TradeScope: MA Reversion • RVOL • Trendlines • GAPs • TableTradeScope is an all-in-one technical analysis suite that brings together price action, momentum, volume dynamics, and trend structure into one cohesive and fully customizable indicator.
An advanced, modular trading suite that combines moving averages, reversion signals, RSI/CCI momentum, relative volume, gap detection, trendline analysis, and dynamic tables — all within one powerful dashboard.
Perfect for swing traders, intraday traders, and analysts who want to read price strength, volume context, and market structure in real time.
⚙️ Core Components & Inputs
🧮 Moving Average Settings
Moving Average Type & Length:
Choose between SMA or EMA and set your preferred period for smoother or more reactive trend tracking.
Multi-MA Plotting:
Up to 8 customizable moving averages (each with independent type, color, and length).
Includes a “window filter” to show only the last X bars, reducing chart clutter.
MA Reversion Engine:
Detects when price has extended too far from its moving average.
Reversion Lookback: Number of bars analyzed to determine historical extremes.
Reversion Threshold: Sensitivity multiplier—lower = more frequent signals, higher = stricter triggers.
🔄 Trend Settings
Short-Term & Long-Term Trend Lookbacks:
Uses linear regression to detect the slope and direction of the short- and long-term trend.
Results are displayed in the live table with color-coded bias:
🟩 Bullish | 🟥 Bearish
📈 Momentum Indicators
RSI (Relative Strength Index):
Adjustable period; displays the current RSI value, overbought (>70) / oversold (<30) zones, and trending direction.
CCI (Commodity Channel Index):
Customizable length with color-coded bias:
🟩 Oversold (< -100), 🟥 Overbought (> 100).
Tooltip shows whether the CCI is trending up or down.
📊 Volume Analysis
Relative Volume (RVOL):
Estimates end-of-day projected volume using intraday progress and compares it against the 20-day average.
Displays whether today’s volume is expected to exceed yesterday’s, and highlights color by strength.
Volume Trend (Short & Long Lookbacks):
Visual cues for whether current volume is above or below short-term and long-term averages.
Estimated Full-Day Volume & Multiplier:
Converts raw volume into “X” multiples (e.g., 2.3X average) for quick interpretation.
🕳️ Gap Detection
Automatically identifies and plots bullish and bearish price gaps within a defined lookback period.
Gap Lookback: Defines how far back to search for gaps.
Gap Line Width / Visibility: Controls the thickness and display of gap lines on chart.
Displays the closest open gap in the live table, including its distance from current price (%).
🔍 ATR & Volatility
14-day ATR (% of price):
Automatically converts the Average True Range into a percent, providing quick volatility context:
🟩 Low (<3%) | 🟨 Moderate (3–5%) | 🟥 High (>5%)
💬 Candlestick Pattern Recognition
Auto-detects popular reversal and continuation patterns such as:
Bullish/Bearish Engulfing
Hammer / Hanging Man
Shooting Star / Inverted Hammer
Doji / Harami / Kicking / Marubozu / Morning Star
Each pattern is shown with contextual color coding in the table.
🧱 Pivot Points & Support/Resistance
Optional Pivot High / Pivot Low Labels
Adjustable left/right bar lengths for pivot detection
Theme-aware text and label color options
Automatically drawn diagonal trendlines for both support and resistance
Adjustable line style, color, and thickness
Detects and tracks touches for reliability
Includes breakout alerts (with optional volume confirmation)
🚨 Alerts
MA Cross Alerts:
Triggers when price crosses the fast or slow moving average within a tolerance band (default ±0.3%).
Diagonal Breakout Alerts:
Detects and alerts when price breaks diagonal trendlines.
Volume-Confirmed Alerts:
Filters breakouts where volume exceeds 1.5× the 20-bar average.
🧾 Live Market Table
A fully dynamic table displayed on-chart, customizable via input toggles:
Choose which rows to show (e.g., RSI, ATR, RVOL, Gaps, CCI, Trend, MA info, Diff, Low→Close%).
Choose table position (top-right, bottom-left, etc.) and text size.
Theme selection: Light or Dark
Conditional background colors for instant visual interpretation:
🟩 Bullish or Oversold
🟥 Bearish or Overbought
🟨 Neutral / Moderate
🎯 Practical Uses
✅ Identify confluence setups combining MA reversion, volume expansion, and RSI/CCI extremes.
✅ Track trend bias and gap proximity directly in your dashboard.
✅ Monitor relative volume behavior for intraday strength confirmation.
✅ Automate MA cross or breakout alerts to stay ahead of key price action.
🧠 Ideal For
Swing traders seeking confluence-based setups
Intraday traders monitoring multi-factor bias
Analysts looking for compact market health dashboards
💡 Summary
TradeScope is designed as a single-pane-of-glass market view — combining momentum, trend, volume, structure, and reversion into one clear visual system.
Fully customizable. Fully dynamic.
Use it to see what others miss — clarity, confluence, and confidence in every trade.

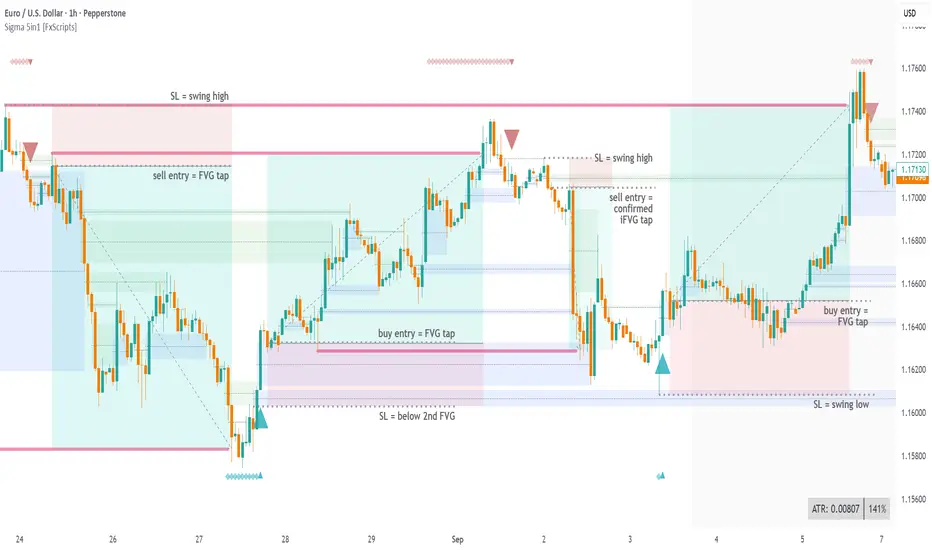
Sigma Reversal Print [FxScripts]Indicator Overview
The Sigma Reversal Print is a powerful tool designed for traders who like to trade reversal strategies plus trend traders looking to enter on strong pullbacks. It integrates advanced price action with volume analysis, highlighting areas where a trend reversal or pullback may be in progress, providing insights into where markets may be exhausted or about to surge.
Key Features and Functionality
Reversal Trading: Tailored primarily for reversal traders, the Sigma Reversal Print highlights zones where the market is likely to change direction. While this approach offers significant potential, it inherently carries a degree of risk due to the precision required in predicting market turning points. The Sigma Reversal Print uses advanced methodology to forecast such reversals with a high degree of accuracy.
Signal Generation Based on Reversal and Pullback Zones: The Reversal Print generates signals when price enters specific conditions, representing exhaustion followed by a change in order flow. These conditions allow the indicator to filter out low-probability signals and focus on those with higher potential for a trend change.
Settings
Sensitivity Control: The sensitivity setting allows traders to adjust the strength of the pattern required for a signal to be generated. The scale ranges from 2-10 with higher sensitivity demanding more confirmation, leading to fewer, generally more reliable, signals however backtesting is highly recommended. Adjusting the sensitivity enables traders to balance early entries with signal accuracy, accommodating both aggressive and more conservative strategies.
Customizable Length: The length setting allows users to fine-tune the calculation period, adjusting the indicator’s responsiveness to overall market conditions. Adjusting length allows the Reversal Print to adapt to the user’s trading style and timeframe of choice. Similar to the sensitivity control, the scale ranges from 2-10 with a higher length demanding more confirmation. This can lead to fewer, often more reliable, signals however, once again, backtesting is highly recommended.
Advanced Filters
Opening Gap Filter: Turning this on allows the system to avoid painting false signals that can be triggered by the daily or weekly opening gap at market open. This setting is toggled on by default.
Price Filter: This filter applies an additional weighted price action algorithm to the signal being painted thus further filtering out weaker signals. Warning dots will still paint however the larger break arrow will no longer paint if the filter is triggered. This setting is toggled on by default.
Volume Filter: This filters out low volume entries which have a lower probability of turning into successful trades. Variable from 1-10 with 1 being the most lenient and 10 the most stringent. Warning dots will still paint however the larger break arrow will no longer paint if the filter is triggered. This setting is toggled on by default.
Alerts
Configure alerts and receive notifications when the first warning dot in a sequence appears (the series of dots seen on the chart) and again when a breakpoint is triggered (the larger arrow on the chart). This feature is particularly beneficial for traders who like to monitor multiple instruments or prefer not to stare at a screen all day.
Performance and Optimization
Backtesting Results: The Reversal Print has undergone extensive backtesting across various instruments, timeframes and market conditions, demonstrating strong performance in identifying reversal points, particularly during volatile or overextended price movements. User backtesting is strongly encouraged as it allows traders to optimize settings for their preferred instruments and timeframes.
Optimization for Diverse Markets: The Reversal Print can be used on crypto, forex, indices, commodities or stocks. The Reversal Print's algorithmic foundation ensures consistent performance across a variety of instruments. Key settings such as Sensitivity and Length will require adjustment based on the volatility and characteristics of each market.
Educational Resources and Support
Users of the Sigma Reversal Print benefit from comprehensive educational resources and full access to FxScripts Support. This ensures traders can maximize the potential of the Reversal Print and other tools in the Sigma Indicator Suite by learning best practices and gaining insights from an experienced team of traders.
Summary
The Reversal Print is a powerful and adaptable tool for reversal and pullback traders, combining statistical analysis and price action to identify high-probability turning points. Its advanced customization options, flexible controls and integration with the Sigma Indicator Suite offer significant advantages over standard indicators. By pinpointing precise entry points, the Reversal Print enables traders to make informed trading decisions with confidence.
ATAI Volume analysis with price action V 1.00ATAI Volume Analysis with Price Action
1. Introduction
1.1 Overview
ATAI Volume Analysis with Price Action is a composite indicator designed for TradingView. It combines per‑side volume data —that is, how much buying and selling occurs during each bar—with standard price‑structure elements such as swings, trend lines and support/resistance. By blending these elements the script aims to help a trader understand which side is in control, whether a breakout is genuine, when markets are potentially exhausted and where liquidity providers might be active.
The indicator is built around TradingView’s up/down volume feed accessed via the TradingView/ta/10 library. The following excerpt from the script illustrates how this feed is configured:
import TradingView/ta/10 as tvta
// Determine lower timeframe string based on user choice and chart resolution
string lower_tf_breakout = use_custom_tf_input ? custom_tf_input :
timeframe.isseconds ? "1S" :
timeframe.isintraday ? "1" :
timeframe.isdaily ? "5" : "60"
// Request up/down volume (both positive)
= tvta.requestUpAndDownVolume(lower_tf_breakout)
Lower‑timeframe selection. If you do not specify a custom lower timeframe, the script chooses a default based on your chart resolution: 1 second for second charts, 1 minute for intraday charts, 5 minutes for daily charts and 60 minutes for anything longer. Smaller intervals provide a more precise view of buyer and seller flow but cover fewer bars. Larger intervals cover more history at the cost of granularity.
Tick vs. time bars. Many trading platforms offer a tick / intrabar calculation mode that updates an indicator on every trade rather than only on bar close. Turning on one‑tick calculation will give the most accurate split between buy and sell volume on the current bar, but it typically reduces the amount of historical data available. For the highest fidelity in live trading you can enable this mode; for studying longer histories you might prefer to disable it. When volume data is completely unavailable (some instruments and crypto pairs), all modules that rely on it will remain silent and only the price‑structure backbone will operate.
Figure caption, Each panel shows the indicator’s info table for a different volume sampling interval. In the left chart, the parentheses “(5)” beside the buy‑volume figure denote that the script is aggregating volume over five‑minute bars; the center chart uses “(1)” for one‑minute bars; and the right chart uses “(1T)” for a one‑tick interval. These notations tell you which lower timeframe is driving the volume calculations. Shorter intervals such as 1 minute or 1 tick provide finer detail on buyer and seller flow, but they cover fewer bars; longer intervals like five‑minute bars smooth the data and give more history.
Figure caption, The values in parentheses inside the info table come directly from the Breakout — Settings. The first row shows the custom lower-timeframe used for volume calculations (e.g., “(1)”, “(5)”, or “(1T)”)
2. Price‑Structure Backbone
Even without volume, the indicator draws structural features that underpin all other modules. These features are always on and serve as the reference levels for subsequent calculations.
2.1 What it draws
• Pivots: Swing highs and lows are detected using the pivot_left_input and pivot_right_input settings. A pivot high is identified when the high recorded pivot_right_input bars ago exceeds the highs of the preceding pivot_left_input bars and is also higher than (or equal to) the highs of the subsequent pivot_right_input bars; pivot lows follow the inverse logic. The indicator retains only a fixed number of such pivot points per side, as defined by point_count_input, discarding the oldest ones when the limit is exceeded.
• Trend lines: For each side, the indicator connects the earliest stored pivot and the most recent pivot (oldest high to newest high, and oldest low to newest low). When a new pivot is added or an old one drops out of the lookback window, the line’s endpoints—and therefore its slope—are recalculated accordingly.
• Horizontal support/resistance: The highest high and lowest low within the lookback window defined by length_input are plotted as horizontal dashed lines. These serve as short‑term support and resistance levels.
• Ranked labels: If showPivotLabels is enabled the indicator prints labels such as “HH1”, “HH2”, “LL1” and “LL2” near each pivot. The ranking is determined by comparing the price of each stored pivot: HH1 is the highest high, HH2 is the second highest, and so on; LL1 is the lowest low, LL2 is the second lowest. In the case of equal prices the newer pivot gets the better rank. Labels are offset from price using ½ × ATR × label_atr_multiplier, with the ATR length defined by label_atr_len_input. A dotted connector links each label to the candle’s wick.
2.2 Key settings
• length_input: Window length for finding the highest and lowest values and for determining trend line endpoints. A larger value considers more history and will generate longer trend lines and S/R levels.
• pivot_left_input, pivot_right_input: Strictness of swing confirmation. Higher values require more bars on either side to form a pivot; lower values create more pivots but may include minor swings.
• point_count_input: How many pivots are kept in memory on each side. When new pivots exceed this number the oldest ones are discarded.
• label_atr_len_input and label_atr_multiplier: Determine how far pivot labels are offset from the bar using ATR. Increasing the multiplier moves labels further away from price.
• Styling inputs for trend lines, horizontal lines and labels (color, width and line style).
Figure caption, The chart illustrates how the indicator’s price‑structure backbone operates. In this daily example, the script scans for bars where the high (or low) pivot_right_input bars back is higher (or lower) than the preceding pivot_left_input bars and higher or lower than the subsequent pivot_right_input bars; only those bars are marked as pivots.
These pivot points are stored and ranked: the highest high is labelled “HH1”, the second‑highest “HH2”, and so on, while lows are marked “LL1”, “LL2”, etc. Each label is offset from the price by half of an ATR‑based distance to keep the chart clear, and a dotted connector links the label to the actual candle.
The red diagonal line connects the earliest and latest stored high pivots, and the green line does the same for low pivots; when a new pivot is added or an old one drops out of the lookback window, the end‑points and slopes adjust accordingly. Dashed horizontal lines mark the highest high and lowest low within the current lookback window, providing visual support and resistance levels. Together, these elements form the structural backbone that other modules reference, even when volume data is unavailable.
3. Breakout Module
3.1 Concept
This module confirms that a price break beyond a recent high or low is supported by a genuine shift in buying or selling pressure. It requires price to clear the highest high (“HH1”) or lowest low (“LL1”) and, simultaneously, that the winning side shows a significant volume spike, dominance and ranking. Only when all volume and price conditions pass is a breakout labelled.
3.2 Inputs
• lookback_break_input : This controls the number of bars used to compute moving averages and percentiles for volume. A larger value smooths the averages and percentiles but makes the indicator respond more slowly.
• vol_mult_input : The “spike” multiplier; the current buy or sell volume must be at least this multiple of its moving average over the lookback window to qualify as a breakout.
• rank_threshold_input (0–100) : Defines a volume percentile cutoff: the current buyer/seller volume must be in the top (100−threshold)%(100−threshold)% of all volumes within the lookback window. For example, if set to 80, the current volume must be in the top 20 % of the lookback distribution.
• ratio_threshold_input (0–1) : Specifies the minimum share of total volume that the buyer (for a bullish breakout) or seller (for bearish) must hold on the current bar; the code also requires that the cumulative buyer volume over the lookback window exceeds the seller volume (and vice versa for bearish cases).
• use_custom_tf_input / custom_tf_input : When enabled, these inputs override the automatic choice of lower timeframe for up/down volume; otherwise the script selects a sensible default based on the chart’s timeframe.
• Label appearance settings : Separate options control the ATR-based offset length, offset multiplier, label size and colors for bullish and bearish breakout labels, as well as the connector style and width.
3.3 Detection logic
1. Data preparation : Retrieve per‑side volume from the lower timeframe and take absolute values. Build rolling arrays of the last lookback_break_input values to compute simple moving averages (SMAs), cumulative sums and percentile ranks for buy and sell volume.
2. Volume spike: A spike is flagged when the current buy (or, in the bearish case, sell) volume is at least vol_mult_input times its SMA over the lookback window.
3. Dominance test: The buyer’s (or seller’s) share of total volume on the current bar must meet or exceed ratio_threshold_input. In addition, the cumulative sum of buyer volume over the window must exceed the cumulative sum of seller volume for a bullish breakout (and vice versa for bearish). A separate requirement checks the sign of delta: for bullish breakouts delta_breakout must be non‑negative; for bearish breakouts it must be non‑positive.
4. Percentile rank: The current volume must fall within the top (100 – rank_threshold_input) percent of the lookback distribution—ensuring that the spike is unusually large relative to recent history.
5. Price test: For a bullish signal, the closing price must close above the highest pivot (HH1); for a bearish signal, the close must be below the lowest pivot (LL1).
6. Labeling: When all conditions above are satisfied, the indicator prints “Breakout ↑” above the bar (bullish) or “Breakout ↓” below the bar (bearish). Labels are offset using half of an ATR‑based distance and linked to the candle with a dotted connector.
Figure caption, (Breakout ↑ example) , On this daily chart, price pushes above the red trendline and the highest prior pivot (HH1). The indicator recognizes this as a valid breakout because the buyer‑side volume on the lower timeframe spikes above its recent moving average and buyers dominate the volume statistics over the lookback period; when combined with a close above HH1, this satisfies the breakout conditions. The “Breakout ↑” label appears above the candle, and the info table highlights that up‑volume is elevated relative to its 11‑bar average, buyer share exceeds the dominance threshold and money‑flow metrics support the move.
Figure caption, In this daily example, price breaks below the lowest pivot (LL1) and the lower green trendline. The indicator identifies this as a bearish breakout because sell‑side volume is sharply elevated—about twice its 11‑bar average—and sellers dominate both the bar and the lookback window. With the close falling below LL1, the script triggers a Breakout ↓ label and marks the corresponding row in the info table, which shows strong down volume, negative delta and a seller share comfortably above the dominance threshold.
4. Market Phase Module (Volume Only)
4.1 Concept
Not all markets trend; many cycle between periods of accumulation (buying pressure building up), distribution (selling pressure dominating) and neutral behavior. This module classifies the current bar into one of these phases without using ATR , relying solely on buyer and seller volume statistics. It looks at net flows, ratio changes and an OBV‑like cumulative line with dual‑reference (1‑ and 2‑bar) trends. The result is displayed both as on‑chart labels and in a dedicated row of the info table.
4.2 Inputs
• phase_period_len: Number of bars over which to compute sums and ratios for phase detection.
• phase_ratio_thresh : Minimum buyer share (for accumulation) or minimum seller share (for distribution, derived as 1 − phase_ratio_thresh) of the total volume.
• strict_mode: When enabled, both the 1‑bar and 2‑bar changes in each statistic must agree on the direction (strict confirmation); when disabled, only one of the two references needs to agree (looser confirmation).
• Color customisation for info table cells and label styling for accumulation and distribution phases, including ATR length, multiplier, label size, colors and connector styles.
• show_phase_module: Toggles the entire phase detection subsystem.
• show_phase_labels: Controls whether on‑chart labels are drawn when accumulation or distribution is detected.
4.3 Detection logic
The module computes three families of statistics over the volume window defined by phase_period_len:
1. Net sum (buyers minus sellers): net_sum_phase = Σ(buy) − Σ(sell). A positive value indicates a predominance of buyers. The code also computes the differences between the current value and the values 1 and 2 bars ago (d_net_1, d_net_2) to derive up/down trends.
2. Buyer ratio: The instantaneous ratio TF_buy_breakout / TF_tot_breakout and the window ratio Σ(buy) / Σ(total). The current ratio must exceed phase_ratio_thresh for accumulation or fall below 1 − phase_ratio_thresh for distribution. The first and second differences of the window ratio (d_ratio_1, d_ratio_2) determine trend direction.
3. OBV‑like cumulative net flow: An on‑balance volume analogue obv_net_phase increments by TF_buy_breakout − TF_sell_breakout each bar. Its differences over the last 1 and 2 bars (d_obv_1, d_obv_2) provide trend clues.
The algorithm then combines these signals:
• For strict mode , accumulation requires: (a) current ratio ≥ threshold, (b) cumulative ratio ≥ threshold, (c) both ratio differences ≥ 0, (d) net sum differences ≥ 0, and (e) OBV differences ≥ 0. Distribution is the mirror case.
• For loose mode , it relaxes the directional tests: either the 1‑ or the 2‑bar difference needs to agree in each category.
If all conditions for accumulation are satisfied, the phase is labelled “Accumulation” ; if all conditions for distribution are satisfied, it’s labelled “Distribution” ; otherwise the phase is “Neutral” .
4.4 Outputs
• Info table row : Row 8 displays “Market Phase (Vol)” on the left and the detected phase (Accumulation, Distribution or Neutral) on the right. The text colour of both cells matches a user‑selectable palette (typically green for accumulation, red for distribution and grey for neutral).
• On‑chart labels : When show_phase_labels is enabled and a phase persists for at least one bar, the module prints a label above the bar ( “Accum” ) or below the bar ( “Dist” ) with a dashed or dotted connector. The label is offset using ATR based on phase_label_atr_len_input and phase_label_multiplier and is styled according to user preferences.
Figure caption, The chart displays a red “Dist” label above a particular bar, indicating that the accumulation/distribution module identified a distribution phase at that point. The detection is based on seller dominance: during that bar, the net buyer-minus-seller flow and the OBV‑style cumulative flow were trending down, and the buyer ratio had dropped below the preset threshold. These conditions satisfy the distribution criteria in strict mode. The label is placed above the bar using an ATR‑based offset and a dashed connector. By the time of the current bar in the screenshot, the phase indicator shows “Neutral” in the info table—signaling that neither accumulation nor distribution conditions are currently met—yet the historical “Dist” label remains to mark where the prior distribution phase began.
Figure caption, In this example the market phase module has signaled an Accumulation phase. Three bars before the current candle, the algorithm detected a shift toward buyers: up‑volume exceeded its moving average, down‑volume was below average, and the buyer share of total volume climbed above the threshold while the on‑balance net flow and cumulative ratios were trending upwards. The blue “Accum” label anchored below that bar marks the start of the phase; it remains on the chart because successive bars continue to satisfy the accumulation conditions. The info table confirms this: the “Market Phase (Vol)” row still reads Accumulation, and the ratio and sum rows show buyers dominating both on the current bar and across the lookback window.
5. OB/OS Spike Module
5.1 What overbought/oversold means here
In many markets, a rapid extension up or down is often followed by a period of consolidation or reversal. The indicator interprets overbought (OB) conditions as abnormally strong selling risk at or after a price rally and oversold (OS) conditions as unusually strong buying risk after a decline. Importantly, these are not direct trade signals; rather they flag areas where caution or contrarian setups may be appropriate.
5.2 Inputs
• minHits_obos (1–7): Minimum number of oscillators that must agree on an overbought or oversold condition for a label to print.
• syncWin_obos: Length of a small sliding window over which oscillator votes are smoothed by taking the maximum count observed. This helps filter out choppy signals.
• Volume spike criteria: kVolRatio_obos (ratio of current volume to its SMA) and zVolThr_obos (Z‑score threshold) across volLen_obos. Either threshold can trigger a spike.
• Oscillator toggles and periods: Each of RSI, Stochastic (K and D), Williams %R, CCI, MFI, DeMarker and Stochastic RSI can be independently enabled; their periods are adjustable.
• Label appearance: ATR‑based offset, size, colors for OB and OS labels, plus connector style and width.
5.3 Detection logic
1. Directional volume spikes: Volume spikes are computed separately for buyer and seller volumes. A sell volume spike (sellVolSpike) flags a potential OverBought bar, while a buy volume spike (buyVolSpike) flags a potential OverSold bar. A spike occurs when the respective volume exceeds kVolRatio_obos times its simple moving average over the window or when its Z‑score exceeds zVolThr_obos.
2. Oscillator votes: For each enabled oscillator, calculate its overbought and oversold state using standard thresholds (e.g., RSI ≥ 70 for OB and ≤ 30 for OS; Stochastic %K/%D ≥ 80 for OB and ≤ 20 for OS; etc.). Count how many oscillators vote for OB and how many vote for OS.
3. Minimum hits: Apply the smoothing window syncWin_obos to the vote counts using a maximum‑of‑last‑N approach. A candidate bar is only considered if the smoothed OB hit count ≥ minHits_obos (for OverBought) or the smoothed OS hit count ≥ minHits_obos (for OverSold).
4. Tie‑breaking: If both OverBought and OverSold spike conditions are present on the same bar, compare the smoothed hit counts: the side with the higher count is selected; ties default to OverBought.
5. Label printing: When conditions are met, the bar is labelled as “OverBought X/7” above the candle or “OverSold X/7” below it. “X” is the number of oscillators confirming, and the bracket lists the abbreviations of contributing oscillators. Labels are offset from price using half of an ATR‑scaled distance and can optionally include a dotted or dashed connector line.
Figure caption, In this chart the overbought/oversold module has flagged an OverSold signal. A sell‑off from the prior highs brought price down to the lower trend‑line, where the bar marked “OverSold 3/7 DeM” appears. This label indicates that on that bar the module detected a buy‑side volume spike and that at least three of the seven enabled oscillators—in this case including the DeMarker—were in oversold territory. The label is printed below the candle with a dotted connector, signaling that the market may be temporarily exhausted on the downside. After this oversold print, price begins to rebound towards the upper red trend‑line and higher pivot levels.
Figure caption, This example shows the overbought/oversold module in action. In the left‑hand panel you can see the OB/OS settings where each oscillator (RSI, Stochastic, Williams %R, CCI, MFI, DeMarker and Stochastic RSI) can be enabled or disabled, and the ATR length and label offset multiplier adjusted. On the chart itself, price has pushed up to the descending red trendline and triggered an “OverBought 3/7” label. That means the sell‑side volume spiked relative to its average and three out of the seven enabled oscillators were in overbought territory. The label is offset above the candle by half of an ATR and connected with a dashed line, signaling that upside momentum may be overextended and a pause or pullback could follow.
6. Buyer/Seller Trap Module
6.1 Concept
A bull trap occurs when price appears to break above resistance, attracting buyers, but fails to sustain the move and quickly reverses, leaving a long upper wick and trapping late entrants. A bear trap is the opposite: price breaks below support, lures in sellers, then snaps back, leaving a long lower wick and trapping shorts. This module detects such traps by looking for price structure sweeps, order‑flow mismatches and dominance reversals. It uses a scoring system to differentiate risk from confirmed traps.
6.2 Inputs
• trap_lookback_len: Window length used to rank extremes and detect sweeps.
• trap_wick_threshold: Minimum proportion of a bar’s range that must be wick (upper for bull traps, lower for bear traps) to qualify as a sweep.
• trap_score_risk: Minimum aggregated score required to flag a trap risk. (The code defines a trap_score_confirm input, but confirmation is actually based on price reversal rather than a separate score threshold.)
• trap_confirm_bars: Maximum number of bars allowed for price to reverse and confirm the trap. If price does not reverse in this window, the risk label will expire or remain unconfirmed.
• Label settings: ATR length and multiplier for offsetting, size, colours for risk and confirmed labels, and connector style and width. Separate settings exist for bull and bear traps.
• Toggle inputs: show_trap_module and show_trap_labels enable the module and control whether labels are drawn on the chart.
6.3 Scoring logic
The module assigns points to several conditions and sums them to determine whether a trap risk is present. For bull traps, the score is built from the following (bear traps mirror the logic with highs and lows swapped):
1. Sweep (2 points): Price trades above the high pivot (HH1) but fails to close above it and leaves a long upper wick at least trap_wick_threshold × range. For bear traps, price dips below the low pivot (LL1), fails to close below and leaves a long lower wick.
2. Close break (1 point): Price closes beyond HH1 or LL1 without leaving a long wick.
3. Candle/delta mismatch (2 points): The candle closes bullish yet the order flow delta is negative or the seller ratio exceeds 50%, indicating hidden supply. Conversely, a bearish close with positive delta or buyer dominance suggests hidden demand.
4. Dominance inversion (2 points): The current bar’s buyer volume has the highest rank in the lookback window while cumulative sums favor sellers, or vice versa.
5. Low‑volume break (1 point): Price crosses the pivot but total volume is below its moving average.
The total score for each side is compared to trap_score_risk. If the score is high enough, a “Bull Trap Risk” or “Bear Trap Risk” label is drawn, offset from the candle by half of an ATR‑scaled distance using a dashed outline. If, within trap_confirm_bars, price reverses beyond the opposite level—drops back below the high pivot for bull traps or rises above the low pivot for bear traps—the label is upgraded to a solid “Bull Trap” or “Bear Trap” . In this version of the code, there is no separate score threshold for confirmation: the variable trap_score_confirm is unused; confirmation depends solely on a successful price reversal within the specified number of bars.
Figure caption, In this example the trap module has flagged a Bear Trap Risk. Price initially breaks below the most recent low pivot (LL1), but the bar closes back above that level and leaves a long lower wick, suggesting a failed push lower. Combined with a mismatch between the candle direction and the order flow (buyers regain control) and a reversal in volume dominance, the aggregate score exceeds the risk threshold, so a dashed “Bear Trap Risk” label prints beneath the bar. The green and red trend lines mark the current low and high pivot trajectories, while the horizontal dashed lines show the highest and lowest values in the lookback window. If, within the next few bars, price closes decisively above the support, the risk label would upgrade to a solid “Bear Trap” label.
Figure caption, In this example the trap module has identified both ends of a price range. Near the highs, price briefly pushes above the descending red trendline and the recent pivot high, but fails to close there and leaves a noticeable upper wick. That combination of a sweep above resistance and order‑flow mismatch generates a Bull Trap Risk label with a dashed outline, warning that the upside break may not hold. At the opposite extreme, price later dips below the green trendline and the labelled low pivot, then quickly snaps back and closes higher. The long lower wick and subsequent price reversal upgrade the previous bear‑trap risk into a confirmed Bear Trap (solid label), indicating that sellers were caught on a false breakdown. Horizontal dashed lines mark the highest high and lowest low of the lookback window, while the red and green diagonals connect the earliest and latest pivot highs and lows to visualize the range.
7. Sharp Move Module
7.1 Concept
Markets sometimes display absorption or climax behavior—periods when one side steadily gains the upper hand before price breaks out with a sharp move. This module evaluates several order‑flow and volume conditions to anticipate such moves. Users can choose how many conditions must be met to flag a risk and how many (plus a price break) are required for confirmation.
7.2 Inputs
• sharp Lookback: Number of bars in the window used to compute moving averages, sums, percentile ranks and reference levels.
• sharpPercentile: Minimum percentile rank for the current side’s volume; the current buy (or sell) volume must be greater than or equal to this percentile of historical volumes over the lookback window.
• sharpVolMult: Multiplier used in the volume climax check. The current side’s volume must exceed this multiple of its average to count as a climax.
• sharpRatioThr: Minimum dominance ratio (current side’s volume relative to the opposite side) used in both the instant and cumulative dominance checks.
• sharpChurnThr: Maximum ratio of a bar’s range to its ATR for absorption/churn detection; lower values indicate more absorption (large volume in a small range).
• sharpScoreRisk: Minimum number of conditions that must be true to print a risk label.
• sharpScoreConfirm: Minimum number of conditions plus a price break required for confirmation.
• sharpCvdThr: Threshold for cumulative delta divergence versus price change (positive for bullish accumulation, negative for bearish distribution).
• Label settings: ATR length (sharpATRlen) and multiplier (sharpLabelMult) for positioning labels, label size, colors and connector styles for bullish and bearish sharp moves.
• Toggles: enableSharp activates the module; show_sharp_labels controls whether labels are drawn.
7.3 Conditions (six per side)
For each side, the indicator computes six boolean conditions and sums them to form a score:
1. Dominance (instant and cumulative):
– Instant dominance: current buy volume ≥ sharpRatioThr × current sell volume.
– Cumulative dominance: sum of buy volumes over the window ≥ sharpRatioThr × sum of sell volumes (and vice versa for bearish checks).
2. Accumulation/Distribution divergence: Over the lookback window, cumulative delta rises by at least sharpCvdThr while price fails to rise (bullish), or cumulative delta falls by at least sharpCvdThr while price fails to fall (bearish).
3. Volume climax: The current side’s volume is ≥ sharpVolMult × its average and the product of volume and bar range is the highest in the lookback window.
4. Absorption/Churn: The current side’s volume divided by the bar’s range equals the highest value in the window and the bar’s range divided by ATR ≤ sharpChurnThr (indicating large volume within a small range).
5. Percentile rank: The current side’s volume percentile rank is ≥ sharp Percentile.
6. Mirror logic for sellers: The above checks are repeated with buyer and seller roles swapped and the price break levels reversed.
Each condition that passes contributes one point to the corresponding side’s score (0 or 1). Risk and confirmation thresholds are then applied to these scores.
7.4 Scoring and labels
• Risk: If scoreBull ≥ sharpScoreRisk, a “Sharp ↑ Risk” label is drawn above the bar. If scoreBear ≥ sharpScoreRisk, a “Sharp ↓ Risk” label is drawn below the bar.
• Confirmation: A risk label is upgraded to “Sharp ↑” when scoreBull ≥ sharpScoreConfirm and the bar closes above the highest recent pivot (HH1); for bearish cases, confirmation requires scoreBear ≥ sharpScoreConfirm and a close below the lowest pivot (LL1).
• Label positioning: Labels are offset from the candle by ATR × sharpLabelMult (full ATR times multiplier), not half, and may include a dashed or dotted connector line if enabled.
Figure caption, In this chart both bullish and bearish sharp‑move setups have been flagged. Earlier in the range, a “Sharp ↓ Risk” label appears beneath a candle: the sell‑side score met the risk threshold, signaling that the combination of strong sell volume, dominance and absorption within a narrow range suggested a potential sharp decline. The price did not close below the lower pivot, so this label remains a “risk” and no confirmation occurred. Later, as the market recovered and volume shifted back to the buy side, a “Sharp ↑ Risk” label prints above a candle near the top of the channel. Here, buy‑side dominance, cumulative delta divergence and a volume climax aligned, but price has not yet closed above the upper pivot (HH1), so the alert is still a risk rather than a confirmed sharp‑up move.
Figure caption, In this chart a Sharp ↑ label is displayed above a candle, indicating that the sharp move module has confirmed a bullish breakout. Prior bars satisfied the risk threshold — showing buy‑side dominance, positive cumulative delta divergence, a volume climax and strong absorption in a narrow range — and this candle closes above the highest recent pivot, upgrading the earlier “Sharp ↑ Risk” alert to a full Sharp ↑ signal. The green label is offset from the candle with a dashed connector, while the red and green trend lines trace the high and low pivot trajectories and the dashed horizontals mark the highest and lowest values of the lookback window.
8. Market‑Maker / Spread‑Capture Module
8.1 Concept
Liquidity providers often “capture the spread” by buying and selling in almost equal amounts within a very narrow price range. These bars can signal temporary congestion before a move or reflect algorithmic activity. This module flags bars where both buyer and seller volumes are high, the price range is only a few ticks and the buy/sell split remains close to 50%. It helps traders spot potential liquidity pockets.
8.2 Inputs
• scalpLookback: Window length used to compute volume averages.
• scalpVolMult: Multiplier applied to each side’s average volume; both buy and sell volumes must exceed this multiple.
• scalpTickCount: Maximum allowed number of ticks in a bar’s range (calculated as (high − low) / minTick). A value of 1 or 2 captures ultra‑small bars; increasing it relaxes the range requirement.
• scalpDeltaRatio: Maximum deviation from a perfect 50/50 split. For example, 0.05 means the buyer share must be between 45% and 55%.
• Label settings: ATR length, multiplier, size, colors, connector style and width.
• Toggles : show_scalp_module and show_scalp_labels to enable the module and its labels.
8.3 Signal
When, on the current bar, both TF_buy_breakout and TF_sell_breakout exceed scalpVolMult times their respective averages and (high − low)/minTick ≤ scalpTickCount and the buyer share is within scalpDeltaRatio of 50%, the module prints a “Spread ↔” label above the bar. The label uses the same ATR offset logic as other modules and draws a connector if enabled.
Figure caption, In this chart the spread‑capture module has identified a potential liquidity pocket. Buyer and seller volumes both spiked above their recent averages, yet the candle’s range measured only a couple of ticks and the buy/sell split stayed close to 50 %. This combination met the module’s criteria, so it printed a grey “Spread ↔” label above the bar. The red and green trend lines link the earliest and latest high and low pivots, and the dashed horizontals mark the highest high and lowest low within the current lookback window.
9. Money Flow Module
9.1 Concept
To translate volume into a monetary measure, this module multiplies each side’s volume by the closing price. It tracks buying and selling system money default currency on a per-bar basis and sums them over a chosen period. The difference between buy and sell currencies (Δ$) shows net inflow or outflow.
9.2 Inputs
• mf_period_len_mf: Number of bars used for summing buy and sell dollars.
• Label appearance settings: ATR length, multiplier, size, colors for up/down labels, and connector style and width.
• Toggles: Use enableMoneyFlowLabel_mf and showMFLabels to control whether the module and its labels are displayed.
9.3 Calculations
• Per-bar money: Buy $ = TF_buy_breakout × close; Sell $ = TF_sell_breakout × close. Their difference is Δ$ = Buy $ − Sell $.
• Summations: Over mf_period_len_mf bars, compute Σ Buy $, Σ Sell $ and ΣΔ$ using math.sum().
• Info table entries: Rows 9–13 display these values as texts like “↑ USD 1234 (1M)” or “ΣΔ USD −5678 (14)”, with colors reflecting whether buyers or sellers dominate.
• Money flow status: If Δ$ is positive the bar is marked “Money flow in” ; if negative, “Money flow out” ; if zero, “Neutral”. The cumulative status is similarly derived from ΣΔ.Labels print at the bar that changes the sign of ΣΔ, offset using ATR × label multiplier and styled per user preferences.
Figure caption, The chart illustrates a steady rise toward the highest recent pivot (HH1) with price riding between a rising green trend‑line and a red trend‑line drawn through earlier pivot highs. A green Money flow in label appears above the bar near the top of the channel, signaling that net dollar flow turned positive on this bar: buy‑side dollar volume exceeded sell‑side dollar volume, pushing the cumulative sum ΣΔ$ above zero. In the info table, the “Money flow (bar)” and “Money flow Σ” rows both read In, confirming that the indicator’s money‑flow module has detected an inflow at both bar and aggregate levels, while other modules (pivots, trend lines and support/resistance) remain active to provide structural context.
In this example the Money Flow module signals a net outflow. Price has been trending downward: successive high pivots form a falling red trend‑line and the low pivots form a descending green support line. When the latest bar broke below the previous low pivot (LL1), both the bar‑level and cumulative net dollar flow turned negative—selling volume at the close exceeded buying volume and pushed the cumulative Δ$ below zero. The module reacts by printing a red “Money flow out” label beneath the candle; the info table confirms that the “Money flow (bar)” and “Money flow Σ” rows both show Out, indicating sustained dominance of sellers in this period.
10. Info Table
10.1 Purpose
When enabled, the Info Table appears in the lower right of your chart. It summarises key values computed by the indicator—such as buy and sell volume, delta, total volume, breakout status, market phase, and money flow—so you can see at a glance which side is dominant and which signals are active.
10.2 Symbols
• ↑ / ↓ — Up (↑) denotes buy volume or money; down (↓) denotes sell volume or money.
• MA — Moving average. In the table it shows the average value of a series over the lookback period.
• Σ (Sigma) — Cumulative sum over the chosen lookback period.
• Δ (Delta) — Difference between buy and sell values.
• B / S — Buyer and seller share of total volume, expressed as percentages.
• Ref. Price — Reference price for breakout calculations, based on the latest pivot.
• Status — Indicates whether a breakout condition is currently active (True) or has failed.
10.3 Row definitions
1. Up volume / MA up volume – Displays current buy volume on the lower timeframe and its moving average over the lookback period.
2. Down volume / MA down volume – Shows current sell volume and its moving average; sell values are formatted in red for clarity.
3. Δ / ΣΔ – Lists the difference between buy and sell volume for the current bar and the cumulative delta volume over the lookback period.
4. Σ / MA Σ (Vol/MA) – Total volume (buy + sell) for the bar, with the ratio of this volume to its moving average; the right cell shows the average total volume.
5. B/S ratio – Buy and sell share of the total volume: current bar percentages and the average percentages across the lookback period.
6. Buyer Rank / Seller Rank – Ranks the bar’s buy and sell volumes among the last (n) bars; lower rank numbers indicate higher relative volume.
7. Σ Buy / Σ Sell – Sum of buy and sell volumes over the lookback window, indicating which side has traded more.
8. Breakout UP / DOWN – Shows the breakout thresholds (Ref. Price) and whether the breakout condition is active (True) or has failed.
9. Market Phase (Vol) – Reports the current volume‑only phase: Accumulation, Distribution or Neutral.
10. Money Flow – The final rows display dollar amounts and status:
– ↑ USD / Σ↑ USD – Buy dollars for the current bar and the cumulative sum over the money‑flow period.
– ↓ USD / Σ↓ USD – Sell dollars and their cumulative sum.
– Δ USD / ΣΔ USD – Net dollar difference (buy minus sell) for the bar and cumulatively.
– Money flow (bar) – Indicates whether the bar’s net dollar flow is positive (In), negative (Out) or neutral.
– Money flow Σ – Shows whether the cumulative net dollar flow across the chosen period is positive, negative or neutral.
The chart above shows a sequence of different signals from the indicator. A Bull Trap Risk appears after price briefly pushes above resistance but fails to hold, then a green Accum label identifies an accumulation phase. An upward breakout follows, confirmed by a Money flow in print. Later, a Sharp ↓ Risk warns of a possible sharp downturn; after price dips below support but quickly recovers, a Bear Trap label marks a false breakdown. The highlighted info table in the center summarizes key metrics at that moment, including current and average buy/sell volumes, net delta, total volume versus its moving average, breakout status (up and down), market phase (volume), and bar‑level and cumulative money flow (In/Out).
11. Conclusion & Final Remarks
This indicator was developed as a holistic study of market structure and order flow. It brings together several well‑known concepts from technical analysis—breakouts, accumulation and distribution phases, overbought and oversold extremes, bull and bear traps, sharp directional moves, market‑maker spread bars and money flow—into a single Pine Script tool. Each module is based on widely recognized trading ideas and was implemented after consulting reference materials and example strategies, so you can see in real time how these concepts interact on your chart.
A distinctive feature of this indicator is its reliance on per‑side volume: instead of tallying only total volume, it separately measures buy and sell transactions on a lower time frame. This approach gives a clearer view of who is in control—buyers or sellers—and helps filter breakouts, detect phases of accumulation or distribution, recognize potential traps, anticipate sharp moves and gauge whether liquidity providers are active. The money‑flow module extends this analysis by converting volume into currency values and tracking net inflow or outflow across a chosen window.
Although comprehensive, this indicator is intended solely as a guide. It highlights conditions and statistics that many traders find useful, but it does not generate trading signals or guarantee results. Ultimately, you remain responsible for your positions. Use the information presented here to inform your analysis, combine it with other tools and risk‑management techniques, and always make your own decisions when trading.

Liquidity Sweep Breakout - LSBLiquidity Sweep Breakout - LSB
A professional session-based breakout system designed for OANDA:USDJPY and other JPY pairs.
Not guesswork, but precision - built on detailed observation of institutional moves to capture clear trade direction daily.
Master the Market’s Daily Bank Flow.
---
Strategy Detail:
I discovered this strategy after carefully studying how Japanese banks influence the forex market during their daily settlement period. Banks are some of the biggest players in the financial world, and when they adjust or settle their accounts in the morning, it often creates a push in the market. From years of observation, I noticed a consistent pattern, once banks finish their settlements, the market usually continues moving in the same direction that was formed right after those actions. This daily banking flow often sets the tone for the entire trading session, especially for JPY pairs like USDJPY.
To capture this move, I built the indicator so that it follows the bank-driven trend with clear rules for entries, stop-loss (SL), and take-profit (TP). The system is designed with professional risk management in mind. By default, it assumes a $10,000 account size, risks only 1% of that balance per trade, and targets a 1:1.5 reward-to-risk ratio. This means for every $100 risked, the potential profit is $150. Such controlled risk makes the system safer and more sustainable for long-term traders. At the same time, users are not limited to this setup, they can adjust the account balance in the settings, and the indicator will automatically recalculate the lot size and risk levels based on their own capital. This ensures the strategy works for small accounts and larger accounts alike.
🌍 Why It Works
Fundamentally driven: Based on **daily Japanese banking settlement flows**.
Session-specific precision: Targets the exact window when USDJPY liquidity reshapes.
Risk-managed: Always calculates lot size based on account and risk preferences.
Automatable: With webhook + MT5 EA, it can be fully hands-free.
---
✅ Recommended
Pair: USDJPY (best observed behavior).
Timeframe: 3-Minute chart.
Platform: TradingView Premium (for webhooks).
Execution: MT5 via EA.
---
🔎 Strategy Concept
The Tokyo Magic Breakout (TMB) is built on years of session observation and the unique daily rhythm of the Japanese banking system.
Every morning between 5:50 AM – 6:10 AM PKT (09:50 – 10:10 JST), Japanese banks perform daily reconciliation and settlement. This often sets the tone for the USDJPY direction of the day.
This strategy isolates that critical moment of liquidity adjustment and waits for a clean breakout confirmation. Instead of chasing noise, it executes only when price action is aligned with the Tokyo market’s hidden flows.
---
🕒 Timing Logic
Session Start: 5:00 AM PKT (Tokyo market open range).
Magic Candle: The 5:54 AM PKT candle is marked as the reference “breakout selector.”
Checkpoints: First confirmation at 6:30 AM PKT, then every 15 minutes until 8:30 AM PKT.
* If price stays inside the magic range → wait.
* If a breakout happens but the candle wick touches the range → wait for the next checkpoint.
* If by 8:30 AM PKT no clean breakout occurs → the day is marked as No Trade Day (NTD).
👉 Recommended timeframe: 3-Minute chart (3M) for precise signals.
---
📈 Trade Execution
Entry: Clean break above/below the magic candle’s range.
Stop-Loss: Opposite side of the Tokyo session high/low.
Take-Profit: Calculated by Reward\:Risk ratio (default 1.5:1).
Lot Size: Auto-calculated based on your risk model:
* Fixed Dollar
* % of Equity
* Conservative (minimum of both).
Visuals include:
✅ Entry/SL/TP lines
✅ Shaded risk (red) and reward (green) zones
✅ Trade labels (Buy/Sell with lot size & levels)
✅ TP/SL hit markers
---
🔔 Alerts & Automation (AutoTMB)
This strategy is fully automation-ready with EA + MT5:
1. Enable alerts in TMB settings.
2. Insert your PineConnector License Key.
3. Configure your risk management preferences.
4. Create a TradingView alert → in the message box simply type:
Pine Script®
{{alert_message}}
and set the EA webhook.
Now, every breakout trade (with exact entry, SL, TP, and lot size) is sent instantly.
👉 On your MT5:
* Install the EA.
* Use the same license key.
* Run it on a VPS or local MT5 terminal.
You now have a hands-free trading system: AutoTMB.

Pasrsifal.RegressionTrendStateSummary
The Parsifal.Regression.Trend.State Indicator analyzes the leading coefficients of linear and quadratic regressions of price (against time). It also considers their first- and second-order changes. These features are aggregated into a Trend-State background, shown as a gradient color. In addition, the indicator generates fast and slow signals that can be used as potential entry- or exit triggers.
This tool is designed for advanced trend-following strategies, leveraging information from multiple trendline features.
Background
Trendlines provide insight into the state of a trend or the “trendiness” of a price process. While moving averages or pivot-based lines can serve as envelopes and breakout levels, they are often too lagging for swing traders, who need tools that adapt more closely to price swings, ideally using trendlines, around which the price process swings continuously.
Regression lines address this by cutting directly through the data, making them a natural anchor for observing how price winds around a central trendline within a chosen lookback period.
Regression Trendlines
• Linear Regression:
o Minimizes distance to all closing values over the lookback period.
o The slope represents the short-term linear trend.
o The change of slope indicates trend acceleration or deceleration.
o Linear regression lags during phases of rapid market shifts.
• Quadratic Regression:
o Fits a second-degree polynomial to minimize deviation from closing prices.
o The convexity term (leading coefficient) reflects curvature:
Positive convexity → accelerating uptrend or fading downtrend.
Negative convexity → accelerating downtrend or fading uptrend.
o The change of convexity detects early shifts in momentum and often reacts faster than slope features.
Features Extracted
The indicator evaluates six features:
• Linear features: slope, first derivative of slope, second derivative of slope.
• Quadratic features: convexity term, first derivative of the convexity term, second derivative of the convexity term.
• Linear features: capture broad, background trend behavior.
• Quadratic features: detect deviations, accelerations, and smaller-scale dynamics.
Quadratic terms generally react first to market changes, while linear terms provide stability and context.
Dynamics of Market Moves as seen by linear and quadratic regressions
• At the start of a rapid move:
The change of convexity reacts first, capturing the shift in dynamics before other features. The convexity term then follows, while linear slope features lag further behind. Because convexity measures deviation from linearity, it reflects accelerating momentum more effectively than slope.
• At the end of a rapid move:
Again, the change of convexity responds first to fading momentum, signaling the transition from above-linear to below-linear dynamics. Even while a strong trend persists, the change of convexity may flip sign early, offering a warning of weakening strength. The convexity term itself adjusts more slowly but may still turn before the price process does. Linear features lag the most, typically only flipping after price has already reversed, thereby smoothing out the rapid, more sensitive reactions of quadratic terms.
________________________________________
Parsifal Regression.Trend.State Method
1. Feature Mapping:
Each feature is mapped to a range between -1 and 1, preserving zero-crossings (critical for sign interpretation).
2. Aggregation:
A heuristic linear combination*) produces a background information value, visualized as a gradient color scale:
o Deep green → strong positive trend.
o Deep red → strong negative trend.
o Yellow → neutral or transitional states.
3. Signals:
o Fast signal (oscillator): ranges from -1 to 1, reflecting short-term trend state.
o Slow signal (smoothed): moving average of the fast signal.
o Their interactions (crossovers, zero-crossings) provide actionable trading triggers.
How to Use
The Trend-State background gradient provides intuitive visual feedback on the aggregated regression features (slope, convexity, and their changes). Because these features reflect not only current trend strength but also their acceleration or deceleration, the color transitions help anticipate evolving market states:
• Solid Green: All features near their highs. Indicates a strong, accelerating uptrend. May also reflect explosive or hyperbolic upside moves (including gaps).
• Fading Solid Green: A recently strong uptrend is losing momentum. Price may shift into a slower uptrend, consolidation, or even a reversal.
• Fading Green → Yellow: Often appears as a dirty yellow or a rapidly mixing pattern of green and red. Signals that the uptrend is weakening toward neutrality or beginning to turn negative.
• Yellow → Deepening Red: Two possible scenarios:
o Coming from a strong uptrend → suggests a sharp fade, though the trend may still technically be up.
o Coming from a weaker uptrend or sideways market → suggests the start of an accelerating downtrend.
• Solid Red: All features near their lows. Indicates a strong, accelerating downtrend. May also reflect crash-type conditions or downside gaps.
• Fading Solid Red: A recently strong downtrend is losing strength. Market may move into a slower decline, consolidation, or early reversal upward.
• Fading Red → Yellow : The downtrend is weakening toward neutral, with potential for a bullish shift.
• Yellow → Increasing Green: Two possible scenarios:
o Coming from a strong downtrend, it reflects a sharp fade of bearish momentum, though the market may still technically be trending down.
o Coming from a weaker downtrend or sideways movement, it suggests the start of an accelerating uptrend.
Note: Market evolution does not always follow this neat “color cycle.” It may jump between states, skip stages, or reverse abruptly depending on market conditions. This makes the background coloring particularly valuable as a contextual map of current and evolving price dynamics.
Signal Crossovers:
Although the fast signal is very similar (but not identical) to the background coloring, it provides a numerical representation indicating a bullish interpretation for rising values and bearish for falling.
o High-confidence entries:
Fast signal rising from < -0.7 and crossing above the slow signal → potential long entry.
Fast signal falling from > +0.7 and crossing below the slow signal → potential short entry.
o Low-confidence entries:
Crossovers near zero may still provide a valid trigger but may be noisy and should be confirmed with other signals.
o Zero-crossings:
Indicate broader state changes, useful for conservative positioning or option strategies. For confirmation of a Fast signal 0-crossing, wait for the Slow signal to cross as well.
________________________________________
*) Note on Aggregation
While the indicator currently uses a heuristic linear combination of features, alternatives such as Principal Component Analysis (PCA) could provide a more formal aggregation. However, while in the absence of matrix algebra, the required eigenvalue decomposition can be approximated, its computational expense does not justify the marginal higher insight in this case. The current heuristic approach offers a practical balance of clarity, speed, and accuracy.

Svl - Trading SystemPrice can tell lies but volume cannot, so keeping this in mind I have created this indicator in which you see sell order block and buy order block on the basis of price action + volume through which we execute our trade
First of all, let us know its core concepts and logic, which will help you in taking the right decisions in it.
core concept of the " Svl - Trading System " TradingView indicator is based on professional price action, volume, and swing structure. This indicator smartly gives real-time insights of important price turning points, reversal zones, and trend continuation. Its deep explanation is given below.
Edit - default swing length -5 , change according your nature , tested With 7 For 5 minute timeframe
Core Concept:
1. Swing Structure Detection
The indicator automatically detects swing highs (HH/LH) and swing lows (HL/LL) on the chart.
HH: Higher High
HL: Higher Low
LH: Lower High
LL: Lower Low
These swings are the backbone of price action – signaling a change in trend, a bounce, reversal or trend continuation.
2. Order Block (OB) Mapping
Buy Order Block (Buy OB): When the indicator detects the HL/LL swing, we declare Buy OB, the lowest point of the swing.
Sell Order Block (Sell OB): On HH/LH swing, the highest point of our swing is called Sell OB.
Order Blocks are those important zones of price where historically price has reacted strongly – where major clusters of buyers/sellers are located in the market.
3. Volume Analysis (Optional Dashboard/Barcolor)
The candle color depends on the volume ranking on the chart (most high/low, normal, pressure blue shade).
Highest/lowest volume candles are a special highlight, which helps to spot liquidity spikes, exhaustion, or big orders.
4. Live Dashboard
There is an automated dashboard in the top-right of the chart, which shows this in real-time:
Last swing type (HH/HL/LH/LL)
Reversal price (last swing level)
Swing direction (Bull/Bear/Neutral)
Volume, Buy OB, Sell OB, etc.
This helps the trader understand the market situation at a glance.
5. Smart Plotting/Labels
Buy/Sell are plotted as distinct lines on the OB chart.
The Labels option gives clear visual swing points.
All calculations are fast and automated – the user does not need to mark manually.
This indicator is an advanced, fully-automated price action tool that combines
trend, reversal, volume, liquidity and zone detection in one smart system,
makes entry/exit decisions objective and error-free,
and provides complete trading confidence with a live monitor/dashboard.
All of its functions/properties such as: swing detect, OB plot, volume color, dashboard follow best practice for professional chart analysis!

NPM Trend Dashboard NPM Trend Dashboard
The NPM Trend Dashboard is a closed-source tool designed to help traders quickly assess market conditions and make informed decisions. It combines trend detection, momentum, and volatility awareness into a clear interface, showing the current trend direction and strength for selected symbols.
What it does
Displays trend direction (uptrend, downtrend, or neutral) for each selected symbol.
Shows a confidence score or strength indicator to help gauge reliability.
Highlights potential areas of market exhaustion or reversal based on aggregated trend signals.
How it works (concept-level)
Combines multiple trend-detection methods such as moving average structure, momentum filters, and volatility assessment to generate an overall trend signal.
Uses adaptive filters to reduce noise and avoid false signals in choppy markets.
Incorporates zone awareness to account for areas where price may pause or reverse.
Aggregates signals into a single dashboard view to provide traders with a quick, actionable overview.
How to use it
1. Select symbols to monitor.
2. Switch to your desired timeframe to view trend information.
3. Observe trend direction and confidence score for each symbol.
4. Use the dashboard to supplement trade entries, exits, and risk management strategies.
Alerts
Optionally set alerts when trend direction changes or when confidence exceeds a user-defined threshold.
Notes
Suitable for multiple markets, including forex, indices, crypto, and equities.
Can be used for intraday scalping, swing trading, or longer-term trend analysis depending on the selected timeframe.
⚠️ Disclaimer: This script is for educational purposes only and is not financial advice. Trading involves risk, and you can lose money. Always test strategies on a demo account and practice proper risk management.

VIV 1.0 // AN IDEA BY Sunil SethiVIV (Very Important Volume) is a custom-built TradingView indicator designed to decode the psychology behind price and volume behavior — whether you are a breakout trader, reversal trader, or use your own discretionary logic. VIV reveals where institutional activity is likely taking place, highlights trend stages, uncovers volume footprints, and identifies high-probability trading zones — all with zero lag & 100% price-action-based logic.
Key Features (Expanded Concepts)
01. Trend-Based Analysis with Stages and Background Colors
VIV breaks down the market into three color-coded stages based on trend confirmation:
Stage 3: Uptrend (Short-Term Trend Confirmation)
Marks early accumulation or consolidation.
Shows possible reversal zones.
Short-term traders use this to spot opportunities before a breakout.
Stage 2: Uptrend (Medium-Term Trend Confirmation)
Highlights the start of a strong directional move.
Confidence zone for position building and breakout-following strategies.
Stage 1: Uptrend (Long-Term Trend Confirmation)
Indicates long term strength.
These trend stages reflect the emotional phases of market participants and the shifting balance of power between buyers and sellers. You can toggle trend backgrounds for intraday, daily, weekly, and monthly trends and change their background colors.
Note : If the % difference in Stage 3 exceeds 10%, the stock is considered extended. Such setups should be evaluated with caution before making any trade decisions.
02. . Volume Footprints (➕ Signs)
VIV intelligently identifies past candles with high-volume activity (accumulation/distribution).
These are not typical breakout volumes, but subtle footprints of smart money.
Help spot reversal points, liquidity zones, and retest levels.
Valuable for both breakout and reversal traders to confirm zone strength.
You can enable or disable these lines, adjust color, style, and width via VIV Line Settings.
03. VIV || H, VIV || L and VIV || C Zones
Automatically plots horizontal levels from high-volume, high-activity candles—revealing the footprints of smart money.
VIV || H (High) = Top of important bar.
VIV || L (Low) = Bottom of important bar.
VIV || C (Close) = Close price of important bar.
Key levels used by traders for:
Entries
Stop-loss placement
Targets
These zones show where price historically reacted due to strong institutional presence. They come with customizable label colors and backgrounds.
04. Price Tightness Detection
Detects when two or more candles compress within the range of a larger parent candle.
Represents indecision, contraction, or coiling behavior before major price moves.
Ideal for both:
Breakout traders looking for base formations.
Reversal traders watching for exhaustion.
Color-coded markers indicate such tight price zones — disabled by default but can be enabled.
05. Technical Stats Panel (Important Data Table)
An insightful dashboard providing:
ADR% – Volatility-based movement expectations (change period via input).
ATR – Real volatility indicator.
Average Volume / Price Volume – Customizable average period and currency unit (INR/USD).
Trend Data:
10/20/200 SMAs
10-week & 20-week trend stages (custom SMA period/timeframe supported)
Relative Strength vs Benchmark
RS grade: GREAT, GOOD, FAIR, UNCERTAIN, UNDER PERFORMER, LAGGARD, POOR
When RS is comparing: BOTH STRONG, BOTH WEEK
You can also display the benchmark symbol name and change the symbol for relative strength comparison.
06. Relative Strength Grade Change Alerts
VIV tracks relative strength changes against a chosen benchmark (e.g., Nifty MidSmallCap).
The above tells us that if the stock is stronger or weaker than the benchmark.
Detects when relative strength shifts from:
Strong → Weak (e.g., EXCELLENT → GOOD → FAIR)
Weak → Strong (e.g., LAGGARD → POOR → FAIR → GOOD)
Sudden transitions (e.g., WORST → FAIR, BOTH WEAK → GOOD, BOTH GOOD → POOR)
BOTH WEAK → GOOD or BOTH GOOD → POOR means stock's strength is better/poor than the benchmark
and more.
These alerts can help in:
Early trend following
Exiting when RS degrades
Adding positions when RS improves
07. Smart Alerts (Built-in Conditions)
You can set alerts for (any timeframe)
Positive Trend
Negative Trend
Rise in Volume
Relative Strength Changed
Set your preferred interval and trigger type in TradingView to stay updated without chart-watching.
08. Pivot Points
VIV allows visualizing pivot highs and lows using a dynamic window (left/right lookback).
Customizable label text and background color.
Helpful in identifying support or resistance zones and breakout points.
09. Customization Options
Toggle modules like trend background, labels, stats, and volume zones.
Customize colors for:
Labels
Zones
Trend backgrounds
Table text, borders, and alignment
Adjust visibility per timeframe (inputs tab)
How to Use VIV Effectively
Use trend background colors to identify phase (base, uptrend, top).
Look for stage 1, stage 2 and stage 3 for short, medium and long term trend.
Watch for old high-volume candles (➕ marks) to plan entries/exits.
Trade around ➕ marks, VIV || H and VIV || L levels.
Use tight price zones to anticipate explosive moves.
Monitor table for ATR/ADR, RS grade, and moving averages.
Use alerts to automate monitoring of trend, volume, or RS shifts.
Best Suited For:
Reversal traders (demand/supply based)
Breakout traders using base-building logic
Systematic or discretionary traders
Anyone who values price-volume behavior over lagging indicators


Multi-Timeframe Resonance v2.0📌 Multi-Timeframe Resonance System — Identify trend, range, and turning points at a glance
✨ Core Advantages:
🔹 Multi-timeframe resonance analysis: Detects trend direction and range across timeframes. Helps identify M tops, W bottoms, consolidation turning points, and trend switches.
🔹 Clear phase visualization: Highlights trend momentum (green) and consolidation zones (red).
🔹 Universally compatible: Works on stocks/ETFs, futures/commodities, forex, gold, crypto — parameter tuning is the only requirement.
🎯 Target Users:
✅ Traders needing fast structure analysis
✅ Trend-followers, swing traders, or range-arbitrageurs
✅ Multi-timeframe analysts & volume researchers
✅ Quant teams seeking stable signal output
📈 Market Structure Evolution Sequence:
**Same-Bear → Small Box Bull → Medium Box Bull → Large Box Bull → Same-Bull → Small Box Bear → Medium Box Bear → Large Box Bear → Same-Bear**
- “Same-Bear”/“Same-Bull”: full agreement among timeframes,strongest trend stages.
- “Small/Medium/Large Box”: represent increasing-level consolidations indicating trend emergence or turn.
🔍 By identifying the current structure phase, traders can determine if:
- The market is in the **early trend stage** (Same-Bull/Same-Bear)
- Or in a **trend shift period** (Bear→Bull or Bull→Bear)
- Or still **oscillating** (structures switching)
⚠️ **Practical Note:**
Although structure usually follows the sequence above, in strong or volatile moves it may:
- **Skip steps** (e.g., Same-Bear → Large Box Bull)
- **Switch rapidly** within a few candles
Traders should use volume, candle patterns, and higher-timeframe trends to confirm valid structure changes or avoid false breakouts.
📌 Execution Logic:
This indicator applies **multi-timeframe resonance** to capture **trend pullbacks**:
- Identifies trend direction via higher timeframes
- Uses pullback in shorter timeframe to signal entry
- Executes trend-following trades at pullback points
- Protects with structured stop-loss based on higher timeframe structure
🔒 This is a protected script. For access details, please see the Author’s Instructions.
📌 多周期共振识别系统 — 趋势、震荡与拐点,一目了然
✨ 核心优势:
🔹 多周期共振分析:同时检测多个周期的趋势方向与震荡结构,辅助识别 M 顶 / W 底 / 震荡拐点 / 趋势转换等关键信号。
🔹 趋势与震荡清晰可视:自动高亮趋势推进(绿色)与震荡盘整(红色)区域,一眼看清市场节奏。
🔹 全品种通用:适配股票 / ETF、期货 / 商品、外汇 / 黄金、加密货币等市场,仅需轻微参数微调。
🎯 适用人群:
✅ 需要快速识别图表结构的交易者
✅ 趋势跟随者、波段捕捉者、震荡套利者
✅ 热衷于多周期分析与量能行为研究的交易者
✅ 追求稳定信号输出的量化策略团队
📈 市场结构演变路径:
同空 → 小箱多 → 中箱多 → 大箱多 → 同多 → 小箱空 → 中箱空 → 大箱空 → 同空
“同空” / “同多”:表示多周期趋势完全一致,代表趋势最强阶段
“小箱 / 中箱 / 大箱”:代表不同级别的震荡结构,结构逐步递进,表示趋势正在酝酿或转向
🔍 通过识别当前所处的结构阶段,交易者可以判断:
当前是否处于趋势初期阶段(如同空 / 同多)
是否处于趋势转换区间(如由空转多或由多转空)
或仍处于震荡反复区间(结构频繁切换)
⚠️ 实战提醒:
虽然市场结构通常遵循上述顺序演化,但在强趋势或剧烈波动行情下,可能出现以下情况:
跳跃演化(如从“同空”直接进入“大箱多”阶段)
快速切换(几根K线内连续跳过多个结构)
因此,交易者应结合量能、K线形态及更高周期趋势,判断结构变化是否“有效”或为“假突破”。
📌 执行逻辑:
本指标通过多周期趋势共振确认,捕捉趋势中的回踩机会:
利用高阶周期判断趋势方向
在低阶周期的回踩位置作为进场信号
顺势交易,捕捉主趋势中的低吸 / 高抛机会
止损位置依据上位周期结构确认,明确清晰
🔒 本脚本为受控授权版本,如需获取使用权限,请参阅“作者说明”。
The Great Anchors: Dual AVWAP Powered by RSI
The Great Anchors
*Dual Anchored Volume Weighted Average Price Powered by RSI*
---
📌 Overview
The Great Anchors is a dual AVWAP-based indicator that resets dynamically using RSI extremes — either from the current asset or a master symbol (e.g., BTCUSDT). It identifies meaningful shifts in price structure and momentum using these "anchored" levels.
It’s designed to help traders spot trend continuations, momentum inflection points, and entry signals aligned with overbought/oversold conditions — but only when the market confirms through volume-weighted price direction.
---
🛠 Core Logic
• AVWAP 1 (favwap): Anchored when RSI reaches overbought levels (top anchor)
• AVWAP 2 (savwap): Anchored when RSI reaches oversold levels (bottom anchor)
• AVWAPs are recalculated each time a new OB/OS condition is triggered — acting like "fresh anchors" at key market turning points.
---
⚙️ Key Features
🔁 Auto or Manual RSI Thresholds
→ Automatically determines dynamic RSI OB/OS levels based on past peaks and troughs, or lets you set fixed levels.
🧠 Master Symbol Control
→ Use the RSI of a separate asset (like BTCUSDT, ETHUSDT, SOLUSDT, BNBUSDT, SUPRAUSDT) or indices (like TOTAL, TOTAL2, BFR) to control resets — ideal for tracking how BTC/major coins impacts altcoins/others.
🔍 Trend-Filtering Signal Logic
→ Signals are filtered for less noise and are triggered when:
- Both AVWAPs are rising (bullish) or falling (bearish)
- Price action confirms the structure
🎯 Visual Markers & Alerts
→ "💥" for bullish signals and "🔥" for bearish ones. Alerts included for automation or push notifications.
---
🎯 How to Use It
1. Add the indicator to your chart.
2. Choose whether to use RSI from the current symbol or a master symbol (e.g., BTC).
3. Select auto-adjusted or manual OB/OS levels.
4. Watch for:
- AVWAP(s) making a significant change (at this point it's one of the AVWAPs resetting)
- Check if price flip it upwards or downwards
- If price goes above both AVWAPs thats a likely bullish trend
- If price can't go above both AVWAPs up and fall bellow both that's a likely bearish trend
- Price retesting upper AVWAP and bounce
- likely bullish continuation
- Price retesting lower AVWAP and dip
- likely bearish continuation
- Signal icons on chart ("💥 - Bullish" or "🔥- Bearish")
Best suited for:
• Swing traders
• Momentum traders
• Traders timing altcoin entries using BTC/Major asset's RSI
---
🔔 Signal Explanation
💥 Bullish Signal =
• Both AVWAPs rising
• Higher lows in price structure
• Bullish candle close
• Triggered from overbought RSI reset
🔥 Bearish Signal =
• Both AVWAPs falling
• Lower highs in price structure
• Bearish candle close
• Triggered from oversold RSI reset
Signals reset by opposite signals to prevent noise or overfitting.
---
⚠️ Tips & Notes
• Use AVWAPs as dynamic support/resistance, even without signal triggers
• Pair with volume or divergence tools for stronger confirmation
---
🧩 Credits & Philosophy
This tool is built with a simple philosophy:
"Anchor your trades to meaningful moments in price — not arbitrary time."
The dual AVWAP concept helps you see how price reacts after momentum peaks, giving you a cleaner bias and more precise trade setups.
---

Hybrid Heikin Ashi OverlayHybrid Heikin Ashi Overlay
I personally like Heikin Ashi for its simplicity in showing clean trends. However, it tends to smooth out price action so much that we sometimes miss key signals from the actual candles.
This indicator overlays Heikin Ashi-style background colors while keeping regular candles intact — giving you the best of both worlds:
• Smoother trend visibility
• No loss of execution precision
• Customizable colors & transparency
🔹 No repainting
🔹 No strategy logic — purely visual
🔹 Designed to reduce clutter and help traders stay focused on structure
Created by: @yug_and_her
21-Day Trend Direction📈 21-Day Trend Direction Indicator
📊 How It Works:
🎯 Trend Detection Logic:
Analyzes last 21 daily candles
Calculates total price change from start to end
Compares against sideways threshold (default 2%)
Counts bullish vs bearish days
Tracks higher highs and lower lows
📈 Trend Classifications:
• 📈 UPTREND: Price change > +2% over 21 days
• 📉 DOWNTREND: Price change < -2% over 21 days
• ➡️ SIDEWAYS: Price change between -2% and +2%
💪 Trend Strength Levels:
• 🔥 Very Strong: >5% price change
• 💪 Strong: 3-5% price change
• 📊 Moderate: 1.5-3% price change
• 📉 Weak: <1.5% price change
🎨 Visual Features:
📋 Information Table Shows:
• Trend Direction with color coding
• Price Change % over 21 days
• Trend Strength classification
• Bull/Bear Days count
• Higher Highs/Lower Lows count
• Analysis Period (customizable)
📊 Chart Indicators:
• Trend Line (21-day moving average)
• Background Color for quick trend identification
• Trend Arrows (▲ ▼ ➡) on chart
• Customizable display options
⚙️ Customizable Settings:
🎯 Analysis Settings:
• Lookback Days: 5-50 days (default: 14)
• Sideways Threshold: 0.5-10% (default: 2%)
• Trend Strength: Low/Medium/High sensitivity
🎨 Display Options:
• Table Position: 9 different positions
• Table Size: Tiny to Large
• Show/Hide: Table, Trend Line, Background, Arrows
🚨 Alert Options:
• Trend Change to Uptrend
• Trend Change to Downtrend
• Trend Change to Sideways
This indicator gives you a clear, objective view of the 21-day trend with multiple confirmation signals! 🚀

Multi-Timeframe Trend Lines📌 What This Indicator Does
This tool helps you see the direction of the market across different timeframes—all on one chart.
Imagine you're looking at the price of a stock, crypto, or any other asset. You probably know the price can move differently in the short term and the long term. This indicator draws slanted lines to show if the price is generally going up or down over different time periods—like the past 1 minute, 5 minutes, 1 hour, 1 day, or even 1 month.
These lines are colored:
Green if the price is going up (a rising trend).
Red if the price is going down (a falling trend).
You can choose which timeframes you want to see—like 5 minutes or 1 day—by ticking checkboxes.
✅ Why This Is Useful
1. Helps You See the Bigger Picture
Even if you’re trading on a short timeframe (like 5 minutes), this indicator shows you the trend in longer timeframes (like 1 hour or 1 day). This helps you avoid going against the overall direction of the market.
2. Gives You More Confidence
When several timeframes show the same direction (all lines green, for example), it gives you more confidence that the trend is strong.
3. Saves Time
Instead of switching between different charts (like going from a 1-hour chart to a daily chart), you can see all the trends right on your current chart.
4. Easier Decision Making
You can quickly decide if it’s a good idea to buy (when most lines are green) or sell (when most lines are red).
👶 Example for a Beginner
Let’s say you’re looking at a 15-minute chart and thinking of buying.
* The 15-minute line is green (short-term price is going up).
* The 1-hour line is also green (medium-term price is going up).
* The 1-day line is green too (long-term price is going up).
This is a good sign that everything is moving upward, and it may be safer to buy.
But if the 1-day line is red while the shorter ones are green, it might mean the upward move is just temporary. That’s something to be careful about.

Z-Score Trend Monitor [EdgeTerminal]The Z-Score Trend Monitor measures how far the short-term moving average deviates from the long-term moving average using the spread difference of the two — in standardized units. It’s designed to detect overextension, momentum exhaustion, and potential mean-reversion points by converting the spread between two moving averages into a normalized Z-score and tracking its change and direction over time.
The idea behind this is to catch the changes in the direction of a trend earlier than the usual and lagging moving average lines, allowing you to react faster.
The math behind the indicator itself is very simple. We take the simple moving average of the spread between a long term and short term moving average, and divide it by the difference between the spread and spread mean.
This results in a relatively accurate and early acting trend detector that can easily identify overbought and oversold levels in any timeframe. From our own testing, we recommend using this indicator as a trend confirmation tool.
How to Use It:
Keep an eye on the Z-Score or the blue line. When it goes over 2, it indicates an overbought or near top level, and when it goes below -2, it indicates an oversold or near bottom.
When Z-Score returns to zero or grey line, it suggests mean reversion is in progress.
You can also change the Z-Score criteria from 2 and -2 in the settings to any number you’d like for tighter or wider levels.
For scalping and fast trading setups, we recommend shorter SMAs, such as 5 and 20, and for longer trading setups such as swing trades, we recommend 20 and 100.
Settings:
Short SMA: Lookback period of short term simple moving average for the lower side of the SMA spread.
Short Term Weight: Additional weight or multiplier to suppress the short term SMA calculation. This is used to refine the SMA calculation for more granular and edge cases when needed, usually left at 1, meaning it will take the entire given value in the short SMA field.
Long SMA: Lookback period of long term simple moving average for the upper side of the SMA spread.
Long Term Weight: Additional weight or multiplier to suppress the long term SMA calculation. This is used to refine the long SMA calculation for more granular and edge cases when needed, usually left at 1, meaning it will take the entire given value in the long SMA field.
Z-Score Threshold: The threshold for upper (oversold) and lower (overbought) levels. This can also be set individually from the style page.
Z-Score Lookback Window: The lookback period to calculate spread mean and spread standard deviation

Cointegration Buy and Sell Signals [EdgeTerminal]The Cointegration Buy And Sell Signals is a sophisticated technical analysis tool to spot high-probability market turning points — before they fully develop on price charts.
Most reversal indicators rely on raw price action, visual patterns, or basic and common indicator logic — which often suffer in noisy or trending markets. In most cases, they lag behind the actual change in trend and provide useless and late signals.
This indicator is rooted in advanced concepts from statistical arbitrage, mean reversion theory, and quantitative finance, and it packages these ideas in a user-friendly visual format that works on any timeframe and asset class.
It does this by analyzing how the short-term and long-term EMAs behave relative to each other — and uses statistical filters like Z-score, correlation, volatility normalization, and stationarity tests to issue highly selective Buy and Sell signals.
This tool provides statistical confirmation of trend exhaustion, allowing you to trade mean-reverting setups. It fades overextended moves and uses signal stacking to reduce false entries. The entire indicator is based on a very interesting mathematically grounded model which I will get into down below.
Here’s how the indicator works at a high level:
EMAs as Anchors: It starts with two Exponential Moving Averages (EMAs) — one short-term and one long-term — to track market direction.
Statistical Spread (Regression Residuals): It performs a rolling linear regression between the short and long EMA. Instead of using the raw difference (short - long), it calculates the regression residual, which better models their natural relationship.
Normalize the Spread: The spread is divided by historical price volatility (ATR) to make it scale-invariant. This ensures the indicator works on low-priced stocks, high-priced indices, and crypto alike.
Z-Score: It computes a Z-score of the normalized spread to measure how “extreme” the current deviation is from its historical average.
Dynamic Thresholds: Unlike most tools that use fixed thresholds (like Z = ±2), this one calculates dynamic thresholds using historical percentiles (e.g., top 10% and bottom 10%) so that it adapts to the asset's current behavior to reduce false signals based on market’s extreme volatility at a certain time.
Z-Score Momentum: It tracks the direction of the Z-score — if Z is extreme but still moving away from zero, it's too early. It waits for reversion to start (Z momentum flips).
Correlation Check: Uses a rolling Pearson correlation to confirm the two EMAs are still statistically related. If they diverge (low correlation), no signal is shown.
Stationarity Filter (ADF-like): Uses the volatility of the regression residual to determine if the spread is stationary (mean-reverting) — a key concept in cointegration and statistical arbitrage. It’s not possible to build an exact ADF filter in Pine Script so we used the next best thing.
Signal Control: Prevents noisy charts and overtrading by ensuring no back-to-back buy or sell signals. Each signal must alternate and respect a cooldown period so you won’t be overwhelmed and won’t get a messy chart.
Important Notes to Remember:
The whole idea behind this indicator is to try to use some stat arb models to detect shifting patterns faster than they appear on common indicators, so in some cases, some assumptions are made based on historic values.
This means that in some cases, the indicator can “jump” into the conclusion too quickly. Although we try to eliminate this by using stationary filters, correlation checks, and Z-score momentum detection, there is still a chance some signals that are generated can be too early, in the stock market, that's the same as being incorrect. So make sure to use this with other indicators to confirm the movement.
How To Use The Indicator:
You can use the indicator as a standalone reversal system, as a filter for overbought and oversold setups, in combination with other trend indicators and as a part of a signal stack with other common indicators for divergence spotting and fade trades.
The indicator produces simple buy and sell signals when all criteria is met. Based on our own testing, we recommend treating these signals as standalone and independent from each other . Meaning that if you take position after a buy signal, don’t wait for a sell signal to appear to exit the trade and vice versa.
This is why we recommend using this indicator with other advanced or even simple indicators as an early confirmation tool.
The Display Table:
The floating diagnostic table in the top-right corner of the chart is a key part of this indicator. It's a live statistical dashboard that helps you understand why a signal is (or isn’t) being triggered, and whether the market conditions are lining up for a potential reversal.
1. Z-Score
What it shows: The current Z-score value of the volatility-normalized spread between the short EMA and the regression line of the long EMA.
Why it matters: Z-score tells you how statistically extreme the current relationship is. A Z-score of:
0 = perfectly average
> +2 = very overbought
< -2 = very oversold
How to use it: Look for Z-score reaching extreme highs or lows (beyond dynamic thresholds). Watch for it to start reversing direction, especially when paired with green table rows (see below)
2. Z-Score Momentum
What it shows: The rate of change (ROC) of the Z-score:
Zmomentum=Zt − Zt − 1
Why it matters: This tells you if the Z-score is still stretching out (e.g., getting more overbought/oversold), or reverting back toward the mean.
How to use it: A positive Z-momentum after a very low Z-score = potential bullish reversal A negative Z-momentum after a very high Z-score = potential bearish reversal. Avoid signals when momentum is still pushing deeper into extremes
3. Correlation
What it shows: The rolling Pearson correlation coefficient between the short EMA and long EMA.
Why it matters: High correlation (closer to +1) means the EMAs are still statistically connected — a key requirement for cointegration or mean reversion to be valid.
How to use it: Look for correlation > 0.7 for reliable signals. If correlation drops below 0.5, ignore the Z-score — the EMAs aren’t moving together anymore
4. Stationary
What it shows: A simplified "Yes" or "No" answer to the question:
“Is the spread statistically stable (stationary) and mean-reverting right now?”
Why it matters: Mean reversion strategies only work when the spread is stationary — that is, when the distance between EMAs behaves like a rubber band, not a drifting cloud.
How to use it: A "Yes" means the indicator sees a consistent, stable spread — good for trading. "No" means the market is too volatile, disjointed, or chaotic for reliable mean reversion. Wait for this to flip to "Yes" before trusting signals
5. Last Signal
What it shows: The last signal issued by the system — either "Buy", "Sell", or "None"
Why it matters: Helps avoid confusion and repeated entries. Signals only alternate — you won’t get another Buy until a Sell happens, and vice versa.
How to use it: If the last signal was a "Buy", and you’re watching for a Sell, don’t act on more bullish signals. Great for systems where you only want one position open at a time
6. Bars Since Signal
What it shows: How many bars (candles) have passed since the last Buy or Sell signal.
Why it matters: Gives you context for how long the current condition has persisted
How to use it: If it says 1 or 2, a signal just happened — avoid jumping in late. If it’s been 10+ bars, a new opportunity might be brewing soon. You can use this to time exits if you want to fade a recent signal manually
Indicator Settings:
Short EMA: Sets the short-term EMA period. The smaller the number, the more reactive and more signals you get.
Long EMA: Sets the slow EMA period. The larger this number is, the smoother baseline, and more reliable trend bases are generated.
Z-Score Lookback: The period or bars used for mean & std deviation of spread between short and long EMAs. Larger values result in smoother signals with fewer false positives.
Volatility Window: This value normalizes the spread by historical volatility. This allows you to prevent scale distortion, showing you a cleaner and better chart.
Correlation Lookback: How many periods or how far back to test correlation between slow and long EMAs. This filters out false positives when EMAs lose alignment.
Hurst Lookback: The multiplier to approximate stationarity. Lower leads to more sensitivity to regime change, higher produces a more stricter filtering.
Z Threshold Percentile: This value sets how extreme Z-score must be to trigger a signal. For example, 90 equals only top/bottom 10% of extremes, 80 = more frequent.
Min Bars Between Signals: This hard stop prevents back-to-back signals. The idea is to avoid over-trading or whipsaws in volatile markets even when Hurst lookback and volatility window values are not enough to filter signals.
Some More Recommendations:
We recommend trying different EMA pairs (10/50, 21/100, 5/20) for different asset behaviors. You can set percentile to 85 or 80 if you want more frequent but looser signals. You can also use the Z-score reversion monitor for powerful confirmation.

Johnny's Machine Learning Moving Average (MLMA) w/ Trend Alerts📖 Overview
Johnny's Machine Learning Moving Average (MLMA) w/ Trend Alerts is a powerful adaptive moving average indicator designed to capture market trends dynamically. Unlike traditional moving averages (e.g., SMA, EMA, WMA), this indicator incorporates volatility-based trend detection, Bollinger Bands, ADX, and RSI, offering a comprehensive view of market conditions.
The MLMA is "machine learning-inspired" because it adapts dynamically to market conditions using ATR-based windowing and integrates multiple trend strength indicators (ADX, RSI, and volatility bands) to provide an intelligent moving average calculation that learns from recent price action rather than being static.
🛠 How It Works
1️⃣ Adaptive Moving Average Selection
The MLMA automatically selects one of four different moving averages:
📊 EMA (Exponential Moving Average) – Reacts quickly to price changes.
🔵 HMA (Hull Moving Average) – Smooth and fast, reducing lag.
🟡 WMA (Weighted Moving Average) – Gives recent prices more importance.
🔴 VWAP (Volume Weighted Average Price) – Accounts for volume impact.
The user can select which moving average type to use, making the indicator customizable based on their strategy.
2️⃣ Dynamic Trend Detection
ATR-Based Adaptive Window 📏
The Average True Range (ATR) determines the window size dynamically.
When volatility is high, the moving average window expands, making the MLMA more stable.
When volatility is low, the window shrinks, making the MLMA more responsive.
Trend Strength Filters 📊
ADX (Average Directional Index) > 25 → Indicates a strong trend.
RSI (Relative Strength Index) > 70 or < 30 → Identifies overbought/oversold conditions.
Price Position Relative to Upper/Lower Bands → Determines bullish vs. bearish momentum.
3️⃣ Volatility Bands & Dynamic Support/Resistance
Bollinger Bands (BB) 📉
Uses standard deviation-based bands around the MLMA to detect overbought and oversold zones.
Upper Band = Resistance, Lower Band = Support.
Helps traders identify breakout potential.
Adaptive Trend Bands 🔵🔴
The MLMA has built-in trend envelopes.
When price breaks the upper band, bullish momentum is confirmed.
When price breaks the lower band, bearish momentum is confirmed.
4️⃣ Visual Enhancements
Dynamic Gradient Fills 🌈
The trend strength (ADX-based) determines the gradient intensity.
Stronger trends = More vivid colors.
Weaker trends = Lighter colors.
Trend Reversal Arrows 🔄
🔼 Green Up Arrow: Bullish reversal signal.
🔽 Red Down Arrow: Bearish reversal signal.
Trend Table Overlay 🖥
Displays ADX, RSI, and Trend State dynamically on the chart.
📢 Trading Signals & How to Use It
1️⃣ Bullish Signals 📈
✅ Conditions for a Long (Buy) Trade:
The MLMA crosses above the lower band.
The ADX is above 25 (confirming trend strength).
RSI is above 55, indicating positive momentum.
Green trend reversal arrow appears (confirmation of a bullish reversal).
🔹 How to Trade It:
Enter a long trade when the MLMA turns bullish.
Set stop-loss below the lower Bollinger Band.
Target previous resistance levels or use the upper band as take-profit.
2️⃣ Bearish Signals 📉
✅ Conditions for a Short (Sell) Trade:
The MLMA crosses below the upper band.
The ADX is above 25 (confirming trend strength).
RSI is below 45, indicating bearish pressure.
Red trend reversal arrow appears (confirmation of a bearish reversal).
🔹 How to Trade It:
Enter a short trade when the MLMA turns bearish.
Set stop-loss above the upper Bollinger Band.
Target the lower band as take-profit.
💡 What Makes This a Machine Learning Moving Average?
📍 1️⃣ Adaptive & Self-Tuning
Unlike static moving averages that rely on fixed parameters, this MLMA automatically adjusts its sensitivity to market conditions using:
ATR-based dynamic windowing 📏 (Expands/contracts based on volatility).
Adaptive smoothing using EMA, HMA, WMA, or VWAP 📊.
Multi-indicator confirmation (ADX, RSI, Volatility Bands) 🏆.
📍 2️⃣ Intelligent Trend Confirmation
The MLMA "learns" from recent price movements instead of blindly following a fixed-length average.
It incorporates ADX & RSI trend filtering to reduce noise & false signals.
📍 3️⃣ Dynamic Color-Coding for Trend Strength
Strong trends trigger more vivid colors, mimicking confidence levels in machine learning models.
Weaker trends appear faded, suggesting uncertainty.
🎯 Why Use the MLMA?
✅ Pros
✔ Combines multiple trend indicators (MA, ADX, RSI, BB).
✔ Automatically adjusts to market conditions.
✔ Filters out weak trends, making it more reliable.
✔ Visually intuitive (gradient colors & reversal arrows).
✔ Works across all timeframes and assets.
⚠️ Cons
❌ Not a standalone strategy → Best used with volume confirmation or candlestick analysis.
❌ Can lag slightly in fast-moving markets (due to smoothing).

Power Trend [MacAlgo]Description:
The Power Trend Indicator is a sophisticated technical analysis tool that overlays on your trading charts to identify prevailing market trends. It utilizes a combination of ATR-based trend calculations, moving averages, volume analysis, and momentum indicators to generate reliable buy and sell signals. Additionally, it offers customizable settings to adapt to various trading styles and timeframes.
Key Features:
Adaptive ATR Calculation: Automatically adjusts the ATR (Average True Range) period and multiplier based on the selected timeframe for more accurate trend detection.
Dynamic Trend Lines: Plots continuous trend lines with color-coded bars to visually represent bullish and bearish trends.
Buy/Sell Signals: Generates standard and power buy/sell signals to help you make informed trading decisions.
Volume Analysis: Incorporates average buy and sell volumes to identify strong market movements.
Multiple Timeframe Support: Automatically adjusts the indicator's timeframe or allows for manual selection to suit your trading preferences.
Highlighting: Highlights trending bars for easy visualization of market conditions.
Alerts: Customizable alert conditions to notify you of potential trading opportunities in real-time.
How it Works:
1. ATR-Based Trend Calculation:
ATR Period & Multiplier: Calculates ATR based on user-defined periods and multipliers, dynamically adjusting according to the chart's timeframe.
Trend Determination: Identifies trends as bullish (1) or bearish (-1) based on price movements relative to ATR-based upper (up) and lower (dn) trend lines.
2. Moving Averages:
EMA & SMA: Calculates exponential and simple moving averages to smooth price data and identify underlying trends.
AlphaTrend Line: Combines a 50-period EMA and a 30-period SMA on a 4-hour timeframe to create the AlphaTrend line, providing a robust trend reference.
3. Volume Analysis:
Buy/Sell Volume: Differentiates between buy and sell volumes to gauge market strength.
Average Volume: Compares current volume against average buy/sell volumes to detect significant market movements.
4. Momentum Indicators:
RSI, MACD, OBV: Incorporates Relative Strength Index (RSI), Moving Average Convergence Divergence (MACD), and On-Balance Volume (OBV) to assess momentum and confirm trend strength.
5. Signal Generation:
Standard Signals: Basic buy and sell signals based on trend crossovers.
Power Signals: Enhanced signals requiring multiple conditions (e.g., increased volume, momentum confirmation) for higher confidence trades.
Customization Options:
Tailor the Power Trend Indicator to your specific trading needs with the following settings:
ATR Period: Set the period for ATR calculation (default: 8).
ATR Multiplier: Adjust the ATR multiplier to fine-tune trend sensitivity (default: 3.0).
Source: Choose the price source (e.g., HL2, Close) for calculations.
Change ATR Calculation Method: Toggle between different ATR calculation methods.
Show Buy/Sell Signals: Enable or disable the display of buy and sell signals on the chart.
Highlighting: Turn on or off the bar highlighting feature.
Timeframe Adjustment: Choose between automatic timeframe adjustment or manually set
the indicator's timeframe.
Manual Indicator Timeframe: If manual adjustment is selected, specify the desired timeframe (default: 60 minutes).
Visual Components:
Trend Lines: Continuous lines representing the current trend, color-coded for easy identification (green for bullish, red for bearish, orange for neutral).
Bar Coloring: Bars are colored based on the current trend and its relationship to the AlphaTrend line.
Buy/Sell Triangles: Triangular markers appear on the chart to indicate buy and sell signals.
Power Signals: Larger triangles highlight strong buy and sell opportunities based on multiple confirming factors.
Highlighting: Transparent overlays highlight trending areas to enhance visual clarity.
Alerts:
Stay informed with customizable alerts that notify you of important market movements:
SuperTrend Buy/Sell: Alerts when standard buy or sell signals are generated.
Power Buy/Sell Alerts: Notifications for strong buy or sell signals based on comprehensive conditions.
Trend Direction Change: Alerts when the trend changes from bullish to bearish or vice versa.
How to Use:
Add to Chart: Apply the Power Trend Indicator to your preferred trading chart on TradingView.
Configure Settings: Adjust the input parameters to match your trading style and the timeframe you are analyzing.
Analyze Trends: Observe the trend lines, bar colors, and AlphaTrend line to understand the current market trend.
Follow Signals: Look for buy and sell signals or power signals to identify potential entry and exit points.
Set Alerts: Enable alerts to receive real-time notifications of significant trading opportunities.
Adjust as Needed: Fine-tune the settings based on market conditions and your trading experience.
Important Notes:
Backtesting: While the Power Trend Indicator is built using robust technical analysis principles, it's essential to backtest and validate its performance within your trading strategy.
Market Conditions: The indicator performs best in trending markets. In sideways or highly volatile markets, signal reliability may vary.
Risk Management: Always employ proper risk management techniques when trading based on indicator signals to protect your capital.
Disclaimer:
This indicator is intended for educational purposes only and does not provide financial advice or guarantee future performance. Trading involves risk, and past results are not indicative of future outcomes. Always conduct your own analysis and risk management.

TrendMasterPro_FekonomiTrend Change and Start Signals with Weighted Conditions
The Trend Change and Start Signals with Weighted Conditions indicator leverages various technical analysis tools to generate reliable buy and sell signals. This indicator helps investors more accurately identify trend changes and start signals in the market.
Features:
Utilizes popular technical analysis tools such as MACD, RSI, EMA, and Ichimoku Cloud.
Enhances signal accuracy with additional indicators like ADX and Volume Increase.
Allows users to adjust the weights of each condition to set their importance.
The Confidence Level parameter lets you adjust the accuracy rate of the signals.
Visual Signals make it easy to track buy and sell points directly on the chart.
How It Works:
Condition Weights: Users assign weights to indicators like MACD, RSI, EMA, and Ichimoku Cloud. If you have no idea, use default settings.
Condition Fulfillment: Checks if the conditions for each indicator are met.
Confidence Level: The total weight of the fulfilled conditions must exceed the user-defined confidence level.
Signal Generation: When these conditions are met, a buy or sell signal is generated and visually displayed on the chart.
Customization:
Personalize Signals: By adjusting the weights of the indicators used, you can personalize the signals to match your trading strategy and preferences.
Use Cases:
Short-Term Investments: Identify quick trend changes for short-term trading decisions.
Long-Term Investments: Detect long-term trend starts and changes for strategic investment decisions.
Technical Analysis: Combine different technical analysis tools for more comprehensive and reliable analyses.
With this indicator, you can better understand market movements and make more informed investment decisions. Try it now and enhance your trading strategy!
by Fekonomi

EXPONOVA by @thejamiulEXPONOVA is an advanced EMA-based indicator designed to provide a visually intuitive and actionable representation of market trends. It combines two EMAs (Exponential Moving Averages) with a custom gradient fill to help traders identify trend reversals, strength, and the potential duration of trends.
This indicator uses a gradient color fill between two EMAs—one short-term (20-period) and one longer-term (55-period). The gradient dynamically adjusts based on the proximity and relationship of the closing price to the EMAs, giving traders a unique visual insight into trend momentum and potential exhaustion points.
Key Features:
Dynamic Gradient Fill:
The fill color between the EMAs changes based on the bar's position relative to the longer-term EMA.
A fading gradient visually conveys the strength and duration of the trend. The closer the closing price is to crossing the EMA, the stronger the gradient, making trends easy to spot.
Precision EMA Calculations:
The indicator plots two EMAs (20 and 55) without cluttering the chart, ensuring traders have a clean and informative display.
Ease of Use:
Designed for both novice and advanced traders, this tool is effective in identifying trend reversals and entry/exit points.
Trend Reversal Detection:
Built-in logic identifies bars since the last EMA cross, dynamically adjusting the gradient to signal potential trend changes.
How It Works:
This indicator calculates two EMAs:
EMA 20 (Fast EMA): Tracks short-term price movements, providing early signals of potential trend changes.
EMA 55 (Slow EMA): Captures broader trends and smoothens noise for a clearer directional bias.
The area between the two EMAs is filled with a dynamic color gradient, which evolves based on how far the price has moved above or below EMA 55. The gradient acts as a visual cue to the strength and duration of the current trend:
Bright green shades indicate bullish momentum building over time.
Red tones highlight bearish momentum.
The fading effect in the gradient provides traders with an intuitive representation of trend strength, helping them gauge whether the trend is accelerating, weakening, or reversing.
Gradient-Filled Region: Unique visualization to simplify trend analysis without cluttering the chart.
Dynamic Trend Strength Indication: The gradient dynamically adjusts based on the price's proximity to EMA 55, giving traders insight into momentum changes.
Minimalist Design: The EMAs themselves are not displayed by default to maintain a clean chart while still benefiting from their analysis.
Customizable Lengths: Pre-configured with EMA lengths of 20 and 55, but easily modifiable for different trading styles or instruments.
How to Use This Indicator
Trend Detection: Look at the gradient fill for visual confirmation of trend direction and strength.
Trade Entries:
Enter long positions when the price crosses above EMA 55, with the gradient transitioning to green.
Enter short positions when the price crosses below EMA 55, with the gradient transitioning to red.
Trend Strength Monitoring:
A brighter gradient suggests a sustained and stronger trend.
A fading gradient may indicate weakening momentum and a potential reversal.
Important Notes
This indicator uses a unique method of color visualization to enhance decision-making but does not generate buy or sell signals directly.
Always combine this indicator with other tools or methods for comprehensive analysis.
Past performance is not indicative of future results; please practice risk management while trading.
How to Use:
Trend Following:
Use the gradient fill to identify the trend direction.
A consistently bright gradient indicates a strong trend, while fading colors suggest weakening momentum.
Reversal Signals:
Watch for gradient changes near the EMA crossover points.
These can signal potential trend reversals or consolidation phases.
Confirmation Tool:
Combine EXPONOVA with other indicators or candlestick patterns for enhanced confirmation of trade setups.
VIX CANDLESThe VIX CANDLES indicator is designed to visualize the Williams VIX Fix, a volatility measure that mimics the VIX index but applies to different financial instruments.
This indicator calculates a custom "VIX-like" value based on the highest close over a specified look-back period and plots the result as candlesticks. It also includes an Exponential Moving Average (EMA) to help identify trends and potential buy/sell signals.
Williams VIX Fix Calculation: Measures volatility by comparing the current low to the highest close over the given period, then expressing the result as a percentage.
Custom Candles: The VIX Fix is displayed as a set of candlesticks where the body is colored based on whether the close is higher (green) or lower (red) than the open.
Exponential Moving Average (EMA): An EMA is applied to the VIX Fix value to smooth the data and identify trend changes. The EMA's length is customizable.
Trade Direction Labels: Labels are plotted when the VIX Fix crosses above or below the EMA, signaling potential buy (▽) or sell (△) opportunities.
Customization: Colors for the candlesticks and EMA, as well as the look-back period and EMA length, can be adjusted to suit your preferences.
This indicator is useful for traders looking to track volatility and identify potential trend shifts in the market. By combining the Williams VIX Fix with an EMA, it provides a more dynamic view of market conditions, helping traders spot extreme volatility and adjust their strategies accordingly.

Open_close AND HIGH_LOW_diffAverage of Absolute (Open - Close) Indicator
This indicator calculates the average of the absolute difference between the open and close prices of the last n candles and plots the result in a separate panel.
Key Features:
Customizable Period: Users can set the number of candles (n) to include in the average calculation.
Absolute Value Calculation: The script computes the absolute difference (|Open - Close|) for each candle, ensuring only positive values are averaged.
Separate Panel Visualization: The indicator is displayed in a separate panel below the main chart for clear and uncluttered analysis.
Red Plot: The average value is plotted with a bold red line for easy identification.
Use Cases:
Analyze the average volatility of price movements over a specified period.
Identify periods of consistent price differences between open and close levels.
Complement other volatility or trend-based indicators.
This tool is ideal for traders who want to monitor the consistency of price fluctuations and integrate it into their decision-making process.
How to Use:
Add the script to your TradingView chart.
Adjust the "Number of Candles" input to match your preferred look-back period.
Observe the red line in the separate panel to analyze the average absolute difference over time.
Feel free to reach out with suggestions or feedback to enhance the functionality of this script!
