GMS: TSI Indicator (ROC)This is based on the original TSI Indicator that's already built in.
The PC is originally taken as the change between the current price - the previous price. I substituted that with Rate of Change. Using a 1 period ROC it's quite similar to the TSI Indicator and increasing the length results in a smoother TSI.
I hope it helps,
Andre
TSI
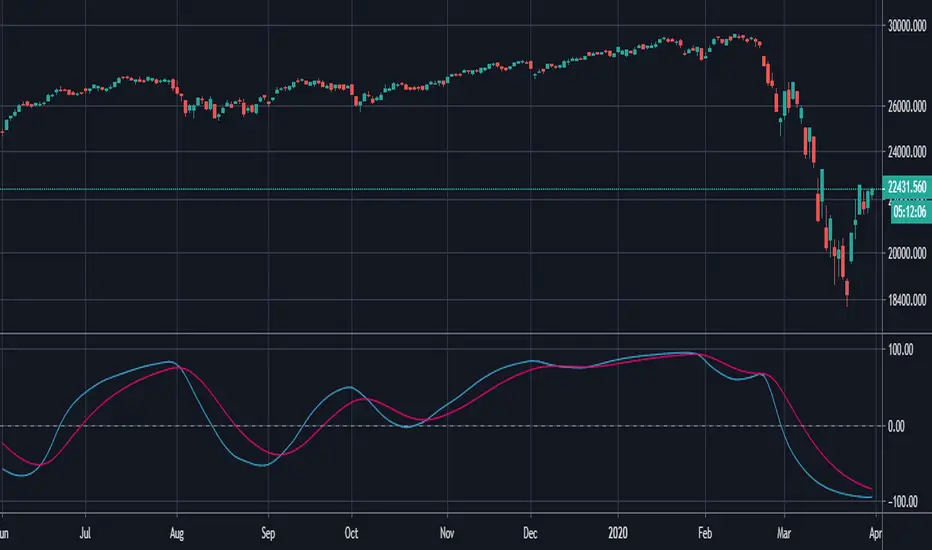
Vortex with TSI strategyStrategy Terms
Indicator: Vortex
Indicator: True Strength Indicator
As you will see, the indicators have red and blue lines. To buy an option for a price increase, you need to wait for the simultaneous intersection of the lines of both indicators when the blue lines are at the top and the red ones go down. And vice versa, to buy an option with a forecast of a fall in prices, the blue lines should go down and the red lines up.

Volume Weighted TSI V 1.0This script uses a unique calculation for True Strength Indicator (TSI) and incorporates volume weighting the chosen source over a variable length.
The frame length changes dynamically to minimize chop zones.
Two lines:
- a signal line and a moving average of the signal line
There are a few ways to use this indicator:
- look for the cross of the signal line with the moving average for an early marker, this is more volatile
- look for the signal line cross with zero line a medium volatility marker
- look for the average to cross the zero line, a less volatile marker but comes in later
- over sold and over bought zones, suggest looking for exits from those zones as a trigger
Parameter explanation:
- setting the source for the TSI, this is then weighed with volume
- setting the maximum and minimum length, this sets the boundaries for the dynamic length/frame, actual frame lengths will fall within these boundaries (be sensitive to using very high lengths the indicator may fail on loop calculations)
- setting the change look back for TSI, the standard setting is 1, you can play with this for fine tuning
- the boundary that sets the value for overbought/oversold
What you see
- signal line
- moving average of signal line, this is colored to show points of velocity
- overbought/oversold circles at the top or bottom that meet boundary criteria
- diamonds that show crossing events

Mirror TSI-MACD by Trader JayI was playing around with the TSI-MACD and surprisingly it works quite well as a mirror.
There are 2 ways this can be used
1. Enter long when Blue line crosses up the Red
2. Exit long when Green line crosses the blue
or
1. Enter long when Blue line crosses up the Red
2. Exit long when Blue line crosses back down below the Red

TSI CCI HullThis is TSI and CCI combined. The CCI is customized and is using HullMA, but the TSI is default TSI
For use with the HMAv420 indicator, to form trading strategy based on the 3 indicators.
Best as all 3 indicators used on 3 timeframes at once, ie 1m 5m 1H

Ghosty's True Strength Indicator TSIStandard TSI plotted with 2 additional lines, i use the " 10" line crosses as an indicator of strength.
Enjoy.

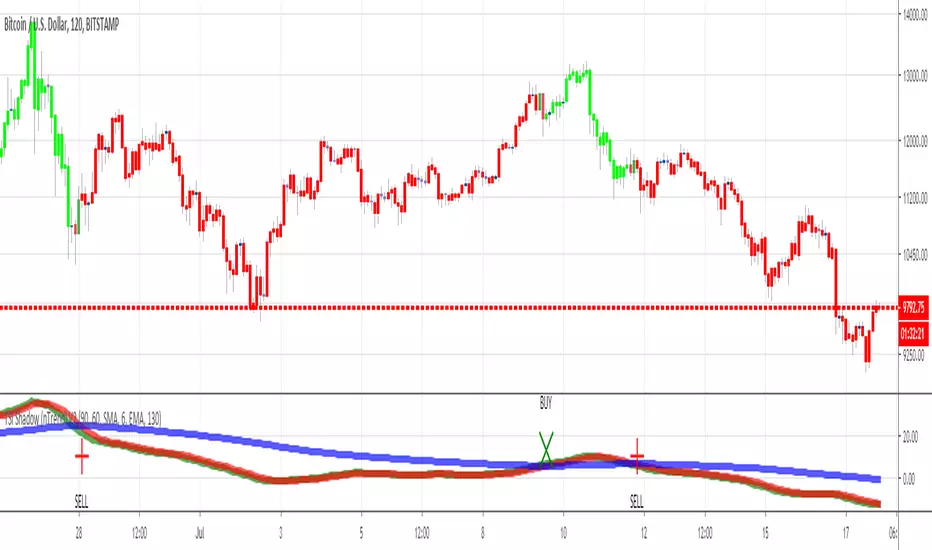
TSI Shadow (with custom candle coloring)Hello traders
This indicator is based on my TSI shadow previously published
This custom version will also color the candles based on the TSI shadow trend
Bullish condition = TSI > MA2 and MA1> MA2
Bearish condition = TSI < MA1 and MA1 < MA2
I made alerts available for this indicator so you can set them on your account
Enjoy
Dave
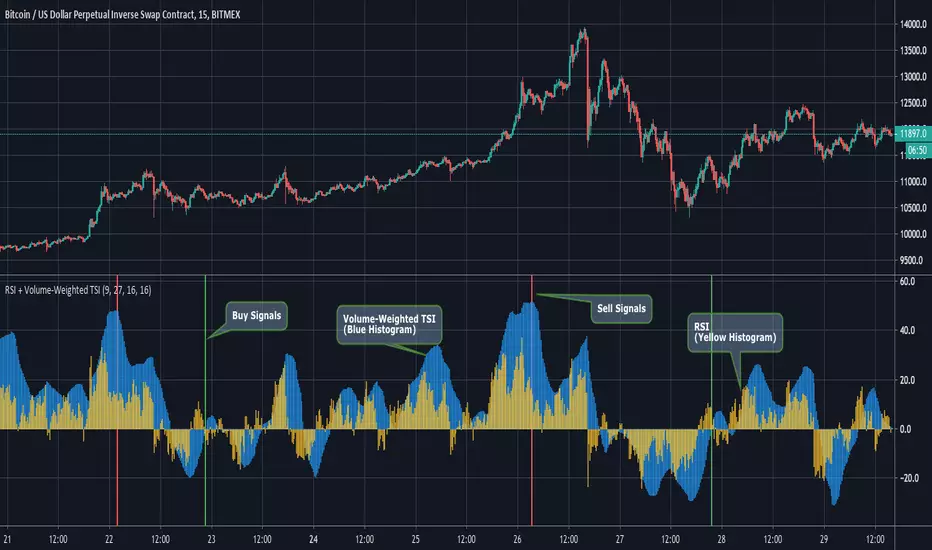
RSI + Volume-Weighted TSIThis indicator combines a standard RSI with a modified TSI.
Although a double smoothing process is already used in calculating the normal TSI, we decided to apply a volume weighted moving average of length (length_of_slow_TSI_EMA // 2) to it. This resulted in a smoother TSI that picked up on large-scale swings very nicely.
Entry Signals are generated when the Volume-Weighted TSI crosses above zero from negative into positive territory. Exit signals are generated when the TSI is above 40 and then begins its downward fall, along with a declining RSI value.
The Graph:
The Volume-Weighted TSI is plotted as the blue histogram, wile the RSI is plotted as the yellow histogram. We definitely wanted to go the simplicity route on this one's graphics, since the RSI and TSI are both classic and reliable indicators.
The green background highlights indicate an entry signal and red highlights signify an exit signal.
Input Options:
-length of Slow EMA for TSI
-length of Fast EMA for TSI
-Length of Volume Weighted MA of TSI.
-Length of RSI.
~Happy Trading~
Super True Strength IndicatorHere is the Super TSI. An indicator to use for bias (bull/bear) in addition for entry and possible exit signals.
The Super True Strength Index is only available to members in my private training.
The Super TSI takes 4 measures the strength in 4 different timeframes. It's designed to be used on either a Weekly, Daily, 4HR, or 1HR chart.
If you are in my training please watch training videos on how to use this indicator.
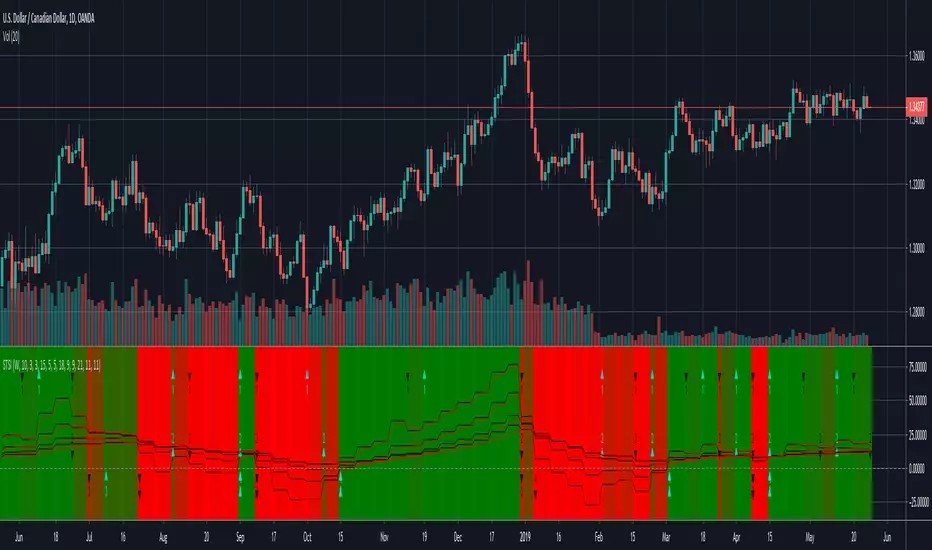
True Strength Indicator WeeklyThe True Strength Indicator Weekly is designed to help you identify trend and BIAS in the market based on the Weekly timeframe regardless of chart. Timeframe can be modified.
This indicator provides both long and short signals as well as color coding market direction bias.
There are 3 variables for this indicator are smoothed with some calculations EMAs with a signals.
Defaults are short length (21), long length (11), signal length (11) and represent the best middle of the road numbers I've found that work across all markets.
Upward triangle with L represents Long signal.
Downward triangle with S represents Short signal
Green background represents bull bias
Red background represents bear bias

HMA_ATR_TSIA combination of signals trigger this strategy.
HMA crossovers (short period & long period) -Hull moving average-
ATR (smoothed with HMA ) -Average true range-
TSI -True strength index-
The final close price is not known until right at the end of the bar.
This means that the indicator is constantly “repainting” during the bar.
You will see that indicators are constantly moving with each tick received
Use Open instead, the value is set and does not change even after refreshing the page.
An attempt to reduce repainting.
INDICATOR VERSION FOR USE WITH ALERTS

HMA_ATR_TSIA combination of signals trigger this strategy.
HMA crossovers (short period & long period) -Hull moving average-
ATR (smoothed with HMA) -Average true range-
TSI -True strength index-
The final close price is not known until right at the end of the bar.
This means that the indicator is constantly “repainting” during the bar.
You will see that indicators are constantly moving with each tick received
Use Open instead, the value is set and does not change even after refreshing the page.
An attempt to reduce repainting.

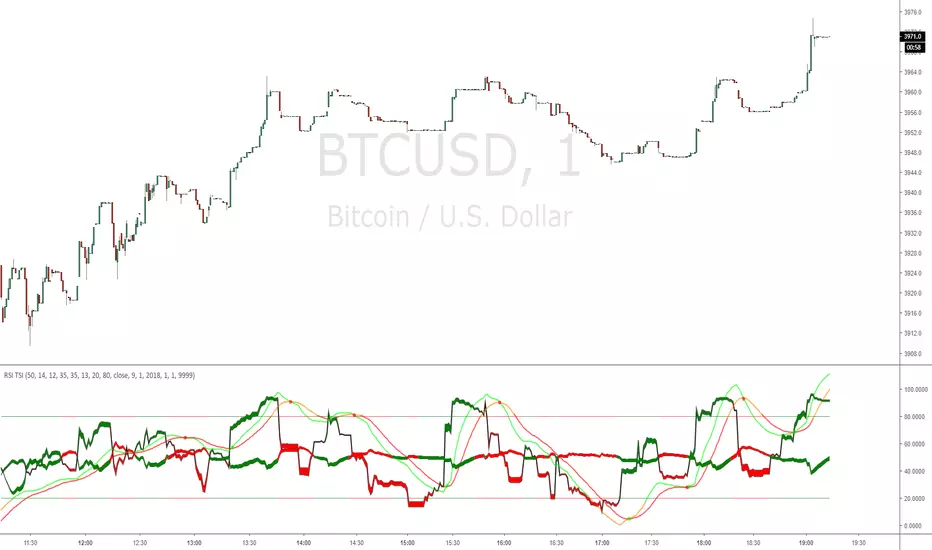
RSI TSIRSI & TSI combination, with Hull MA for a center Line.
Order entry with either RSI TSI or Hull MA
Experimental strategy for possible use as bot
Plots named for use with alerts
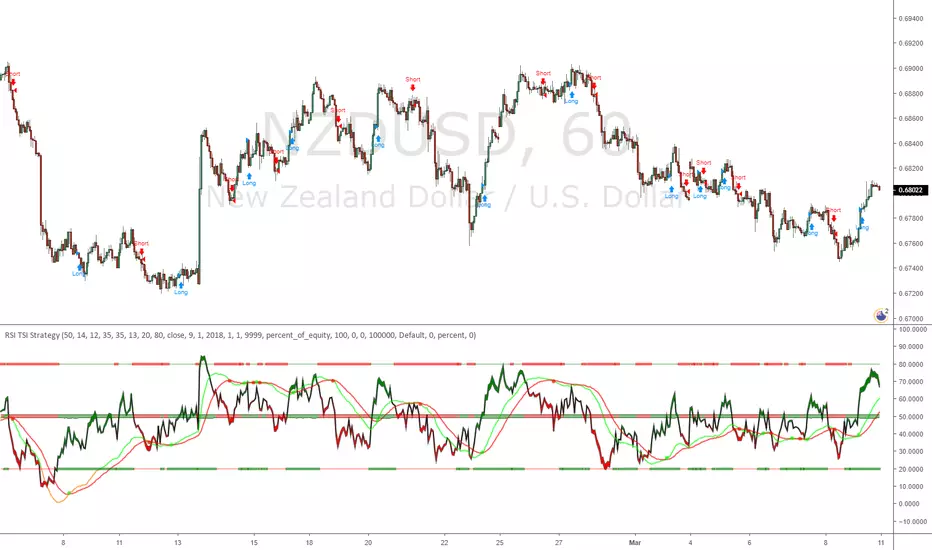
RSI TSI StrategyRSI & TSI combination, with Hull MA for a center Line.
Order entry with either RSI TSI or Hull MA
Experimental strategy for possible use as bot
Godmode 4.0.1 [Correlator]First off, a huge thank you to the following people:
@LEGION:
@LazyBear: www.tradingview.com
@xSilas: www.tradingview.com
@Ni6HTH4awK: www.tradingview.com
@sco77m4r7and:
@SNOW_CITY: www.tradingview.com
@oh92: www.tradingview.com
@alexgrover: www.tradingview.com
@cI8DH: www.tradingview.com
@DonovanWall: www.tradingview.com
This is my second iteration of Godmode. This time I allowed the possibility to correlate two benchmarks against one another, thereby giving you twice the signals (once there's a strong correlation between the two, inverse or otherwise). That aside, there are no changes to this indicator that the first iteration doesn't have:
There are still more iterations planned, but if you guys have any ideas or wishes regarding what direction I go, then please let me know.
Want to Learn?
If you'd like the opportunity to learn Pine but you have difficulty finding resources to guide you, take a look at this rudimentary list: docs.google.com
The list will be updated in the future as more people share the resources that have helped, or continue to help, them. Follow me on Twitter to keep up-to-date with the growing list of resources as well as any other scripts I publish.
Suggestions or Questions?
Don't even kinda hesitate to forward them to me. My (metaphorical) door is always open.


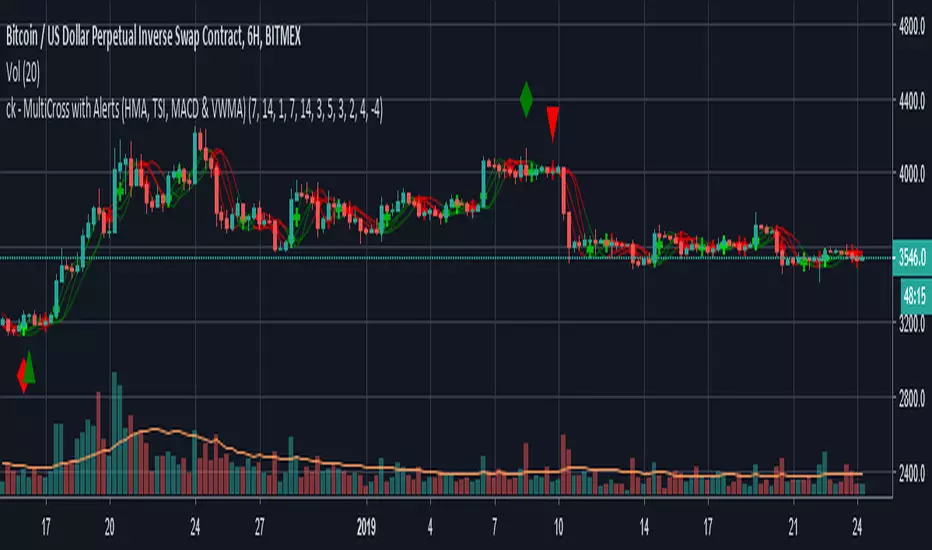
ck - MultiCross with Alerts (HMA, TSI, MACD & VWMA)Hello again everyone!
I hope you enjoy this "Multicross" Indicator.
Feature packed indicator with Alerts, that includes:
Double Hull MAs (fast and slow)
TSI (fast, slow, Long trigger & Short triggers definable)
VWMA
MACD (fast and slow)
Visual output plots line crosses from the indicators and provides visual Long and Short triangles and Alerts for bot users!
Enjoy!
Special thanks to Magnus Söderberg for the idea behind this.
John EMA Cross TSI 0Should be used on 4hr chart
Testing on NZDCAD, NZDUSD, etc.
EMAs 10 20 MA 34
Manual entry of Support and Resistance horizontal lines 1-5
TSI = True strength index. It uses moving averages of the underlying momentum of a financial instrument.

NAVI'S PERFECT TSIThe NAVI'S PERFECT TSI Indicator is the same as the True Strength Index (TSI) developed by
NAVI, except the SMI includes a signal line. The SMI uses double moving averages
of price minus previous price over 2 time frames. The signal line, which is an EMA of the
SMI, is plotted to help trigger trading signals. Adjustable guides are also given to fine
tune these signals. The user may change the input (close), method (EMA), period lengths
and guide values.
You can use in the xPrice any series: Open, High, Low, Close, HL2, HLC3, OHLC4 and ect...

Trader Set - Ergodic MomentumThis is a price momentum indicator that is based on Ergodic formula (TSI), but the formula is tweaked and different types of averaging is allowed. by changing the type of average calculation and some predefined values (totally different from what is suggested by now) we get a nasty indicator that can easily be used both for cycle observation side by side with momentum of the price itself !
Please don't contact me for getting access, these tools are available for my students only. These are part of my "methodology" that I teach. The English version of the website and learning material is under development and I will announce it under each related script when they are ready so that those who are interested can participate in the course.

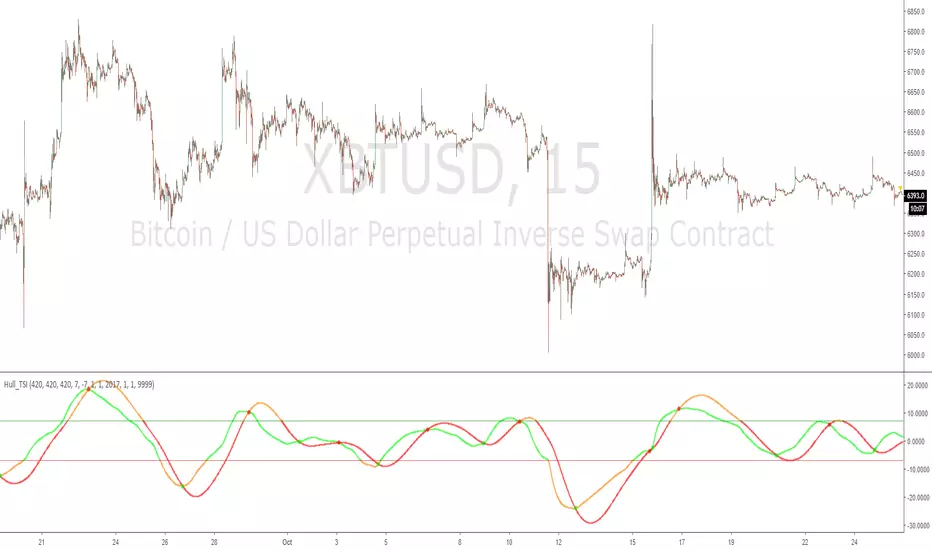
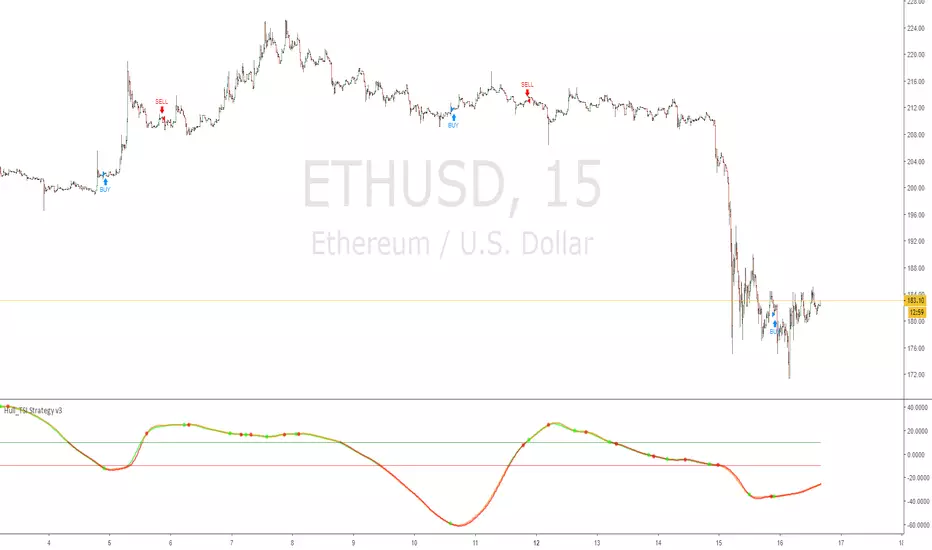
Hull_TSI Strategy v3True Strength Index, but Exponential Moving Average taken out and replaced with Hull Moving Average
this version uses 3 Hull MA's as well as the TSI value crossovers above or below the upper/lower lines
This version is the closest to the API bot featured at gekkoplus.com
Hull_TSI bot is competing in the competition
" Gekko Plus is hosting a strategy contest. Submit the best performing Gekko strategy and win 0.1 BTC! "
15 Nov 2018: Strategy contest start
10 Dec 2018: Strategy contest end
12 Dec 2018: Contest evaluation, announcement of winners!
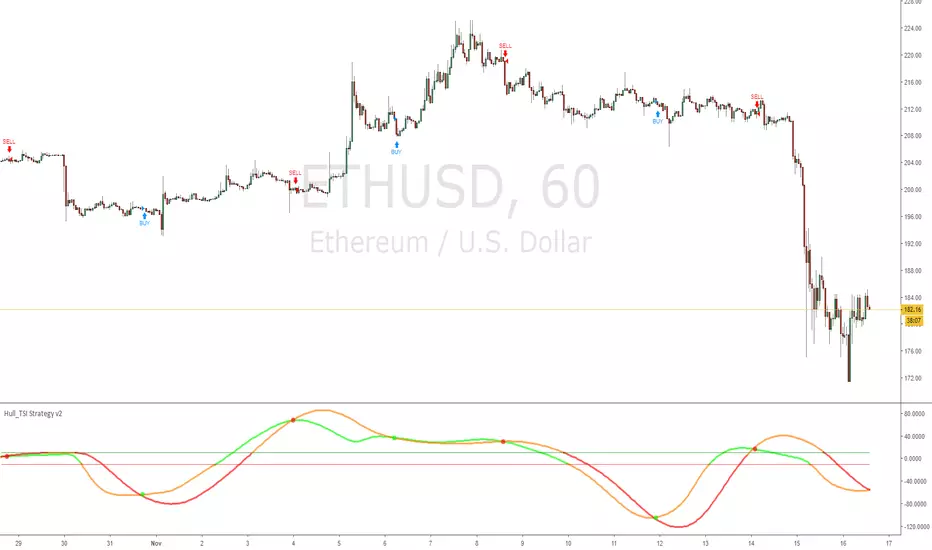
Hull_TSI Strategy v2True Strength Index, but Exponential Moving Average taken out and replaced with Hull Moving Average
this version uses only the crossover of the TSI values
Hull_TSITrue Strength Index, but Exponential Moving Average taken out and replaced with Hull Moving Average
increase the values for increased timeframes i found good on 1hour chart 700,700,700 (instead of 420)
this is the indicator version, hopefully Alert friendly with each plot named