The chart of Avalon Technologies is currently sitting at a very interesting location where both advanced Demand–Supply principles and traditional technical analysis are telling a powerful story.
Let’s break the entire analysis into two separate parts so traders of all styles can understand what the chart is silently revealing.
🟢 Advanced Demand & Supply Zone Analysis 🔍
These characteristics indicate that the current decline is not a bearish fall, but simply a normal pullback within a larger uptrend, supporting the possibility of trend continuation as long as the demand zone remains intact.
📌 Curve Analysis Viewpoint
Since price rallied strongly, broke the all-time high, and has now returned to a previously created RBR demand origin:
📊 Traditional Technical Analysis Perspective 📈
Switching to classical TA, the chart confirms the Demand–Supply story from another angle.
📉 Trendline & Structure Analysis
The stock has respected an ascending trendline for months. Every time price approached it:
Price is currently reacting near this trendline once again, suggesting structural strength.
🔄 Support Turned Resistance… Now Turned Support
A wide consolidation zone from the previous range, which acted as resistance earlier, has now flipped into support.
This phenomenon—resistance becoming support—is one of the strongest confluences in price action.
📌 Candlestick Behaviour
The rejection candles forming on the pullback indicate that:
📉 Volume Confirmation
Volume shows a typical pattern seen during healthy retracements:
🧩 Combined Insight From Classical TA
When a rising trendline, a former resistance-turned-support, and bullish rejection candles align together, the setup represents a high probability continuation scenario—as long as the broader trend remains intact.
🌟 Final Outlook 🌟
When evaluated independently, both Advanced Demand–Supply analysis & Traditional technical analysis reach the same conclusion:
“The stock is currently reacting from a strong area of institutional interest within an intact uptrend.”
The Price appears positioned for continuation—unless the nearest strong demand zone is cleanly violated in the future.
🔥 Trading is a journey of patience, discipline, and constant learning — every candle tells a story, keep reading the market with confidence! 🔥
Lastly, thank you for your support, your likes & comments. Feel free to ask if you have questions.
This analysis is strictly for educational purposes only. I am not a SEBI-registered analyst.
Let’s break the entire analysis into two separate parts so traders of all styles can understand what the chart is silently revealing.
🟢 Advanced Demand & Supply Zone Analysis 🔍
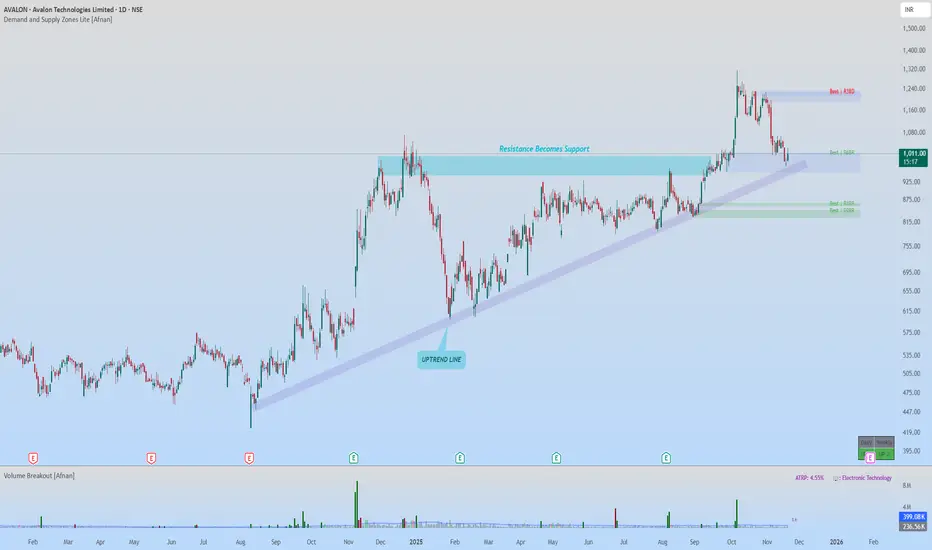
- Price formed a clean Rally–Base–Rally (RBR) demand zone earlier, which later pushed the market strongly upward and even broke the all-time high, creating a new high point.
- After making this new high, the stock pulled back naturally toward the same RBR demand zone — a textbook return-to-origin move.
- As price reached the zone, we can clearly see a reversal candle forming right inside the demand, confirming that sellers are losing momentum and buyers are defending the zone again.
These characteristics indicate that the current decline is not a bearish fall, but simply a normal pullback within a larger uptrend, supporting the possibility of trend continuation as long as the demand zone remains intact.
📌 Curve Analysis Viewpoint
Since price rallied strongly, broke the all-time high, and has now returned to a previously created RBR demand origin:
- There are no higher-timeframe supply zones above the current price structure, This positions the stock low on the curve.
- Being low on the curve generally supports buying continuation trades, especially when aligned with a fresh demand zone.
📊 Traditional Technical Analysis Perspective 📈
Switching to classical TA, the chart confirms the Demand–Supply story from another angle.
📉 Trendline & Structure Analysis
The stock has respected an ascending trendline for months. Every time price approached it:
- Buyers stepped in
- higher lows were maintained
- Trendline acted as dynamic support
Price is currently reacting near this trendline once again, suggesting structural strength.
🔄 Support Turned Resistance… Now Turned Support
A wide consolidation zone from the previous range, which acted as resistance earlier, has now flipped into support.
This phenomenon—resistance becoming support—is one of the strongest confluences in price action.
📌 Candlestick Behaviour
The rejection candles forming on the pullback indicate that:
- Sellers could not maintain control
- Buyers absorbed aggressive selling
- Wicks show institutional order collection at lower prices
📉 Volume Confirmation
Volume shows a typical pattern seen during healthy retracements:
- Strong volume on rallies
- Falling volume on pullbacks
- Occasional spikes confirming institutional footprints
🧩 Combined Insight From Classical TA
When a rising trendline, a former resistance-turned-support, and bullish rejection candles align together, the setup represents a high probability continuation scenario—as long as the broader trend remains intact.
🌟 Final Outlook 🌟
When evaluated independently, both Advanced Demand–Supply analysis & Traditional technical analysis reach the same conclusion:
“The stock is currently reacting from a strong area of institutional interest within an intact uptrend.”
The Price appears positioned for continuation—unless the nearest strong demand zone is cleanly violated in the future.
🔥 Trading is a journey of patience, discipline, and constant learning — every candle tells a story, keep reading the market with confidence! 🔥
Lastly, thank you for your support, your likes & comments. Feel free to ask if you have questions.
This analysis is strictly for educational purposes only. I am not a SEBI-registered analyst.
Access the powerful Demand and Supply Zone Pro indicator at:
marketup2date.com
Stay updated on Telegram:
t.me/MarketUp2Date
Join our WhatsApp channel:
whatsapp.com/channel/0029Va6ByyH0LKZCc4Az4x0u
marketup2date.com
Stay updated on Telegram:
t.me/MarketUp2Date
Join our WhatsApp channel:
whatsapp.com/channel/0029Va6ByyH0LKZCc4Az4x0u
פרסומים קשורים
כתב ויתור
המידע והפרסומים אינם מיועדים להיות, ואינם מהווים, ייעוץ או המלצה פיננסית, השקעתית, מסחרית או מכל סוג אחר המסופקת או מאושרת על ידי TradingView. קרא עוד ב־תנאי השימוש.