Gold has been compressing inside a converging falling wedge, a pattern that typically signals waning bearish pressure and an upcoming bullish break. The structure has been developing for several weeks, with each swing clearly showing a loss of momentum from sellers and a stronger defense from buyers at progressively higher lows.
The wedge is now approaching its apex, and price is pressing against the upper boundary. While this setup carries a bullish tilt, confirmation is still critical before acting.
Why this structure matters
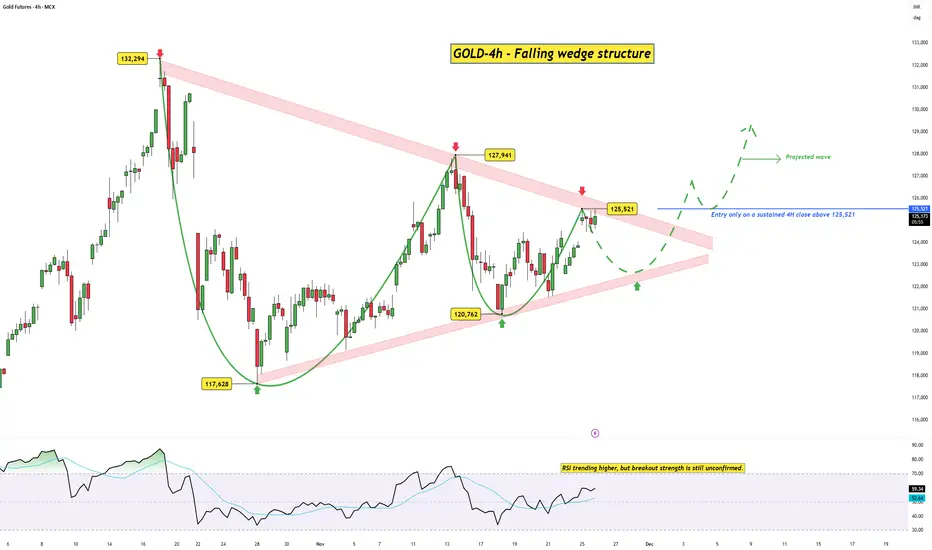
In this case, the last swing high sits at 125,521, aligning perfectly with the wedge’s upper rail.
Only a sustained 4H close above 125,521 would confirm that the market has absorbed overhead supply and is ready to transition into a higher timeframe move.
RSI Check
RSI is trending higher but hasn’t yet signaled full breakout momentum. A push above the 60–65 zone would strengthen the bullish case and support continuation after the breakout.
Trade Plan
Trigger:
Entry only on a sustained 4H close above 125,521.
This keeps you aligned with pattern confirmation and avoids premature entries inside compression.
Upside path:
A breakout could initially retest the wedge boundary before starting the projected upward leg toward higher resistance zones.
Summary
Gold is displaying a well-defined falling wedge with clear signs of seller exhaustion and buyer strength. The structure leans bullish, but the move needs to be validated through a confirmed break above 125,521. Until then, the wedge remains a compression zone — not a breakout.
Disclaimer: This analysis is for educational purposes only and does not constitute investment advice. Please do your own research (DYOR) before making any trading decisions.
The wedge is now approaching its apex, and price is pressing against the upper boundary. While this setup carries a bullish tilt, confirmation is still critical before acting.
Why this structure matters
- This is a Converging Falling Wedge (Bullish) pattern, defined by:
- Sellers losing momentum on each downswing
- Buyers defending higher lows, tightening the structure
- Compression building toward the apex, creating stored energy
- Breakouts typically hitting the upper rail first
- Confirmation occurring only on a close above the last swing high
In this case, the last swing high sits at 125,521, aligning perfectly with the wedge’s upper rail.
Only a sustained 4H close above 125,521 would confirm that the market has absorbed overhead supply and is ready to transition into a higher timeframe move.
RSI Check
RSI is trending higher but hasn’t yet signaled full breakout momentum. A push above the 60–65 zone would strengthen the bullish case and support continuation after the breakout.
Trade Plan
Trigger:
Entry only on a sustained 4H close above 125,521.
This keeps you aligned with pattern confirmation and avoids premature entries inside compression.
Upside path:
A breakout could initially retest the wedge boundary before starting the projected upward leg toward higher resistance zones.
Summary
Gold is displaying a well-defined falling wedge with clear signs of seller exhaustion and buyer strength. The structure leans bullish, but the move needs to be validated through a confirmed break above 125,521. Until then, the wedge remains a compression zone — not a breakout.
Disclaimer: This analysis is for educational purposes only and does not constitute investment advice. Please do your own research (DYOR) before making any trading decisions.
WaveXplorer | Elliott Wave insights
📊 X profile: @veerappa89
📊 X profile: @veerappa89
כתב ויתור
המידע והפרסומים אינם מיועדים להיות, ואינם מהווים, ייעוץ או המלצה פיננסית, השקעתית, מסחרית או מכל סוג אחר המסופקת או מאושרת על ידי TradingView. קרא עוד ב־תנאי השימוש.
WaveXplorer | Elliott Wave insights
📊 X profile: @veerappa89
📊 X profile: @veerappa89
כתב ויתור
המידע והפרסומים אינם מיועדים להיות, ואינם מהווים, ייעוץ או המלצה פיננסית, השקעתית, מסחרית או מכל סוג אחר המסופקת או מאושרת על ידי TradingView. קרא עוד ב־תנאי השימוש.