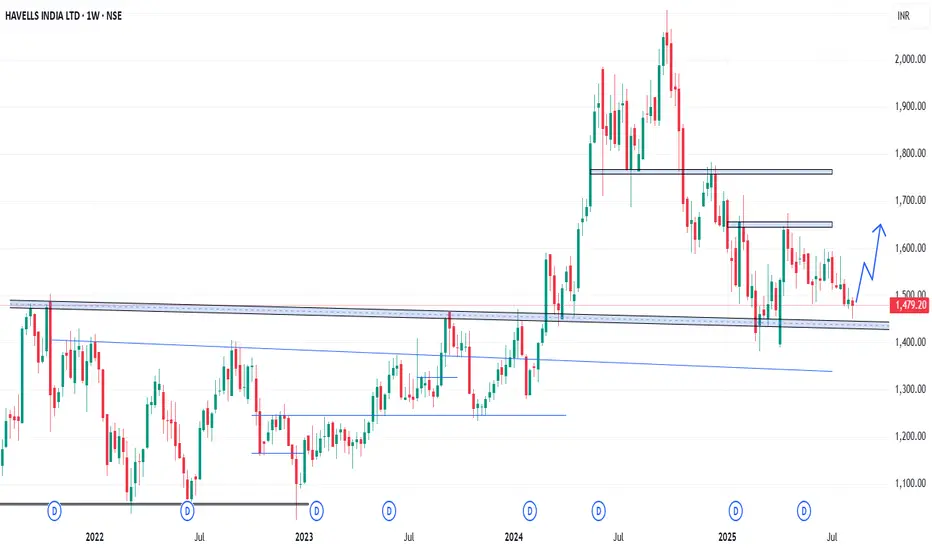
In the Weekly Chart of HAVELLS ,
we can see that, it has created a Hammer candle on support.
We can see a bounce back from here.
Expected momentum is shown in chart.
we can see that, it has created a Hammer candle on support.
We can see a bounce back from here.
Expected momentum is shown in chart.
כתב ויתור
המידע והפרסומים אינם מיועדים להיות, ואינם מהווים, ייעוץ או המלצה פיננסית, השקעתית, מסחרית או מכל סוג אחר המסופקת או מאושרת על ידי TradingView. קרא עוד ב־תנאי השימוש.
כתב ויתור
המידע והפרסומים אינם מיועדים להיות, ואינם מהווים, ייעוץ או המלצה פיננסית, השקעתית, מסחרית או מכל סוג אחר המסופקת או מאושרת על ידי TradingView. קרא עוד ב־תנאי השימוש.