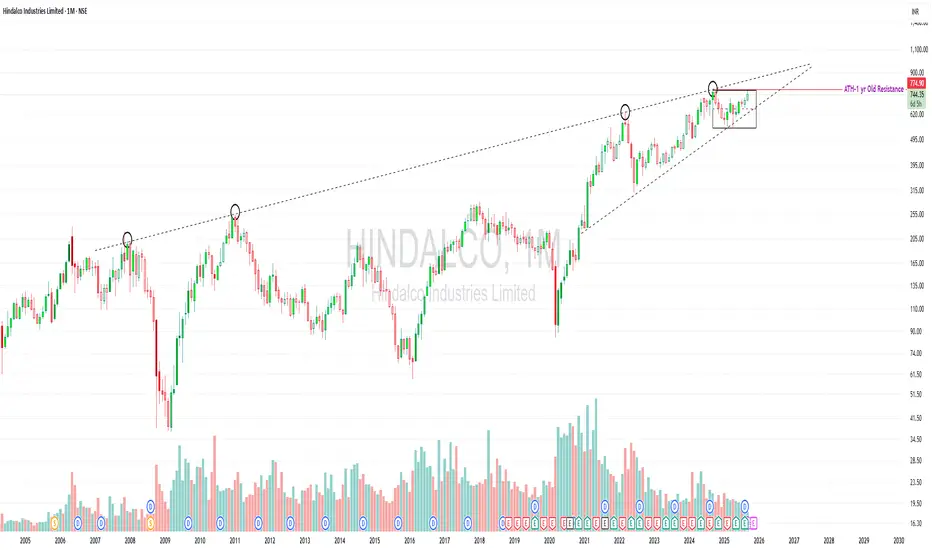
Near ATH, testing a 20-year trendline — worth studying.
- Price is trading inside a long-term rising wedge.
- The upper trendline has acted as resistance multiple times (2007, 2011, 2022, and now).
- Currently consolidating in a tight range near ATH (~₹775).
- Volume needs improvement — a decisive breakout above resistance should ideally come with strong volume confirmation.
⚠️ Risks / Watch-outs:
Rising wedge patterns can also resolve downwards if breakout fails.
Repeated rejections from the same long-term trendline may trigger profit-taking.
Without big volume, any breakout attempt may not sustain.
💡 Learning Point: Long-term trendlines and volume behavior are crucial in studying potential breakouts vs. failed attempts.
⚠️ Disclaimer: This post is for educational purposes only. It is not a buy/sell recommendation or financial advice. Please do your own research or consult a SEBI-registered advisor before making investment decisions.
כתב ויתור
המידע והפרסומים אינם מיועדים להיות, ואינם מהווים, ייעוץ או המלצה פיננסית, השקעתית, מסחרית או מכל סוג אחר המסופקת או מאושרת על ידי TradingView. קרא עוד ב־תנאי השימוש.
כתב ויתור
המידע והפרסומים אינם מיועדים להיות, ואינם מהווים, ייעוץ או המלצה פיננסית, השקעתית, מסחרית או מכל סוג אחר המסופקת או מאושרת על ידי TradingView. קרא עוד ב־תנאי השימוש.