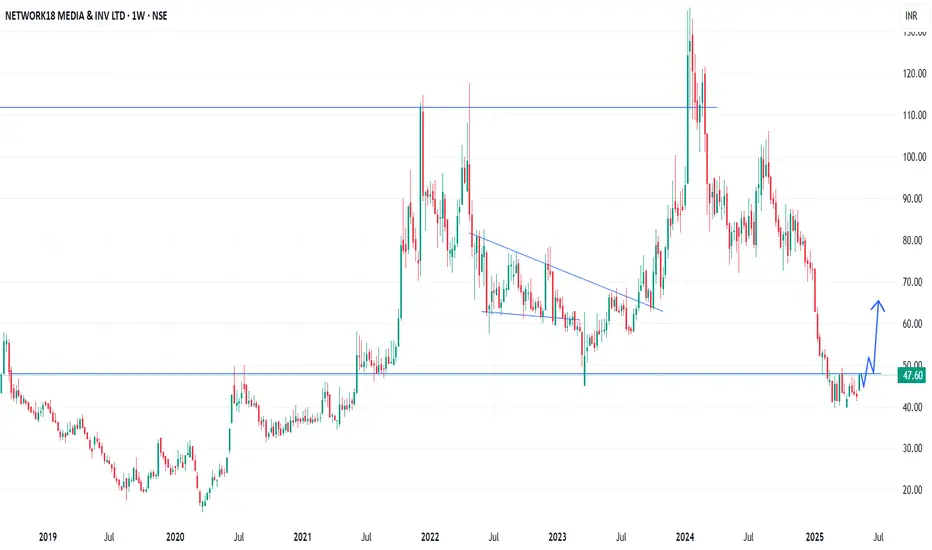
In the Weekly Chart of NETWORK18 ,
we can see that; it is trying to recover from very bottom with W Shape recovery.
Let it create one or two Halt candles to get more strong momentum.
Expected momentum is shown in chart.
we can see that; it is trying to recover from very bottom with W Shape recovery.
Let it create one or two Halt candles to get more strong momentum.
Expected momentum is shown in chart.
כתב ויתור
המידע והפרסומים אינם מיועדים להיות, ואינם מהווים, ייעוץ או המלצה פיננסית, השקעתית, מסחרית או מכל סוג אחר המסופקת או מאושרת על ידי TradingView. קרא עוד ב־תנאי השימוש.
כתב ויתור
המידע והפרסומים אינם מיועדים להיות, ואינם מהווים, ייעוץ או המלצה פיננסית, השקעתית, מסחרית או מכל סוג אחר המסופקת או מאושרת על ידי TradingView. קרא עוד ב־תנאי השימוש.