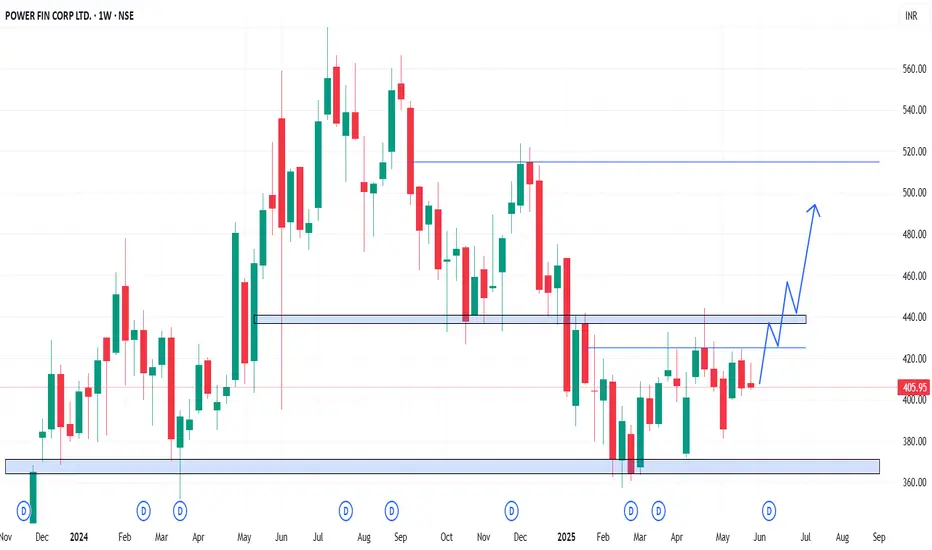
In the Weekly Chart of PFC ,
we can see that; 420-425 levels has shown strong rejection but selling has not been strong as per rejection.
Above 420 it ill bullish till 520 levels.
Trade as per your and Analysis
Expected momentum is shown in chart.
we can see that; 420-425 levels has shown strong rejection but selling has not been strong as per rejection.
Above 420 it ill bullish till 520 levels.
Trade as per your and Analysis
Expected momentum is shown in chart.
כתב ויתור
המידע והפרסומים אינם אמורים להיות, ואינם מהווים, עצות פיננסיות, השקעות, מסחר או סוגים אחרים של עצות או המלצות שסופקו או מאושרים על ידי TradingView. קרא עוד בתנאים וההגבלות.
כתב ויתור
המידע והפרסומים אינם אמורים להיות, ואינם מהווים, עצות פיננסיות, השקעות, מסחר או סוגים אחרים של עצות או המלצות שסופקו או מאושרים על ידי TradingView. קרא עוד בתנאים וההגבלות.