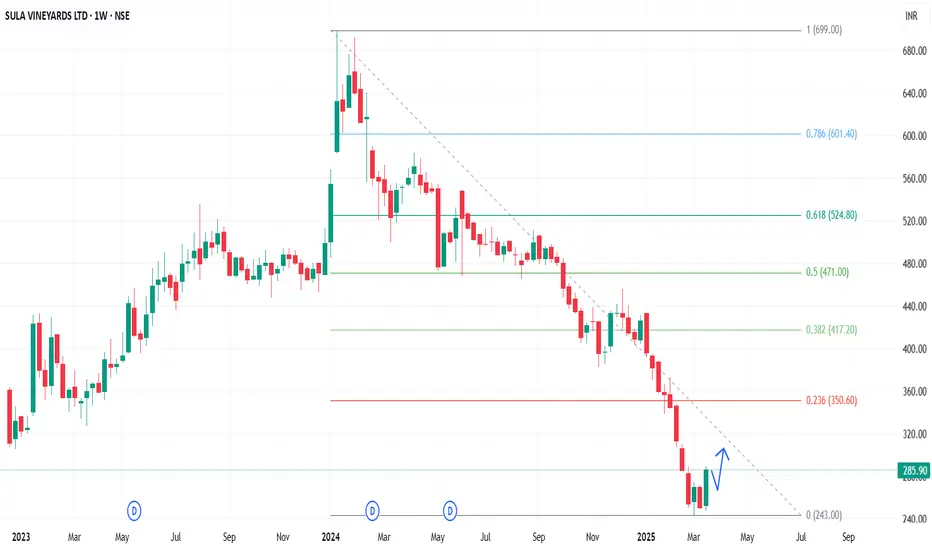
In the Weekly Chart of SULA ,
we can see that; it is showing a W shape recovery from 240-245 level.
wait for a Halt or retrace candle and then enter with SL and Targets.
Expected momentum is shared in chart.
we can see that; it is showing a W shape recovery from 240-245 level.
wait for a Halt or retrace candle and then enter with SL and Targets.
Expected momentum is shared in chart.
כתב ויתור
המידע והפרסומים אינם מיועדים להיות, ואינם מהווים, ייעוץ או המלצה פיננסית, השקעתית, מסחרית או מכל סוג אחר המסופקת או מאושרת על ידי TradingView. קרא עוד ב־תנאי השימוש.
כתב ויתור
המידע והפרסומים אינם מיועדים להיות, ואינם מהווים, ייעוץ או המלצה פיננסית, השקעתית, מסחרית או מכל סוג אחר המסופקת או מאושרת על ידי TradingView. קרא עוד ב־תנאי השימוש.