As the US government shutdown continues, many central banks continue to increase their gold holdings. Coupled with Trump's new tariffs and geopolitical implications, the market continues to release bullish signals, contributing to a pattern of gold prices hitting new highs. Yesterday, gold in the US market tested the resistance of 3960-3970 as expected and then fell back to around 3945. Those brothers who followed the trading strategy and went short must have made good profits.
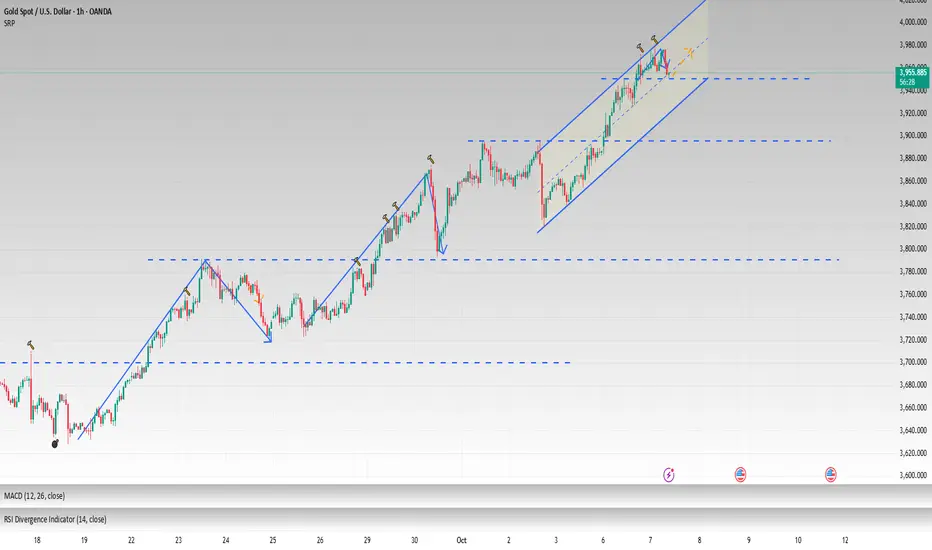
As time goes by and the price of gold continues to rise, the short-term lows are also moving higher. Gold continued to rise in the Asian session today, reaching a high of around 3977 before falling back. In the short term, pay attention to the support level below 3955-3940. If it falls back for the first time during the day, you can consider going long on gold.
In addition, observing previous gold price trends, we can see that every time gold breaks through a new high, it will experience a pullback of approximately $70-80 to accumulate momentum after hitting channel resistance. According to this trend pattern, combined with the rising channel of our chart, we can find that the next suppression point is at 3985-4000.
Overall, gold remains bullish in the medium to long term, but may experience short-term technical adjustments. The core trading strategy remains primarily long gold, supplemented by short positions. If the price falls back to the 3955-3940 range for the first time during the day, you can consider buying gold in batches according to the strength of the pullback, with the target at 3985-4000. After the resistance level is reached and under pressure, you can consider shorting gold appropriately based on the market trend.
פרסומים קשורים
כתב ויתור
המידע והפרסומים אינם מיועדים להיות, ואינם מהווים, ייעוץ או המלצה פיננסית, השקעתית, מסחרית או מכל סוג אחר המסופקת או מאושרת על ידי TradingView. קרא עוד ב־תנאי השימוש.
פרסומים קשורים
כתב ויתור
המידע והפרסומים אינם מיועדים להיות, ואינם מהווים, ייעוץ או המלצה פיננסית, השקעתית, מסחרית או מכל סוג אחר המסופקת או מאושרת על ידי TradingView. קרא עוד ב־תנאי השימוש.