Levels by Touches (v2) [chingybrooks]Levels by Touches (v2)
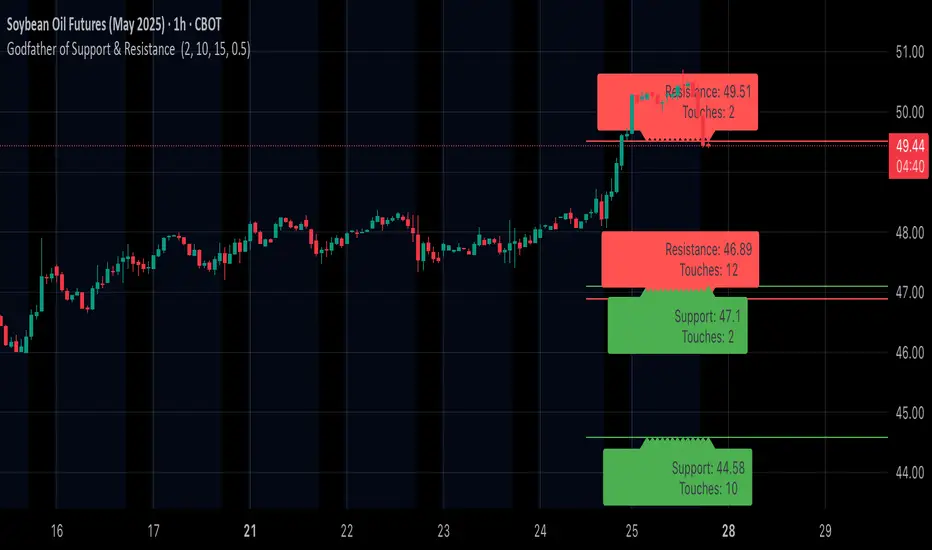
This script scans the last N bars to identify significant support and resistance levels by counting wick-touches.
How it works:
1. Wick detection – marks a touch whenever upper or lower wick ≥ X% of candle body (or on doji)
2. Level grouping – merges touches within a tolerance of Y ticks
3. Touch weighting – recent touches (in the latter half of lookback) count Z× more
4. Filtering – only plots levels with ≥ M total touches
Inputs:
Bars to scan (N): lookback period (max 200 bars)
Min touches (M): minimum hits to qualify as a level
Tolerance (ticks): price “slop” for grouping nearby touches
Min wick %: wick size threshold as % of body
Recent touch weight (Z): multiplier for touches in the latest half
Use this indicator to spot high-probability S/R zones based on actual price rejections.
אינדיקטור Pine Script®