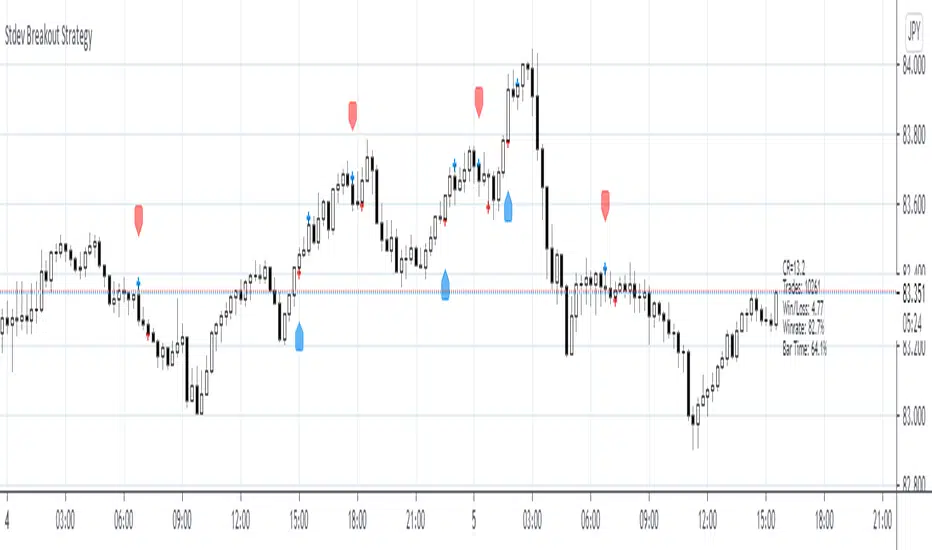
Bollinger Bands are price channels, or bands, that are plotted above and below price. The outer Bollinger Bands are based on price volatility, which means that they expand when the price fluctuates and trends strongly, and the Bands contract during sideways consolidations and low momentum trends. By using a combination of several indicators, we try to predict the...
I didn't find a study for Inside bar as I wanted. Therefore I wrote a one with PineV4. This may help you to see inside bars. It can recalculate and works with either (opens-closes) or (highs-lows) Cheers! :)
This script draws real time trend lines from swing highs and lows which will automatically draw your trend lines for you. Extremely useful for catching a trend confirmation and triangle break outs. This is best used with the CFT Auto Support & Resistance Indicator and CFT Buy Sell Signals for additional confirmations. If you need any help just message me.
A Simple indicator combining 3 of the most popular Oscillators RSI, MacD and Momentum to help see reversals or the continuation of a trend. Designed with the COINBASE:BTCUSD chart in mind but there's not reason it shouldn't work on any other asset. The indicator has two main parts: - The gray area at the top between the purple dotted lines is 3 RSI's in one...
A Simple indicator combining 3 of the most popular simple moving averages; (21,55, 200) with a tweaked Parabolic SAR as well as recent support & resistance points. Developed to help see key areas of interest on COINBASE:BTCUSD quickly without needing to draw many manual trendlines in order to trade breakouts or bounces at key levels. But should be useful for...
Its a break-out strategy with simple rules and strict money management (every trade risk 1% of the equity) Entry happens on breakout of significant swing points. Initial stop loss is on the opposite swingpoint and will be trailed by multiple factors including a maximum distance to the current price. Works best on BTCUSD on H4. Also good results on higher...
It isn't easy to determine if the price of a stock is about to break out. Here’s one way you can determine the relative strength of a breakout, enabling you to act early and realize higher profits. This indicator was originally developed by Howard Wang Stocks & Commodities V. 33:09 (60–62)
This is the development version of the Exzyle/Pipsanee Bollinger Band Breakout indicator and alerts. Bollinger Band breakouts are tagged with an arrow showing the direction they are heading. The alerts trigger only on the first breakout. This code also includes a MACD Retracement indicator.
The Auto Squeeze Breakout Bars find bars that are breaking out of a low volatility environment into a high volatility environment. The Squeeze shading is signaled when the volatility of the asset is very low. Then the Squeeze Breakout Bars are signaled when the asset is breaking out of this low volatility structure. Warning bars will be signaled when it is...
Today we have a simple, but endlessly versatile, indicator that plots the X Period High/Low/Mid of your chosen market. Traditionally the 52 week High/Low is used as a breakout signal. However, by changing to an X period, and adding a midway line, we create a more versatile indicator that can be tailored to various markets. By default it's set at 250 periods...
WHERE EVER THE GREEN DOT IS THATS THE DIRECTION YOU CAN GO. IF YOU USE THE SL (RED DOT) YOU CAN BUT I PERSONALLY USE MY OWN STOP LOSS. IF YOUR INTRESTED IN THE INDIE AND HAVING ACCESS PLEASE EMAIL ME. mickyle2@gmail.com
This indicator is free to all Oasis Trading Group members. The Improved CCI is a basic CCI with a momentum gauge applied to the zero line. This indicator is used to find breakouts/breakdowns and when they have lost momentum. A bullish entry would be found when the CCI has broken the 100 line when the Momentum gauge is above zero or when the CCI has crossed...
Dear all, Free strategy again. This strategy consists of 2 indicators I think works well with each other as a trend following strategy. The 2 indicators are Renko chart and Relative Vigor Index. This is a long-only breakout strategy that aims to capture the majority of the trend. Works well on BTCUSD XBTUSD, as well as other major liquid Pair. Please...
Symbol appears on the top of candle wait for close and sell. If candle appears below the candle wait for close and buy. Indie also has key levels of support and resistance if your interested....please email me @mickyleroland2@gmail.com
A ZigZag Like based on candle close. A lot of options that can be hide in options. Triangle/bright - reversal confirmation candle Circle/dark - higher/lower candle breakout Square/light - Insidebar
đây là công cụ bắt đỉnh đáy tốt nhất hiện nay. mình áp dụng rất hiệu quả. chia sẽ cho các bạn !!
TBO (Trending Break Out) is an indicator designed to help identify trends within the markets. Users are able to see trend continuations and potential trend reversals. Potential breakouts are also shown as trend strength increases or decreases. There are buy signals and short signals included as well. Clouds show underlying support or resistance areas and potential...
BORC, or Breakout Reversal Confirmation, is a signal based TV Indicator that analyzes multi-period price movements to determine when to enter in oversold and overbought tradeable assets. It works in any time frame and any type of security. Green triangle means buy Red Triangle means to get ready for the buy signal $60 for lifetime access + complimentary PDF with...