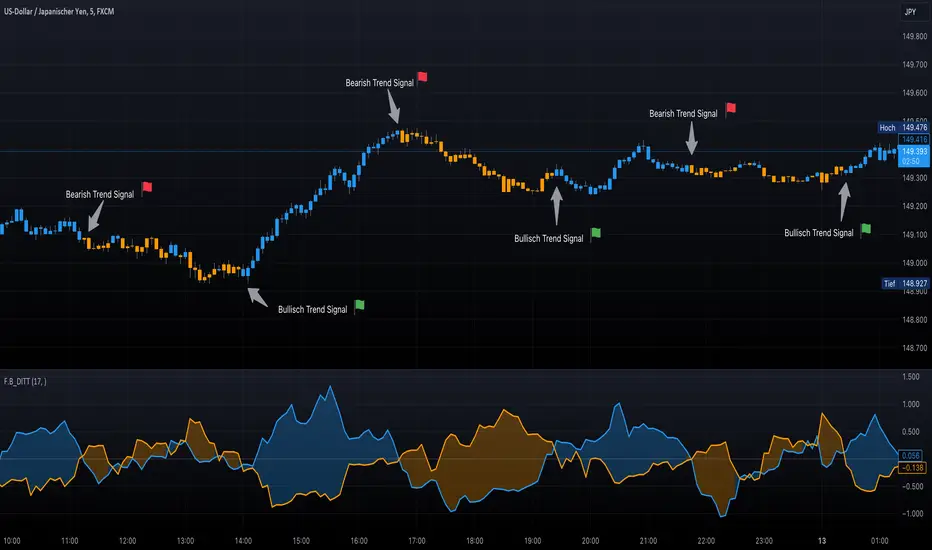
F.B_DI+ DI- Trend TrackerThe F.B_DI+ DI- Trend Tracker is an indicator developed based on Directional Movement and True Range to identify trends in the market and assess their strength. Here is the logic behind the indicator and how to use it for trading:
Direction Determination
Unlike traditional DI+ and DI- based on simple calculations, this indicator utilizes derived versions of these directional indicators. These derived versions offer a more precise measurement of price directional movements by specifically tailoring to market conditions and the chosen time frame.
Trend Strength
The derived directional indicators are generated by dividing smoothed Directional Movements by smoothed True Range and converting them into percentages. These values provide insights into the strength of the trend by considering directional movements relative to market volatility.
Identifying Trend Reversals
To capture changes in trend strength more accurately, the first derivative of DI+ and DI- is computed. A crossover of these derived versions could indicate a potential trend reversal, with a crossover of DI+ over DI- suggesting a possible uptrend and a crossover of DI- over DI+ indicating a potential downtrend.
Making Trading Decisions
Traders can use crossovers between the derived DI+ and DI- to receive signals for potential trend reversals. Additionally, changes in the color of candlesticks or background can be used as confirmation of the trend direction and its strength.
By utilizing these derived directional indicators, the F.B_DI+ DI- Trend Tracker indicator offers more precise trading signals and improved trend analysis, enabling traders to make informed trading decisions.
מדד תנועה כיווני (DMI)
Easy To Trade indicatorAbstract
This script evaluates how easy for traders to trade.
This script computes the level that the gains were distributed in many trading days.
We can use this indicator to decide the instruments and the time we trade.
Introduction
Why we think the trading markets are boring?
It is because most of the gains were concentrated in a few trading days.
We look for instruments we can buy at support and sell at resistance frequently and repeatedly.
However, it does not happen usually because it is difficult to find sellers sell at support and buyers buy at resistance.
This script is a method to measure if an instrument is difficult to trade.
If most of the gains were concentrated in a few trading days, this script says it is difficult to trade.
If gains were distributed in many trading days and we can buy low and sell high repeatedly, this script says it is easy to trade.
Therefore, this script measure how difficult for us to trade by the ratio between the area of value and the total gain.
How it works
1. Determine the instruments and time frames we are interested in.
2. Determine how many days this script evaluate the result. This number may depend on how many days from you buy in to you sell out.
3. If the instrument you choose is easy to trade, this script reports higher values.
4. If the instrument is long term bullish, the number "easy to invest" is usually higher than the number "easy to short" .
5. We can consider trade instruments which are easier to trade than others.
6. We can consider wait until the period that it is difficult to trade has past or keep believing that some instruments are easier to trade than others.
Parameters
x_src = The price for each trading day this script use. It may be open , high , low , close or their combination.
x_is_exp = Whether this script evaluate the price movement in exponential or logarithm. You are advised to answer yes if the price changes drastically.
x_period = How many days this script evaluate the result.
Conclusion
With this indicator , we have data to explain how easy or difficult an instrument is for traders . In other words , if we hear some people say the trading markets are boring or difficult for traders , we can use this indicator to verify how accurate their comments are.
With this explainable analysis , we have more knowledge about which instruments and which sessions are relative easy for us to buy low and sell high repeatedly and frequently , we can have better proceeding than buy and hold simply.

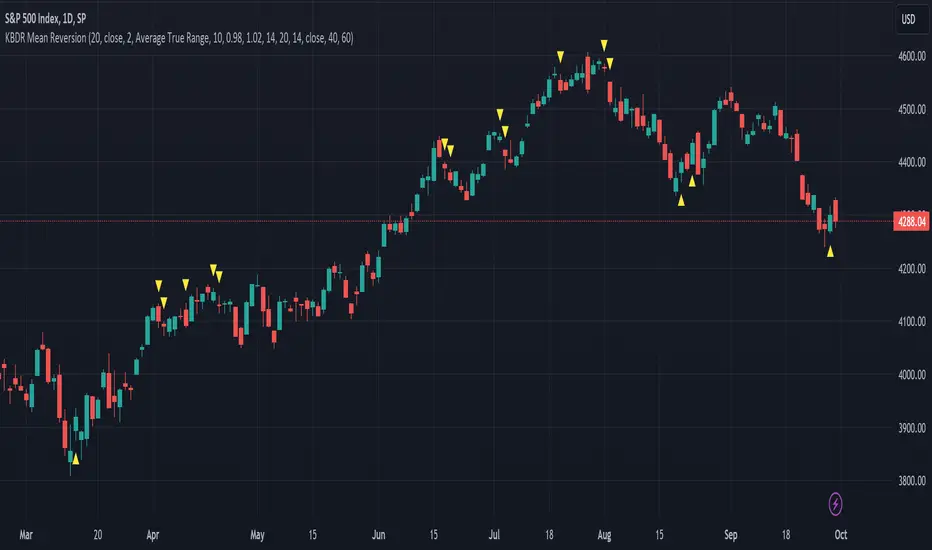
[dharmatech] KBDR Mean ReversionBased on the criteria described in the book "Mean Revision Trading" by Nishant Pant.
Bullish signal criteria:
Bollinger Bands must be outside Keltner Channel
Price near bottom bband
DI+ increasing
DI- decreasing
RSI near bottom and increasing
Bearish signal criteria:
Bollinger Bands must be outside Keltner Channel
Price near upper bband
DI+ decreasing
DI- increasing
RSI near upper and decreasing
A single triangle indicates that all 4 criteria are met.
If letters appear with the triangle, this indicates that there was a partial criteria match.
K : bbands outside Keltner
B : bbands criteria met
D : DI criteria met
R : RSI criteria met
You can use the settings to turn off partial signals. For example:
"Partial 3" means show signals where 3 of the criteria are met.
If you want more insight into the underlying criteria, load these indicators as well:
Bollinger Bands (built-in to TradingView)
Keltner Channels (built-in to TradingView)
RSI (built-in to TradingView)
ADX and DI
Warning:
Not meant to be used as a stand-alone buy/sell signal.
It regularly provides signals which would not be profitable.
It's meant to be used in conjunction with other analysis.
Think of this as a time-saving tool. Instead of manually checking RSI, DI+/DI-, bbands, distance, etc. this does all of that for you on the fly.
Heeger Alert | Didi's Needles setup [HeegerBot]Indicator based on Color Candles - Didi's Needles setup , but now exclusively focused on generating alerts.
With this indicator, you can set up alerts and notifications on TradingView for up to 15 assets based on Didi Aguiar's setup. Additionally, you can specify whether the alert should trigger at the candle close or X minutes before the close.
A session filter has also been added, allowing you to configure alerts to trigger only during a specific session.
Description of monitored signals:
The setup involves the crossing of three moving averages, along with the trend analysis in the ADX and the open Bollinger Bands.
The moving averages will be named "Didi Index". We will have the 3-period average as "Fast Average", the 8-period average as "Median Average", and the 20-period average as "Slow Average". When the Fast Average crosses the Median Average, we will have an alert, and when the Slow Average crosses the Median Average, we will have a confirmation. To adjust the Didi Index in the signals, the Median Average was normalized, that is, it will always be equal to 0. For the Slow and Fast Average, we will only consider the percentage difference in relation to the Median Average.
In addition to the moving averages, we analyze whether the ADX is rising, with DI+ above DI- to indicate an uptrend, or if the ADX is rising, with DI- above DI+ to indicate a downtrend. We also check if the Bollinger Bands are open. With these conditions, we will have a Needle.
Now I'm going to detail how I set this up on the indicator and some filters that I inserted for my personal use, along with some additional signals from the setup.
# Needle Alert
Firstly, we have the "Needle Alert" signal. This signal occurs when the Fast Average crosses the Median Average, along with the trend confirmation in the ADX and the opening of the Bollinger Bands. The filter is set at "1", which means we will only consider the needle alert when the percentage difference between the Slow Average and the Median Average is below 1%. This signal can be used as an entry point or to monitor the asset. Let's go through the examples:
• For a "Buy Alert", the Fast Average must cross the Median Average from bottom to top, and the percentage difference between the Slow Average and the Median Average should be less than +1% and greater than 0, as indicated by the Didi Index.
• For a "Sell Alert", the Fast Average must cross the Median Average from top to bottom, and the percentage difference between the Slow Average and the Median Average should be greater than -1% and less than 0, as indicated by the Didi Index.
We also have the alert projection, which serves as a signal to attract attention and monitor the asset. I use a "0.1" filter, which means that the percentage difference between the Fast Average and the Median Average must be equal to or less than 0.1%. Let's look at the example:
• For a "Buy Alert Projection", the Fast Average should be below the Median Average, and the percentage difference between the Fast Average and the Median Average should be greater than -0.1% and less than 0. In addition, the Slow Average should be above the Median Average in the Didi Index.
• For a "Buy Alert Projection", the Fast Average should be below the Median Average, and the percentage difference between the Fast Average and the Median Average should be greater than -0.1% and less than 0. In addition, the Slow Average should be above the Median Average in the Didi Index.
# Needle
After the Needle Alert, we have the Needle Confirmation, which occurs when the Slow Average crosses the Median Average after the alert. This signal is used to enter the operation. Let's divide this signal into two parts:
1. Needle: We use a filter of "3" (adjustable). This means that, to be considered a "Needle", the candle distance between the Alert (crossing of the Fast Average with the Median Average) and the Confirmation (crossing of the Slow Average with the Median Average) must be equal to or less than 3 candles. Also, there needs to be a trend on the ADX and the Bollinger Bands should be open.
2. Queijo Minas Needle (QM): Essentially, it's a Needle that occurs outside of the filter, with a candle distance between the Alert and the Confirmation above "3" candles. A trend on the ADX and open Bollinger Bands are also necessary.
To anticipate the Needle Confirmation, we use the "Needle Projection" signal. This signal has two filters: the "Needle Projection with Alert", set as "0.1%", and the "Needle Projection after the Alert", set as "0.3%".
1. The "Needle Projection with Alert" generates the signal when the "Needle Alert" occurs (crossing of the Fast Average with the Median Average), as long as the difference between the Slow Average and the Median Average is less than 0.1%.
2. The "Needle Projection after the Alert" generates the signal when the Fast Average has already crossed the Median Average, and the difference between the Slow Average and the Median Average should be less than 0.3%.
# BJMA (Spider Woman's Kiss)
There is another variation of the needle called BJMA. Essentially, it occurs when the Fast Average and the Slow Average approach the Median Average (each on one pole), but do not cross the Median and return to where they came from. In this signal, we have two filters: "Delta BJMA previous candle" and "Delta BJMA current candle". Let's see an example:
• Buy BJMA: First, we observe the previous candle, where the Fast Average must be above 0 (above the Median Average) and the percentage difference should be less than 0.02. In relation to the Slow Average, the configuration is the same, but in the negative sense, that is, it should be below 0 and above -0.02. Now, in the current candle, the Fast Average should be above 0 and below 0.05, while the Slow Average should be below 0 and above -0.05.
• Sell BJMA: First, we observe the previous candle, where the Fast Average must be below 0 (below the Median Average) and the percentage difference should be greater than -0.02. In relation to the Slow Average, the configuration is the same, but in the positive sense, that is, it should be above 0 and below 0.02. Now, in the current candle, the Fast Average should be below 0 and above -0.05, while the Slow Average should be above 0 and below 0.05.
Now, let's look at two signals that are commonly used to stay in a position.
# Fake Point
The Fake Point is primarily used to identify retracements before a continuation of the prevailing trend. Typically, it is preceded by a Needle Confirmation or BJMA signal. Here are some examples:
• Fake Sell (Signal to Maintain a Buy Position): The Fast Average crosses the Median from top to bottom (entering the negative pole of the Didi Index), while the Slow Average, which is already below the Median (below 0), continues to decline further, increasing the percentage difference between the Fast and Slow Averages in the negative pole.
• Fake Buy (Signal to Maintain a Sell Position): It is the same as the fake sell scenario but in the positive pole. The Fast Average crosses the Median, entering the positive pole of the Didi Index, while the Slow Average, which was already above the Median, continues to increase the percentage difference with the Median. For example, if the Slow Average was at +1 on the Didi Index, it would now be at +1.3.
There is also another variation of the Fake Breakout that takes into consideration the ADX (Average Directional Index) to confirm the trend direction. In other words, if we have a fake sell signal that suggests a buy position, we want the ADX to indicate a buying trend, and vice versa.
# Bought and Sold
This signal basically checks whether the indicators continue to confirm the previous signals. There are two variations: "Bought/Sold" and "Bought/Sold without Bollinger Bands". Let's see an example:
• Bought: The Didi Index is in the buying position, which means the Fast Average is above the Median Average (above 0), and the Slow Average is below the Median Average. Additionally, the ADX is indicating a buying trend and the Bollinger Bands are open.
• Sold: The Didi Index is in the selling position, which means the Fast Average is below 0 and the Slow Average is above 0. Moreover, the ADX is indicating a selling trend and the Bollinger Bands are open.
• Bought/Sold without Bollinger Bands: It's the same signal, but without considering whether the Bollinger Bands are open or not.
We can also consider the "Bought/Sold" signal based on the Trix and Stochastic, which would be additional confirmations of the movement.
Personally, I do not activate the Bought/Sold signal.
Now we come to signals to exit the position or take partial profits.
# Close
This exit signal is based on the following indicators: ADX, Bollinger Bands, Trix, and Stochastic. We wait for the ADX Kick or the falling ADX, along with the Bollinger Bands closing, and the Trix and Stochastic changing to the opposite side. Let's see some examples:
• Close a Buy: The ADX was in a buying trend (ADX rising and DI+ above DI-), but then the ADX Kick occurs or the ADX starts to fall. In addition, the Bollinger Bands close, and the Trix and Stochastic should switch to the sell signal.
• Close a Sell: The ADX was in a selling trend (ADX rising and DI- above DI+), but then the ADX Kick occurs or the ADX starts to fall. Also, the Bollinger Bands close, and the Trix and Stochastic should switch to the buy signal.
All indicators must provide signals together, but it is not necessary for all to occur in the exact same candle. For example:
1. The ADX Kick may occur, and the Trix and Stochastic switch to the buy signal, but the Bollinger Bands still remain open. In this case, we still do not have the exit signal.
2. In the next candle, the ADX continues to fall (after the Kick), the Trix and Stochastic continue to indicate buying, but this time the Bollinger Bands close. In this case, we have the "Close a Sell" signal.
It is important that all indicators are in accordance with the necessary signals, even if they occur in different candles, in order for the exit signal to be triggered.
# Close with Alert
This signal occurs when the Didi Index switches to the opposite side from where it was, along with a trend on the ADX, provided it's not a fake point. Let's see some examples:
• Close Buy - Sell Alert: Suppose we were in a buy position on the previous candle. In the current candle, the Fast Average crosses the Median Average from top to bottom, and the ADX indicates a sell trend. In this case, we completely close our buy position or make a partial realization.
• Close Sell - Buy Alert: Suppose we were in a sell position on the previous candle. In the current candle, the Fast Average crosses the Median Average from bottom to top, and the ADX indicates a buy trend. In this case, we completely close our sell position or make a partial realization.
------------------------------------------------------------------------------------------------------------------------------------------------------------------------------------------------------------------
Indicador baseado no Color Candles - Didi's Needles setup , mas agora focado exclusivamente na geração de alertas.
Com esse indicador, você pode configurar alertas e notificações no TradingView para até 15 ativos com base no setup de Didi Aguiar. Além disso, é possível definir se o alerta deve ser acionado no fechamento do candle ou X minutos antes do fechamento.
Também foi adicionado um filtro de sessão que permite configurar os alertas para serem acionados apenas durante uma sessão específica.
Descrição dos sinais monitorados:
O setup consiste no cruzamento de 3 médias móveis, juntamente com a análise da tendência no ADX e das bandas de Bollinger abertas.
As médias móveis serão nomeadas "Didi Index". Teremos a média de 3 períodos como "Média Rápida", a média de 8 períodos como "Média Mediana" e a média de 20 períodos como "Média Lenta". Quando a Média Rápida cruzar a Média Mediana, teremos um alerta e, quando a Média Lenta cruzar a Média Mediana, teremos uma confirmação. Para ajustar o Didi Index nos sinais, a Média Mediana foi normalizada, isto é, ela sempre será igual a 0. Para a Média Lenta e a Média Rápida, levaremos em consideração apenas a diferença percentual em relação à Média Mediana.
Além das médias móveis, analisamos se o ADX está em ascensão, com o DI+ acima do DI- para indicar uma tendência de alta, ou se o ADX está subindo, com o DI- acima do DI+ para indicar uma tendência de baixa. Também verificamos se as bandas de Bollinger estão abertas. Com essas condições, teremos uma Agulhada.
Agora vou detalhar como estabeleci isso no indicador e alguns filtros que inseri para o meu uso pessoal, além de alguns sinais adicionais do setup.
# Alerta de Agulhada
Primeiramente, temos o sinal de "Alerta de Agulhada". Este sinal acontece quando a Média Rápida cruza a Média Mediana, junto com a confirmação da tendência no ADX e a abertura das Bandas de Bollinger. O filtro está ajustado em "1", o que significa que só levaremos em consideração o alerta de agulhada quando a diferença percentual entre a Média Lenta e a Média Mediana estiver abaixo de 1%. Esse sinal pode ser utilizado como um ponto de entrada ou para monitorar o ativo. Vamos aos exemplos:
• Para um "Alerta de Compra", a Média Rápida deve cruzar a Média Mediana de baixo para cima, e a diferença percentual entre a Média Lenta e a Média Mediana deve ser menor que +1% e maior que 0, conforme indicado pelo Didi Index.
• Para um "Alerta de Venda", a Média Rápida deve cruzar a Média Mediana de cima para baixo, e a diferença percentual entre a Média Lenta e a Média Mediana deve ser maior que -1% e menor que 0, conforme indicado pelo Didi Index.
Também temos a projeção do alerta, que serve como um sinal para chamar atenção e monitorar o ativo. Eu uso um filtro de "0.1", o que significa que a diferença percentual entre a Média Rápida e a Média Mediana deve ser igual ou menor que 0.1%. Vamos ver o exemplo:
• Para uma "Projeção de Alerta de Compra", a Média Rápida deve estar abaixo da Média Mediana, e a diferença percentual entre a Média Rápida e a Média Mediana deve ser maior que -0.1% e menor que 0. Além disso, a Média Lenta deve estar acima da Média Mediana no Didi Index.
• Para uma "Projeção de Alerta de Compra", a Média Rápida deve estar abaixo da Média Mediana, e a diferença percentual entre a Média Rápida e a Média Mediana deve ser maior que -0.1% e menor que 0. Além disso, a Média Lenta deve estar acima da Média Mediana no Didi Index.
# Agulhada
Após o Alerta de Agulhada, temos a confirmação da Agulhada, que ocorre quando a Média Lenta cruza a Média Mediana após o alerta. Esse sinal é utilizado para entrar na operação. Vamos dividir esse sinal em duas partes:
1. Agulhada: Utilizamos um filtro de "3" (ajustável). Isso significa que, para ser considerada uma "Agulhada", a distância em velas entre o Alerta (cruzamento da Média Rápida com a Média Mediana) e a Confirmação (cruzamento da Média Lenta com a Média Mediana) deve ser igual ou menor que 3 velas. Além disso, é necessário ter uma tendência no ADX e as Bandas de Bollinger devem estar abertas.
2. Agulhada Queijo Minas (QM): Basicamente, é uma agulhada que ocorre fora do filtro, com uma distância em velas entre o Alerta e a Confirmação acima de "3" velas. Também é necessário ter uma tendência no ADX e as Bandas de Bollinger devem estar abertas.
Para antecipar a confirmação da Agulhada, utilizamos o sinal de "Projeção de Agulhada". Esse sinal possui dois filtros: o "Projeção de Agulhada com Alerta", configurado como "0.1%", e o "Projeção de Agulhada após o Alerta", configurado como "0.3%".
1. "Projeção de Agulhada com Alerta" gera o sinal quando ocorre o "Alerta de Agulhada" (cruzamento da Média Rápida com a Média Mediana), desde que a diferença entre a Média Lenta e a Média Mediana seja menor que 0.1%.
2. "Projeção de Agulhada após o Alerta" gera o sinal quando a Média Rápida já cruzou a Média Mediana, e a diferença entre a Média Lenta e a Média Mediana deve ser menor que 0.3%.
# BJMA (Beijo da Mulher Aranha)
Existe uma outra variação da agulhada chamada BJMA. Essencialmente, ocorre quando a Média Rápida e a Média Lenta se aproximam da Média Mediana (cada uma em um polo), mas não cruzam a Mediana e voltam para o lado de onde vieram. Nesse sinal, temos dois filtros: "Delta BJMA vela anterior" e "Delta BJMA vela atual". Vejamos um exemplo:
• BJMA de Compra: Primeiramente, observamos a vela anterior, onde a Média Rápida deve estar acima de 0 (acima da Média Mediana) e a diferença percentual deve ser menor que 0.02. Em relação à Média Lenta, a configuração é a mesma, porém no sentido negativo, ou seja, ela deve estar abaixo de 0 e acima de -0.02. Agora, na vela atual, a Média Rápida deve estar acima de 0 e abaixo de 0.05, enquanto a Média Lenta deve estar abaixo de 0 e acima de -0.05.
• BJMA de Venda: Primeiramente, observamos a vela anterior, onde a Média Rápida deve estar abaixo de 0 (abaixo da Média Mediana) e a diferença percentual deve ser maior que -0.02. Em relação à Média Lenta, a configuração é a mesma, porém no sentido positivo, ou seja, ela deve estar acima de 0 e abaixo de 0.02. Agora, na vela atual, a Média Rápida deve estar abaixo de 0 e acima de -0.05, enquanto a Média Lenta deve estar acima de 0 e abaixo de 0.05.
Agora vamos abordar dois sinais que são normalmente utilizados para manter uma posição.
# Ponto Falso (Fake Point)
O Ponto Falso é usado para identificar uma retração antes de retomar o movimento. Geralmente, ele ocorre após um sinal de Agulhada ou BJMA. Vejamos exemplos:
• Venda Falsa (sinal para manter uma posição de compra): A Média Rápida cruza a Média Mediana de cima para baixo (entrando no polo negativo do Didi Index), enquanto a Média Lenta, que já está abaixo da Média Mediana (abaixo de 0), continua caindo, aumentando assim a diferença percentual entre a Média Lenta e a Média Mediana no polo negativo.
• Compra Falsa (sinal para manter uma posição de venda): O cenário é semelhante, mas no polo positivo. A Média Rápida cruza a Média Mediana, passando para o lado positivo do Didi Index, enquanto a Média Lenta, que já estava acima da Média Mediana, continua aumentando a diferença percentual em relação à Média Mediana. Por exemplo, se a Média Lenta estava em +1 no Didi Index, agora ela está em +1.3.
Também existe uma variação do Ponto Falso em que verificamos se a tendência no ADX está se mantendo na mesma direção. Ou seja, se tivermos uma Venda Falsa (que seria um sinal para permanecermos em uma posição de compra), é importante que o ADX esteja indicando uma tendência de compra, e vice-versa. Dessa forma, consideramos não apenas o cruzamento das médias, mas também a confirmação da tendência no ADX. Essa variação é chamada de Ponto Falso com Tendência (Fake Point with Trend).
# Comprado e Vendido
Esse sinal, essencialmente, verifica se os indicadores estão mantendo a confirmação dos sinais anteriores. Existem duas variações: "Comprado/Vendido" e "Comprado/Vendido sem Bandas de Bollinger". Vejamos um exemplo:
• Comprado: O Didi Index está em compra, o que significa que a Média Rápida está acima da Média Mediana (acima de 0) e a Média Lenta está abaixo da Média Mediana. Além disso, o ADX está indicando uma tendência de compra e as Bandas de Bollinger estão abertas.
• Vendido: O Didi Index está em venda, o que significa que a Média Rápida está abaixo de 0 e a Média Lenta está acima de 0. Além disso, o ADX está indicando uma tendência de venda e as Bandas de Bollinger estão abertas.
• Comprado/Vendido sem Bollinger: É o mesmo sinal, porém sem considerar se as Bandas de Bollinger estão abertas ou não.
Podemos também considerar o "Comprado/Vendido" com base no Trix e no Estocástico, que seriam confirmações adicionais do movimento.
Eu, pessoalmente, não deixo ativado o sinal de Comprado/Vendido.
Agora chegamos aos sinais de saída da posição ou de realização parcial.
# Fechar (Close)
Este sinal de saída baseia-se nos seguintes indicadores: ADX, Bandas de Bollinger, Trix e Estocástico. Aguardamos o Kick do ADX ou o ADX em queda, juntamente com as Bandas de Bollinger se fechando, e o Trix e o Estocástico mudando para o lado oposto. Vamos ver alguns exemplos:
• Fechar uma Compra (Close Buy): O ADX estava em uma tendência de compra (ADX subindo e DI+ acima do DI-), mas em seguida ocorre o Kick do ADX ou o ADX começa a cair. Além disso, as Bandas de Bollinger se fecham e o Trix e o Estocástico devem mudar para o sinal de venda.
• Fechar uma Venda (Close Sell): O ADX estava em uma tendência de venda (ADX subindo e DI- acima do DI+), mas em seguida ocorre o Kick do ADX ou o ADX começa a cair. Além disso, as Bandas de Bollinger se fecham e o Trix e o Estocástico devem mudar para o sinal de compra.
Todos os indicadores devem fornecer os sinais em conjunto, mas não é necessário que todos ocorram exatamente na mesma vela. Por exemplo:
1. Pode ocorrer o Kick do ADX e o Trix e o Estocástico mudarem para o sinal de compra, mas as Bandas de Bollinger ainda permanecerem abertas. Nesse caso, ainda não teremos o sinal de saída.
2. No candle seguinte, o ADX continua caindo (após o Kick), o Trix e o Estocástico continuam indicando compra, mas desta vez as Bandas de Bollinger se fecham. Nesse caso, teremos o sinal de "Fechamento de uma Venda".
É importante que todos os indicadores estejam em conformidade com os sinais necessários, mesmo que ocorram em velas diferentes, para que seja acionado o sinal de saída.
# Fechar com Alerta (Close with Alert)
Esse sinal ocorre quando o Didi Index muda para o lado oposto do que estava, juntamente com uma tendência no ADX, desde que não seja um ponto falso. Vejamos exemplos:
• Fechar Compra - Alerta de Venda: Suponha que estávamos em uma posição de compra no candle anterior. No candle atual, a Média Rápida cruza a Média Mediana de cima para baixo, e o ADX indica uma tendência de venda. Nesse caso, encerramos completamente nossa posição de compra ou realizamos uma realização parcial.
• Fechar Venda – Alerta de Compra: Suponha que estávamos em uma posição de venda no candle anterior. No candle atual, a Média Rápida cruza a Média Mediana de baixo para cima, e o ADX indica uma tendência de compra. Nesse caso, encerramos completamente nossa posição de venda ou realizamos uma realização parcial.

Directional Movement Index FLEXA common problem experienced by short term traders using DMI/ADX is that the session breaks results in carry-over effects from the prior session. For example, a large gap up would result in a positive DMI, even though momentum is clearly negative. Note the extremely different results in the morning session, when the gap is reversed.
The DMI-FLEX algoritm resets the +DI and -DI values to the prior session ending midpoint, so that new momentum can be observed from the indicator. (Note for Pinescript coders: rma function does not accept series int, thus the explicit pine_rma function)
DMI-FLEX has the added feature that the ADX value, instead of a separate line, is shown as shading between the +DI and -DI lines, and the color itself is determined by whether +DI is above -DI for a bullish color, or -DI is above +DI for a bearish color.
DMI Flex also gives you the flexibility of inverse colors, in case your chart has inverted scale.
Summary and How to use:
1) Green when +DI is above -DI
2) Red when -DI is above +DI
3) Deeper shading represents a higher ADX value.

ADXcellenceThis advanced trading indicator, inspired by Dr. Charles B. Schaap's book "ADXcellence: Power Trend Strategies", leverages the principles of the Average Directional Index (ADX) to help traders identify and exploit trending conditions in the market.
The ADXcellence Indicator uses multiple levels of analysis to evaluate the strength and direction of trends.
In addition to the classic ADX+DMI input settings, these features are included:
ADX Slope Signal: This parameter, controls the sensitivity of the ADX slope, which will indicate when the trend strength is increasing or decreasing.
The indicator provides three trend levels: strong trend level, trending level, and low volatility level, which can be customized to suit various trading strategies.
The color gradients for the ADX, DI+, and DI- lines are designed to visually represent the trend strength from the low volatility level to the strong trend level. The indicator also uses a dynamic background color, highlighting the periods when the ADX is rising. The color will vary depending on the dominant DI.
The ADXcellence Indicator also offers a unique feature of dynamically adjusting the fill between DI+ and DI-, with the color and fill intensity changing based on the relative value of the two.
This indicator is a powerful tool for traders who use trend-following strategies and is best used in conjunction with other technical analysis tools to confirm signals and avoid potential false signals.
Remember, no indicator is perfect and every trading strategy should include risk management and proper due diligence.
Enjoy :)

SumIndTarget:
The SumInd indicator combines Heiking Ashi, Sar Parabolic, Koncord, RSI, DMI, MACD and Bollinger Bands to give buy or sell signals or trends. This are called base indicators.
The goal is to have a clear and quick buy or sell suggestion and to avoid evaluating all or some of the named indicators, especially if they give contradictory signals among them. This speed and simplicity helps the trader to see several tickers in less time. It is intended for all markets and time periods where the above-mentioned indicators can be used.
How it works:
SumInd already has the importance or "weight" of each indicator named above configured, but they can be modified. You can set 0% for no use, or any other value based on the weight you want to give it, between 1% and 200% where 100% is the normal use, and increases or decreases based on importance.
Each base indicator can give signals to buy, sell or just "wait and see".
Each base indicator is checked for a buy signal, in which case its weight is added to the positive or green line, and if there is a sell signal, its weight is subtracted from the sell or red line. in case of indeterminacy or 'wait and see', nothing is added to any signal.
The yellow or total line is the sum of the buy or green signal plus the sell or red signal.
If the yellow or total line rises above the buy level, the background changes to green and an up arrow appears at the bottom of the chart indicating the buy suggestion, because most of the indicators you are interested in gave a buy signal.
If the yellow line or total falls below the sell level, the background changes to red and a downward arrow appears in the upper area of the chart indicating the sell suggestion, because most of the indicators you are interested in gave a sell signal.
The Buy and Sell level can be changed according to the security of the suggestion you need.
Areas without arrows or marks are considered "wait and see" areas, the previous trend in principle continues. They can be marked with the default background if desired from the SumInd settings.
Details and criterials:
Each of the following indicators can be turned on or off and assigned different weights of importances, by whether or not it shares the following criteria:
Heikin Ashi candles: add or subtract half an assigned weight if there is a buy or sell candle and the other half weight if there are two consecutive candles with the same signal.
RSI: Adds or subtracts the assigned weight if the ema is below or above the signal.
Parabolic Sar: Adds half a weight in transition to buy or sell and another half weight if there are two consecutive signals of the same trend.
Koncord: Add or subtract the weight if the current trend (mountain) grows or decreases respectively from the 4th previous time signal, and also the value (red line) is less than 35 or exceeds 65 respectively.
DMI: Adds or subtracts a quarter of the weight assigned by the DMI signal multiplied by the value of DMI, if the positive or negative signal exceeds the other negative or positive signal by 15% respectively.
Bollinger Bands: Add or subtract the weight if the previous third signal touches or falls out of the zone and keeps growing or decreasing respectively.
MACd: Add or subtract one third of the weight if the last 3 time signals are rising or falling, Add or subtract another third if the fast signal is above or below the slow signal, and Add or subtract the last third of the weight if it is rising with the negative fast signal, or falling with the positive fast signal.

Strength Index I2-SIIdea:
Enhance the Stoch RSI with DMI to get the visualization of the strength movement.
Concept:
(Note that we take the close to get the closing price).
-Combination of 2 Stoch RSI (using value K): 1 is UP, 1 is DOWN (these settings have been customized).
-Every time they cross, it calculates the direction of 3 nearly previous crossings to get the color of the current line.
-The value has been re-calculated with the processed value from ADX and DI- (That's why it can be more than 100 or -100 in some cases).
-RSI Overbuy and oversell are removed because the value could be beyond it.
How it works:
1. The line is show as the strength index of bars
- Green means the up strength is strong.
- Red means the down strength is strong.
- Gray means the previous strength is getting week.
2. This one can be used to find divergence.
3. This indicator provides a warning signal when the color of the line changes:
- Change color:
+Turn red: "Down Red"
+Turn green: "Up Green"
+Turn gray: "Down Gray"/"Up Gray"
Suitable time frames:
15m, 4h, 1D, 1W
* Please note that this logic does not attempt to predict future prices or 100% accurate signal.
(INVITE ONLY indicator. Please direct message or visit website if you want to try it out)
Hope you guys enjoy!
Examples:
BTCUSD 1D
XAUUSD 4H
EURUSD 1H
SPX 15m

DMI Stochastic Momentum IndexConcepts
This is an improved version of the "DMI Stochastic Extreme Refurbished" indicator.
For more information on the main concepts of this indicator, please access this link:
The difference is that here, instead of using the traditional stochastic oscillator, I implemented the use of the Stochastic Momentum Index (SMI).
Stochastic Momentum Index (SMI)
The SMI is considered a refinement of the stochastic oscillator.
It calculates the distance of the current closing price as it relates to the median of the high/low range of price.
William Blau developed the SMI, which attempts to provide a more reliable indicator, less subject to false swings.
The original stochastic is limited to values from 0 to 100, while the SMI varies between the range of -100 to 100.
(Investopedia)
It is worth mentioning that the SMI presented in this script applies to the DMI value, not the screen price.

Moving Average Directional IndexMADX is ADX-inspired indicator with moving averages that determines strength of a trend, as well as its direction. Indicator works following:
As the value of MADX increases, so does the strength of a trend
If MADX+ ( green line - bullish MADX ) crosses above MADX- ( red line - bearish MADX ) we consider trend as bullish and vice versa..
There will be situations where MADX- and MADX+ cross multiple times in a short period of time -> that will mean that market indecision is happening and big move will most likely happen after it.
For the calculation of MADX+ and MADX- we need Moving Averages or Exponential Moving Averages with three specific sources ( high, close, low ).
Now, the calculation of each MADX will differ
=> for MADX+: Moving Average (high) / Moving Average (close)
=> for MADX-: Moving Average (close) / Moving Average (low)
Length of Moving Average is editable.

Directional Movement RibbonWhat makes this different from directional movement index?
The aim is to reduce the amount of data analysis necessary before taking action; currently using DMI requires reviewing the DM+ and DM- plots, and ADX as well as review the overall trend of each one. Also there is the final analysis to determine whether a strong trend hasn’t been established at all.
This indicator condenses the information found from the standard DMI into an intuitive colored ribbon that reveals direction and strength at a glance.
How to use it?
Review the ribbon for sentiment based on color, green being bullish and red being bearish, (if using default color scheme). The brightness of the color determines the strength of the sentiment, brightest being strongest. If no color is represented at all then it is due to weakness and/or lack of direction.
Features
All colors customizable
Toggle display of indecision areas
Adjust levels considered strong, weak trends
Which markets is this meant for?
This can be used in any market, though it’s recommended to use with liquid markets where direction and strength can be found often.
What conditions?
Recommend to utilize with key levels and most commonly utilized moving average periods such as 20, 50, 100 or 200.

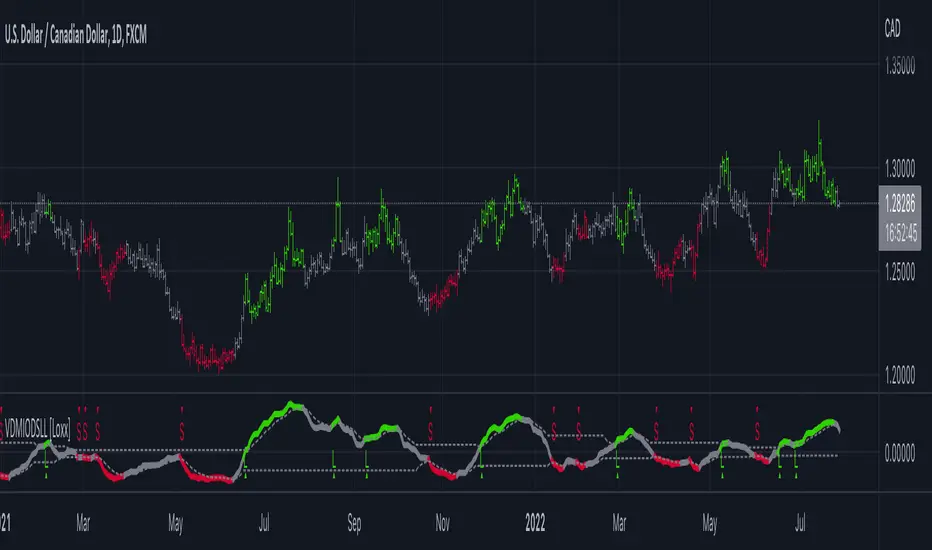
VIDYA DMI Oscillator w/ DSL Levels [Loxx]VIDYA DMI Oscillator w/ DSL Levels is a VIDYA smoothed Direction Movement Index with Discontinued Signals. These two add on features allow for more accurate signals by reducing noise.
What is the Direction Movement Index?
Within the suite of indicators that make up Wilder’s directional movement index (DMI) are the plus directional movement indicator (+DI) and the minus directional movement indicator (-DI). They provide the foundation for the more widely recognized average directional index (ADX). Whereas the ADX offers information about the strength of price movement but not its direction, the +DI and -DI furnish information about the positive or negative direction of price movement over a period of time.
Wilder provides complete information about the function and construction of all the components that make up the directional movement index in his 1978 book, New Concepts In Technical Trading Systems. In general, the plus and minus components of the DMI focus on that portion of the current bar’s trading range that is outside the range of the previous price bar. If it is higher, it is considered to be positive (+) and if it is lower, it is labeled negative (-). These values are divided by the true range and averaged over time, usually 14 periods. A move by the +DI above the -DI indicates that positive or upward price direction has overtaken negative or downward price direction. Conversely, when +DI falls below -DI, declining price either from selling pressure or lack of upward price momentum is taking control. Potential changes in direction or trend occur when the lines intersect.
What is VIDYA?
VIDYA (Chande's Variable Index Dynamic Average) is an adaptive weighted moving average indicator. It was developed by Tushar Chande as an attempt to improve the performance of the EMA (Exponential Weighted Moving Average) indicator.
Included:
Bar coloring
3 signal variations w/ alerts
4 intermediate smoothing types
Loxx's Expanded Source Types
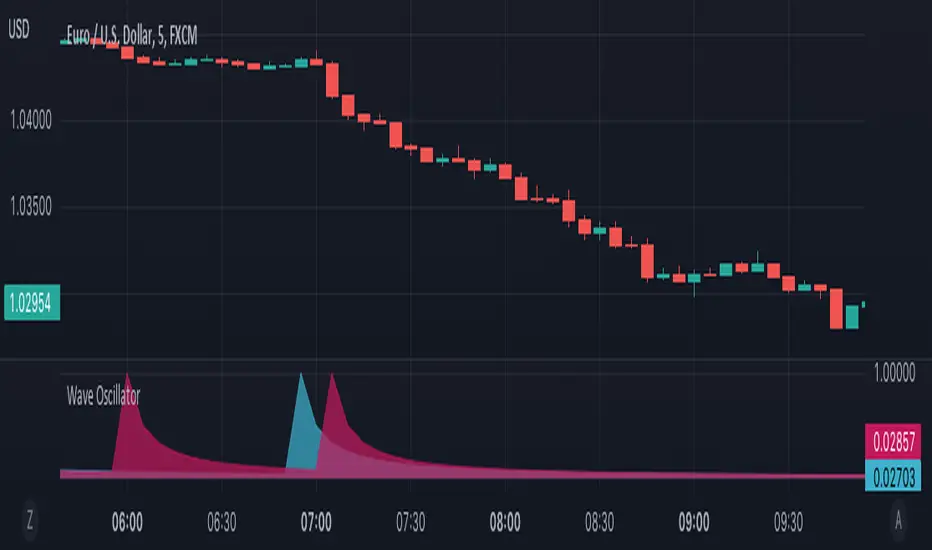
Wave OscillatorWaves Oscillator is a tool that makes it easier to spot potential reversal zones.
When the market is likely to change direction you will get a pink wave as an indication that the market is about to make a bearish move and a blue wave when the market is about to make a bullish move.
This oscillator works best in confluence with other indicators and should not be used as a signal.
SUPERTREND MIXED ICHI-DMI-DONCHIAN-VOL-GAP-HLBox@RLSUPERTREND MIXED ICHI-DMI-VOL-GAP-HLBox@RL
by RegisL76
This script is based on several trend indicators.
* ICHIMOKU (KINKO HYO)
* DMI (Directional Movement Index)
* SUPERTREND ICHIMOKU + SUPERTREND DMI
* DONCHIAN CANAL Optimized with Colored Bars
* HMA Hull
* Fair Value GAP
* VOLUME/ MA Volume
* PRICE / MA Price
* HHLL BOXES
All these indications are visible simultaneously on a single graph. A data table summarizes all the important information to make a good trade decision.
ICHIMOKU Indicator:
The ICHIMOKU indicator is visualized in the traditional way.
ICHIMOKU standard setting values are respected but modifiable. (Traditional defaults = .
An oriented visual symbol, near the last value, indicates the progression (Ascending, Descending or neutral) of the TENKAN-SEN and the KIJUN-SEN as well as the period used.
The CLOUD (KUMO) and the CHIKOU-SPAN are present and are essential for the complete analysis of the ICHIMOKU.
At the top of the graph are visually represented the crossings of the TENKAN and the KIJUN.
Vertical lines, accompanied by labels, make it possible to quickly visualize the particularities of the ICHIMOKU.
A line displays the current bar.
A line visualizes the end of the CLOUD (KUMO) which is shifted 25 bars into the future.
A line visualizes the end of the chikou-span, which is shifted 25 bars in the past.
DIRECTIONAL MOVEMENT INDEX (DMI) : Treated conventionally : DI+, DI-, ADX and associated with a SUPERTREND DMI.
A visual symbol at the bottom of the graph indicates DI+ and DI- crossings
A line of oriented and colored symbols (DMI Line) at the top of the chart indicates the direction and strength of the trend.
SUPERTREND ICHIMOKU + SUPERTREND DMI :
Trend following by SUPERTREND calculation.
DONCHIAN CHANNEL: Treated conventionally. (And optimized by colored bars when overshooting either up or down.
The lines, high and low of the last values of the channel are represented to quickly visualize the level of the RANGE.
SUPERTREND HMA (HULL) Treated conventionally.
The HMA line visually indicates, according to color and direction, the market trend.
A visual symbol at the bottom of the chart indicates opportunities to sell and buy.
VOLUME:
Calculation of the MOBILE AVERAGE of the volume with comparison of the volume compared to the moving average of the volume.
The indications are colored and commented according to the comparison.
PRICE: Calculation of the MOBILE AVERAGE of the price with comparison of the price compared to the moving average of the price.
The indications are colored and commented according to the comparison.
HHLL BOXES:
Visualizes in the form of a box, for a given period, the max high and min low values of the price.
The configuration allows taking into account the high and low wicks of the price or the opening and closing values.
FAIR VALUE GAP :
This indicator displays 'GAP' levels over the current time period and an optional higher time period.
The script takes into account the high/low values of the current bar and compares with the 2 previous bars.
The "gap" is generated from the lack of overlap between these bars. Bearish or bullish gaps are determined by whether the gap is above or below HmaPrice, as they tend to fill, and can be used as targets.
NOTE: FAIR VALUE GAP has no values displayed in the table and/or label.
Important information (DATA) relating to each indicator is displayed in real time in a table and/or a label.
Each information is commented and colored according to direction, value, comparison etc.
Each piece of information indicates the values of the current bar and the previous value (in "FULL" mode).
The other possible modes for viewing the table and/or the label allow a more synthetic view of the information ("CONDENSED" and "MINIMAL" modes).
In order not to overload the vision of the chart too much, the visualization box of the RANGE DONCHIAN, the vertical lines of the shifted marks of the ICHIMOKU, as well as the boxes of the HHLL Boxes indicator are only visualized intermittently (managed by an adjustable time delay ).
The "HISTORICAL INFO READING" configuration parameter set to zero (by default) makes it possible to read all the information of the current bar in progress (Bar #0). All other values allow to read the information of a historical bar. The value 1 reads the information of the bar preceding the current bar (-1). The value 10 makes it possible to read the information of the tenth bar behind (-10) compared to the current bar, etc.
At the bottom of the DATAS table and label, lights, red, green or white indicate quickly summarize the trend from the various indicators.
Each light represents the number of indicators with the same trend at a given time.
Green for a bullish trend, red for a bearish trend and white for a neutral trend.
The conditions for determining a trend are for each indicator:
SUPERTREND ICHIMOHU + DMI: the 2 Super trends together are either bullish or bearish.
Otherwise the signal is neutral.
DMI: 2 main conditions:
BULLISH if DI+ >= DI- and ADX >25.
BEARISH if DI+ < DI- and ADX >25.
NEUTRAL if the 2 conditions are not met.
ICHIMOKU: 3 main conditions:
BULLISH if PRICE above the cloud and TENKAN > KIJUN and GREEN CLOUD AHEAD.
BEARISH if PRICE below the cloud and TENKAN < KIJUN and RED CLOUD AHEAD.
The other additional conditions (Data) complete the analysis and are present for informational purposes of the trend and depend on the context.
DONCHIAN CHANNEL: 1 main condition:
BULLISH: the price has crossed above the HIGH DC line.
BEARISH: the price has gone below the LOW DC line.
NEUTRAL if the price is between the HIGH DC and LOW DC lines
The 2 other complementary conditions (Datas) complete the analysis:
HIGH DC and LOW DC are increasing, falling or stable.
SUPERTREND HMA HULL: The script determines several trend levels:
STRONG BUY, BUY, STRONG SELL, SELL AND NEUTRAL.
VOLUME: 3 trend levels:
VOLUME > MOVING AVERAGE,
VOLUME < MOVING AVERAGE,
VOLUME = MOVING AVERAGE.
PRICE: 3 trend levels:
PRICE > MOVING AVERAGE,
PRICE < MOVING AVERAGE,
PRICE = MOVING AVERAGE.
If you are using this indicator/strategy and you are satisfied with the results, you can possibly make a donation (a coffee, a pizza or more...) via paypal to: lebourg.regis@free.fr.
Thanks in advance !!!
Have good winning Trades.
**************************************************************************************************************************
SUPERTREND MIXED ICHI-DMI-VOL-GAP-HLBox@RL
by RegisL76
Ce script est basé sur plusieurs indicateurs de tendance.
* ICHIMOKU (KINKO HYO)
* DMI (Directional Movement Index)
* SUPERTREND ICHIMOKU + SUPERTREND DMI
* DONCHIAN CANAL Optimized with Colored Bars
* HMA Hull
* Fair Value GAP
* VOLUME/ MA Volume
* PRIX / MA Prix
* HHLL BOXES
Toutes ces indications sont visibles simultanément sur un seul et même graphique.
Un tableau de données récapitule toutes les informations importantes pour prendre une bonne décision de Trade.
I- Indicateur ICHIMOKU :
L’indicateur ICHIMOKU est visualisé de manière traditionnelle
Les valeurs de réglage standard ICHIMOKU sont respectées mais modifiables. (Valeurs traditionnelles par défaut =
Un symbole visuel orienté, à proximité de la dernière valeur, indique la progression (Montant, Descendant ou neutre) de la TENKAN-SEN et de la KIJUN-SEN ainsi que la période utilisée.
Le NUAGE (KUMO) et la CHIKOU-SPAN sont bien présents et sont primordiaux pour l'analyse complète de l'ICHIMOKU.
En haut du graphique sont représentés visuellement les croisements de la TENKAN et de la KIJUN.
Des lignes verticales, accompagnées d'étiquettes, permettent de visualiser rapidement les particularités de l'ICHIMOKU.
Une ligne visualise la barre en cours.
Une ligne visualise l'extrémité du NUAGE (KUMO) qui est décalé de 25 barres dans le futur.
Une ligne visualise l'extrémité de la chikou-span, qui est décalée de 25 barres dans le passé.
II-DIRECTIONAL MOVEMENT INDEX (DMI)
Traité de manière conventionnelle : DI+, DI-, ADX et associé à un SUPERTREND DMI
Un symbole visuel en bas du graphique indique les croisements DI+ et DI-
Une ligne de symboles orientés et colorés (DMI Line) en haut du graphique, indique la direction et la puissance de la tendance.
III SUPERTREND ICHIMOKU + SUPERTREND DMI
Suivi de tendance par calcul SUPERTREND
IV- DONCHIAN CANAL :
Traité de manière conventionnelle.
(Et optimisé par des barres colorées en cas de dépassement soit vers le haut, soit vers le bas.
Les lignes, haute et basse des dernières valeurs du canal sont représentées pour visualiser rapidement la fourchette du RANGE.
V- SUPERTREND HMA (HULL)
Traité de manière conventionnelle.
La ligne HMA indique visuellement, selon la couleur et l'orientation, la tendance du marché.
Un symbole visuel en bas du graphique indique les opportunités de vente et d'achat.
*VI VOLUME :
Calcul de la MOYENNE MOBILE du volume avec comparaison du volume par rapport à la moyenne mobile du volume.
Les indications sont colorées et commentées en fonction de la comparaison.
*VII PRIX :
Calcul de la MOYENNE MOBILE du prix avec comparaison du prix par rapport à la moyenne mobile du prix.
Les indications sont colorées et commentées en fonction de la comparaison.
*VIII HHLL BOXES :
Visualise sous forme de boite, pour une période donnée, les valeurs max hautes et min basses du prix.
La configuration permet de prendre en compte les mèches hautes et basses du prix ou bien les valeurs d'ouverture et de fermeture.
IX - FAIR VALUE GAP
Cet indicateur affiche les niveaux de 'GAP' sur la période temporelle actuelle ET une période temporelle facultative supérieure.
Le script prend en compte les valeurs haut/bas de la barre actuelle et compare avec les 2 barres précédentes.
Le "gap" est généré à partir du manque de recouvrement entre ces barres.
Les écarts baissiers ou haussiers sont déterminés selon que l'écart est supérieurs ou inférieur à HmaPrice, car ils ont tendance à être comblés, et peuvent être utilisés comme cibles.
NOTA : FAIR VALUE GAP n'a pas de valeurs affichées dans la table et/ou l'étiquette.
Les informations importantes (DATAS) relatives à chaque indicateur sont visualisées en temps réel dans une table et/ou une étiquette.
Chaque information est commentée et colorée en fonction de la direction, de la valeur, de la comparaison etc.
Chaque information indique la valeurs de la barre en cours et la valeur précédente ( en mode "COMPLET").
Les autres modes possibles pour visualiser la table et/ou l'étiquette, permettent une vue plus synthétique des informations (modes "CONDENSÉ" et "MINIMAL").
Afin de ne pas trop surcharger la vision du graphique, la boite de visualisation du RANGE DONCHIAN, les lignes verticales des marques décalées de l'ICHIMOKU, ainsi que les boites de l'indicateur HHLL Boxes ne sont visualisées que de manière intermittente (géré par une temporisation réglable ).
Le paramètre de configuration "HISTORICAL INFO READING" réglé sur zéro (par défaut) permet de lire toutes les informations de la barre actuelle en cours (Barre #0).
Toutes autres valeurs permet de lire les informations d'une barre historique. La valeur 1 permet de lire les informations de la barre précédant la barre en cours (-1).
La valeur 10 permet de lire les information de la dixième barre en arrière (-10) par rapport à la barre en cours, etc.
Dans le bas de la table et de l'étiquette de DATAS, des voyants, rouge, vert ou blanc indique de manière rapide la synthèse de la tendance issue des différents indicateurs.
Chaque voyant représente le nombre d'indicateur ayant la même tendance à un instant donné. Vert pour une tendance Bullish, rouge pour une tendance Bearish et blanc pour une tendance neutre.
Les conditions pour déterminer une tendance sont pour chaque indicateur :
SUPERTREND ICHIMOHU + DMI : les 2 Super trends sont ensemble soit bullish soit Bearish. Sinon le signal est neutre.
DMI : 2 conditions principales :
BULLISH si DI+ >= DI- et ADX >25.
BEARISH si DI+ < DI- et ADX >25.
NEUTRE si les 2 conditions ne sont pas remplies.
ICHIMOKU : 3 conditions principales :
BULLISH si PRIX au dessus du nuage et TENKAN > KIJUN et NUAGE VERT DEVANT.
BEARISH si PRIX en dessous du nuage et TENKAN < KIJUN et NUAGE ROUGE DEVANT.
Les autres conditions complémentaires (Datas) complètent l'analyse et sont présents à titre informatif de la tendance et dépendent du contexte.
CANAL DONCHIAN : 1 condition principale :
BULLISH : le prix est passé au dessus de la ligne HIGH DC.
BEARISH : le prix est passé au dessous de la ligne LOW DC.
NEUTRE si le prix se situe entre les lignes HIGH DC et LOW DC
Les 2 autres conditions complémentaires (Datas) complètent l'analyse : HIGH DC et LOW DC sont croissants, descendants ou stables.
SUPERTREND HMA HULL :
Le script détermine plusieurs niveaux de tendance :
STRONG BUY, BUY, STRONG SELL, SELL ET NEUTRE.
VOLUME : 3 niveaux de tendance :
VOLUME > MOYENNE MOBILE, VOLUME < MOYENNE MOBILE, VOLUME = MOYENNE MOBILE.
PRIX : 3 niveaux de tendance :
PRIX > MOYENNE MOBILE, PRIX < MOYENNE MOBILE, PRIX = MOYENNE MOBILE.
Si vous utilisez cet indicateur/ stratégie et que vous êtes satisfait des résultats,
vous pouvez éventuellement me faire un don (un café, une pizza ou plus ...) via paypal à : lebourg.regis@free.fr.
Merci d'avance !!!
Ayez de bons Trades gagnants.

Jurik DMX Histogram [Loxx]Jurik DMX Histogram is the ultra-smooth, low lag version of your classic DMI indicator.
What is the directional movement index?
The directional movement index (DMI) is an indicator developed by J. Welles Wilder in 1978 that identifies in which direction the price of an asset is moving. The indicator does this by comparing prior highs and lows and drawing two lines: a positive directional movement line (+DI) and a negative directional movement line (-DI). An optional third line, called the average directional index (ADX), can also be used to gauge the strength of the uptrend or downtrend.
When +DI is above -DI, there is more upward pressure than downward pressure in the price. Conversely, if -DI is above +DI, then there is more downward pressure on the price. This indicator may help traders assess the trend direction. Crossovers between the lines are also sometimes used as trade signals to buy or sell.
What is Jurik Volty used in the Juirk Filter?
One of the lesser known qualities of Juirk smoothing is that the Jurik smoothing process is adaptive. "Jurik Volty" (a sort of market volatility ) is what makes Jurik smoothing adaptive. The Jurik Volty calculation can be used as both a standalone indicator and to smooth other indicators that you wish to make adaptive.
What is the Jurik Moving Average?
Have you noticed how moving averages add some lag (delay) to your signals? ... especially when price gaps up or down in a big move, and you are waiting for your moving average to catch up? Wait no more! JMA eliminates this problem forever and gives you the best of both worlds: low lag and smooth lines.
Ideally, you would like a filtered signal to be both smooth and lag-free. Lag causes delays in your trades, and increasing lag in your indicators typically result in lower profits. In other words, late comers get what's left on the table after the feast has already begun.
What is an adaptive cycle, and what is Ehlers Autocorrelation Periodogram Algorithm?
From his Ehlers' book Cycle Analytics for Traders Advanced Technical Trading Concepts by John F. Ehlers , 2013, page 135:
"Adaptive filters can have several different meanings. For example, Perry Kaufman’s adaptive moving average ( KAMA ) and Tushar Chande’s variable index dynamic average ( VIDYA ) adapt to changes in volatility . By definition, these filters are reactive to price changes, and therefore they close the barn door after the horse is gone.The adaptive filters discussed in this chapter are the familiar Stochastic , relative strength index ( RSI ), commodity channel index ( CCI ), and band-pass filter.The key parameter in each case is the look-back period used to calculate the indicator. This look-back period is commonly a fixed value. However, since the measured cycle period is changing, it makes sense to adapt these indicators to the measured cycle period. When tradable market cycles are observed, they tend to persist for a short while.Therefore, by tuning the indicators to the measure cycle period they are optimized for current conditions and can even have predictive characteristics.
The dominant cycle period is measured using the Autocorrelation Periodogram Algorithm. That dominant cycle dynamically sets the look-back period for the indicators. I employ my own streamlined computation for the indicators that provide smoother and easier to interpret outputs than traditional methods. Further, the indicator codes have been modified to remove the effects of spectral dilation.This basically creates a whole new set of indicators for your trading arsenal."
Included
- Toggle on/off bar coloring
Hotch DMI+OBV+RSI ConfluenceThis Indicator uses the Relative Strength Index, On Balance Volume, and ADX to identify viable trading trends.
A quick description of what is on display:
1.) Green Triangle = OBV crossing over OBV MA
2.)Red Triangle = OBV Crossing under OBV SMA
3.) The background coloring between the RSI Oversold and Overbought Values has multiple conditions.
----It is green when the DI+ > DI-
----It is purple when the DI+ < DI-
----the brightness represents the ADX value. Darker areas(or more transparent) show a weak ADX value(4). Brighter (or less transparent) show a stronger ADX value(3)
5.) RSI and RSI moving average, including a divergence indicator.
6.) A histogram representing the normalized value of OBV-OBVMA to show changes in value while remaining readably in range on the chart with other indicators.
In the included chart screen shot is an example of an applicable strategy. This example is no guaranteed success and is also not the only strategy applicable to the indicator.

Swing Crossings - TradingEDThis case study is based on different previous studies: ADX Performance , MACD Performance & RSI Performance, with different counts to compare different oscillations of each indicator. Actually, this indicator is complementary to those previously mentioned. The use of this indicator is restricted to private use, and it can be used only by invitation. Different functionalities have been added to the original codes, such as alerts and signals that seek to make trading much easier to interpret by any type of trading operator of any experience level, from beginner to intermediate and advanced .
Key components of the original ADX indicator:
• The DIRECTIONAL MOVEMENT INDEX (DMI) is a technical indicator that measures both the strength and direction of a price movement and is intended to reduce false signals.
• The DMI uses two standard indicators, one negative ( -DI ) and one positive ( +DI ), in conjunction with a third, the AVERAGE DIRECTIONAL INDEX ( ADX ), which is non-directional but shows momentum.
• The larger the spread between the two primary lines, the stronger the price trend. If +DI is way above -DI the price trend is strongly up. If -DI is way above +DI then the price trend is strongly down.
• ADX measures the strength of the trend, either up or down; a reading above 20 indicates a strong trend.
ADX is plotted as a single line with values ranging from a low of zero to a high of 100. ADX is non-directional; it registers trend strength whether price is trending up or down. The indicator is usually plotted in the same window as the two DMI lines, from which ADX is derived. When +DI is above -DI , there is more upward pressure than downward pressure in the price. Conversely, if -DI is above +DI , then there is more downward pressure on the price. This indicator may help traders assess the trend direction. Crossovers between the lines are also sometimes used as trade signals to buy or sell, theay are the main trade signals. A long trade is taken when the +DI crosses above the -DI and an uptrend could be underway. Meanwhile, a sell signal occurs when the +DI instead crosses below the -DI .
Key components of the original RSI indicator:
● The Relative Strength Index ( RSI ) is a popular momentum oscillator developed in 1978.
● The RSI provides technical traders signals about bullish and bearish price momentum, and it is often plotted beneath the graph of an asset's price.
● An asset is usually considered overbought when the RSI is above 70% and oversold when it is below 30%.
It is a momentum indicator used in technical analysis that measures the magnitude of recent price changes to assess overbought or oversold conditions in the price of an asset. The RSI is displayed as an oscillator (a line chart moving between two extremes) and can read from 0 to 100. Overbought does not necessarily mean that the price will reverse lower, just as oversold does not mean that the price will reverse higher. Rather, the overbought and oversold conditions simply alert traders that the RSI is near the extremes of its recent readings.
Key components of the original MACD indicator:
● The Moving Average Convergence Divergence ( MACD ) is calculated by subtracting a long period (26) Exponential Moving Average ( EMA ) from a short (12) period EMA .
● MACD triggers technical signals when it crosses above (to buy) or below (to sell) its signal line.
● The speed of crossovers is also taken as a signal of a market is overbought or oversold.
● MACD helps traders to understand whether the bullish or bearish movement in the price is strengthening or weakening.
It is a momentum indicator that follows the trend and shows the relationship between two moving averages of the price of a security. It can function as a trigger for buy and sell signals, when you cross above (to buy) or below (to sell) your signal line. It helps to understand if the movement is bullish or bearish , if it is getting stronger or weaker. The further the MACD is above or below its baseline, it indicates that the distance between the two EMAs will be growing, often shown with a histogram that graphically represents the distance between the MACD and its signal line, and It is used to identify when the bullish or bearish momentum.
Main functions of this modified indicator:
1) The SOURCE for the counts can be determined by the trader (close, open, etc).
2) In some cases, you can select the type of MOVING AVERAGE, among many available options ( SMA , EMA , DEMA , HMA , etc.)
3) The MEASURE can be based on a CANDLES count if you are trading OHLC Charts from 1D onwards, or if your trading is intraday, you can also select counts by MINUTES, HOURS or DAYS, depending on your trading style.
4) LENGTH, by default it will be loaded as in the STRATEGY, but considering the previous point, you can modify it according to your convenience.
5) You have the option to hide or show a LABEL at the top of the chart, with respect to the signals: BULLISH green, BEARISH red. *
6) You have the option to hide or show INDICATORS or SIGNALS based on EACH OSCILLATION.
Main performance functions of this modified indicator:
I) In the case of the PERFORMANCE that appears at the right of the chart, you have the option to adjust the WIDTH of each box.
II) The TEXT of the PERFORMANCE is not modifiable, but you can customize the default color. *
III) The BACKGROUND of the PERFORMANCE, you can customize the default color. *
IV) You have the option to hide or show a PERFORMANCE that appears at the right of the chart.
Main functions to customize the style of this indicator:
a) For any type of SIGNAL, it is painted as a VERTICAL LINE in the graph, you can change the color that comes by default. *
b) In the case of the LABELS that appear at the top, the text is not modifiable, but you can customize both the type of label and change the default color. *
c) When you have a SHORT SIGNAL or a LONG SIGNAL, you can change the EMOTICON that comes by default. **
* By default, they are marked as red for downtrends and green for uptrends.
** By default, they are marked with an emoticon indicating the possible direction of the price, down if it is bearish or up if it is bullish .

Directional Movement Index + Fisher Price Action With LabelsDIRECTIONAL MOVEMENT INDEX + FISHER PRICE ACTION WITH LABELS
Directional Movement Index shows buy and sell pressure.
Fisher transform shows price action trending bullish or bearish.
Caution dots notify you of conflicting trends.
***HOW TO USE***
The top lines are the fisher transform showing you the price action trend.
The bottom lines filled with color shows the DMI directional movement index.
The yellow dots at the bottom tell you if these two indicators are currently giving conflicting signals.
DMI
If the green line is above the red line and the background is colored green, there is more market buying than selling.
If the red line is above the green line and the background is colored red, there is more market selling than buying.
FISHER TRANSFORM
If the lines are painted green, the price action is trending up.
If the lines are painted red, the price action is trending down.
CAUTION DOTS
If a yellow dot shows up at the bottom of the chart, it is notifying you that the DMI and Fisher Transform are currently giving opposite signals…. so use caution.
***BULLISH/BEARISH LABEL***
There is also a label on the right side that tells you whether there is more buying or selling. This table updates in real time and changes colors so you can get an easy, quick interpretation of the current buy/sell pressure without having to look at the indicator data so you can make faster decisions on whether to enter or exit a trade.
Green means more market buying than selling.
Red means more market selling than buying.
Blue means an equal amount of market buying and selling.
If buying pressure is bullish but below the 20 level, a second label will show up in purple letting you know there is weak buying pressure so use caution.
If selling pressure is bearish but below the 20 level, a second label will show up in purple letting you know there is weak selling pressure so use caution.
There is a third label showing the current trend of the fisher transform. Green means bullish price action. Red means bearish price action.
The fourth label is orange and only shows up when the DMI and Fisher Transform are currently giving opposite signals, so make sure you use caution during those times.
***MARKETS***
This indicator can be used as a signal on all markets, including stocks, crypto, futures and forex.
***TIMEFRAMES***
This directional movement index + fisher transform indicator can be used on all timeframes.
***TIPS***
Try using numerous indicators of ours on your chart so you can instantly see the bullish or bearish trend of multiple indicators in real time without having to analyze the data. Some of our favorites are our Auto Fibonacci, Volume Profile, Momentum, Auto Support And Resistance and Money Flow Index in combination with this Directional Movement Index + Fisher Transform. They all have real time Bullish and Bearish labels as well so you can immediately understand each indicator's trend.

Volume Profile With Buy & Sell Pressure LabelVOLUME PROFILE WITH BUY AND SELL PRESSURE LABEL
This volume profile indicator shows volume traded for each bar and is colored according to the difference in buy and sell pressure(DMI).
***HOW TO USE***
If the bar and background is colored green, there is more market buying than selling on that bar.
If the bar and background is colored red, there is more market selling than buying on that bar.
If the bar and background is colored blue, there is an equal amount of market buying and selling on that bar.
***BUY/SELL LABEL***
There is also a label on the right side that tells you whether there is more buying or selling on the current bar. This table updates in real time and changes colors so you can get an easy, quick interpretation of the current buy/sell pressure without having to look at the volume bars so you can make faster decisions on whether to enter or exit a trade. The table changes colors in sync with the volume bars and background. Green means more market buying than selling. Red means more market selling than buying. Blue means an equal amount of market buying and selling.
***MARKETS***
This indicator can be used as a signal on all markets, including stocks, crypto, futures and forex.
***TIMEFRAMES***
This volume profile indicator can be used on all timeframes.
***TIPS***
Try using numerous indicators of ours on your chart so you can instantly see the bullish or bearish trend of multiple indicators in real time without having to analyze the data. Some of our favorites are our Auto Fibonacci, DMI, Momentum, Auto Support And Resistance and Money Flow Index in combination with this Volume Profile. They all have real time Bullish and Bearish labels as well so you can immediately understand each indicator's trend.

Candles Colored Green/Red According To Buy & Sell PressureCANDLES COLORED GREEN OR RED ACCORDING TO BUY & SELL PRESSURE
This indicator paints each candle green, red or blue depending on whether the buy/sell pressure for that candle is bullish, bearish or neutral.
***TURN OFF NORMAL CANDLE COLORS***
For this script to show properly on the chart, make sure you go to chart settings(gear icon in top right corner) and in the symbol tab, uncheck body, borders and wick.
***HOW TO USE***
When the directional movement index indicator shows more buying pressure than selling pressure, the candle will appear lime green. This indicates bullish buying pressure.
When the directional movement index indicator shows more selling pressure than buying pressure, the candle will appear red. This indicates bearish selling pressure.
When the directional movement index indicator shows the same amount of buy and sell pressure, the candle will appear blue. This indicates neutral buy/sell pressure.
Use the color changes to see if there is more buying or selling to pinpoint reversals and understand current market buying. Wait to enter or exit positions until the candles turn the opposite color.
***MARKETS***
This indicator can be used as a signal on all markets, including stocks, crypto, futures and forex.
***TIMEFRAMES***
This DMI color coded candlestick indicator can be used on all timeframes.
***TIPS***
Try using numerous indicators of ours on your chart so you can instantly see the bullish or bearish trend of multiple indicators in real time without having to analyze the data. Some of our favorites are our Auto Fibonacci, Directional Movement Index, Color Coded Buy & Sell Pressure Volume Profile, Auto Support And Resistance and Money Flow Index in combination with this Buy & Sell pressure Candle indicator.

DMI PRO [JoseMetal]============
ENGLISH
============
- Description:
This study is a combination of all DMI components (DI+, DI- and ADX) into a simple line.
Other aspects of the indicator such as ADX levels are well known: 0-25 for weak or no trend, 25-50 for strong trend, 50-75 for very strong trend and 75-100 for extremely strong trend.
- Visual:
The ADX line takes a color depending on the trend, GREEN (BULLISH) for DI+ > DI- or RED for DI- > DI+ (BEARISH).
A signal line has been added to generate crossovers (which are marked with an arrow).
An increasing (getting stronger) ADX color is lighter when a decreasing (weaker) ADX is darker.
Also, green/red dots are shown in the top of the indicator when the ADX turns from decreasing ADX to increasing ADX, color depends on the trend (again, GREEN for BULLISH and RED for BEARISH).
- Usage:
There are some different ways to use this indicator which are similar to the DMI itself, you can just take crossovers to enter LONG or SHORT depending on the COLOR of the ADX (which shows the trend). You can enter/exit trades directly with this method when the crossover/cross under occurs respectively.
Other way (more risky) is to use the dots which may be trend continuation signals, so you can increase your position or enter a trade if you spot a nice trend (ADX higher than the minimum level).
You can also use this indicator as a trend filter for your strategy.
- Customization:
ADX levels, DMI and ADX periods, smoothing, colors... almost everything is configurable, i'll add even more if requested.
- Recommendations:
Any recommendation applied to the DMI is valid here like only entering trades if ADX is higher than 25 to ensure that you're in a trend and not in a range, 15-20 is more risky, but you can get more profits if you enter bottom/tops obviously.
============
ESPAÑOL
============
- Descripción:
Éste estudio es una combinación de todos los componentes del DMI (DI+, DI- y ADX) en una simple línea.
Otros aspectos del indicador como los niveles ADX son bien conocidos: 0-25 para tendencia débil o nula, 25-50 para tendencia fuerte, 50-75 para tendencia muy fuerte y 75-100 para tendencia extremadamente fuerte.
- Visual:
La línea ADX toma un color dependiendo de la tendencia, VERDE (ALCISTA) para DI+ > DI- o ROJO para DI- > DI+ (BAJISTA).
Se ha añadido una línea de señal para generar cruces (que se marcan con una flecha).
El color de un ADX creciente (cada vez más fuerte) es más claro cuando un ADX decreciente (más débil) es más oscuro.
Además, se muestran puntos verdes/rojos en la parte superior del indicador cuando el ADX pasa de ser decreciente a ser creciente, el color depende de la tendencia (de nuevo, VERDE para ALCISTA y ROJO para BAJISTA).
- Uso:
Hay varias formas de usar éste indicador que son similares al DMI mismo, puedes simplemente usar los cruces para entrar LONG o SHORT dependiendo del COLOR del ADX (que muestra la tendencia). Puedes entrar/salir de las operaciones directamente con este método cuando se produce el cruce al alza/cruce a la baja respectivamente.
Otra forma (más arriesgada) es utilizar los puntos que pueden ser señales de continuación de la tendencia, por lo que puede aumentar su posición o entrar en una operación si detecta una buena tendencia (ADX más alto que el nivel mínimo).
También puedes utilizar este indicador como un filtro de tendencia para tu estrategia.
- Personalización:
Niveles de ADX, períodos de DMI y ADX, suavizado, colores... casi todo es configurable, añadiré aún más personalización si lo pedís.
- Recomendaciones:
Cualquier recomendación aplicada al DMI es válida para éste indicador, como por ejemplo, sólo entrar en operaciones si el ADX es superior a 25 para asegurarte de que estás en una tendencia y no en un rango, 15-20 es más arriesgado pero puedes obtener más beneficios ya que podrías estar entrando en dips / tops.

ADeXtIt is an extended ADX and Direction Movement Index indicator with the following changes:
It shows a histogram instead of the DMI lines. If the histogram is green, the DMI+ is above DMI-, otherwise it is red.
You can specify a multiplier for the histogram values to check if values are above threshold. This way you can use the same threshold line as ADX to detect directional strength.
You can remove outliers from ATR calculations
You can use different MAs and sources for DMI and ATR calculations to make ADX more adjustable to different markets
It uses my ADExt library, so you can easily transfer your study to a strategy script.

[UPRIGHT] Awesome DMI+Hello Traders,
Today I'm releasing a spin on an 'oldie but goodie'; the Directional Movement Index (DMI).
DMI is a combination of 3 different indicators developed by the famous J. Welles Wilder. DMI has 3 different plots: the ADX, +DI, and -DI. The first is the ADX (Average Directional Index), which Wilder created in 1978 to show the strength of a trend by comparing the current price with the previous price range. The other two are the +DI (positive directional indicator) and the -DI show up as two separate lines, +DI is the difference between the highest price of the current day and the highest price of the day before, and -DI does the same calculation with the current and previous day's lows.
How does it work?
When the ADX line is above 25 (as a general rule, some traders use a different threshold, +/- 5), the trend is strong. When the +DI line is above the -DI line, the asset (stock) is moving in an uptrend, and the opposite means the asset is in a downtrend.
How is this different?
Uses multiple calculations to produce signals for an indicator than normally doesn't have any.
Multiple ADX's, +DI's, and -DI's for better accuracy and clearer direction changes.
Ability to use 2 different background highlight signals and several buy/sell signals.
Fully customizable (as always), ability to turn on or off any signals, change any of the colors to suit your needs.
Added pre-filled Alerts.
The ribbons created by the fill make it easier to see the change in direction of each plot.
The chart should look like:
Cheers,
Mike
(UPRIGHT TRADING)
