MTF EMASMulti time frame EMA
This script will plot the configured EMAS on the current time frame (CTF) and also the same EMAS on a higher time frame (HTF).
Hard coded according:
* 5m EMAS will be plotted on TF bellow 5m
* Daily EMA will be plotted on TF above 5m and bellow 1D
* Weekly EMA will be plotted on daily TF
* Monthly EMA will be plotted on weekly TF
This configuration give us the opportunity to watch EMA support/resistance from HTF on the CTF
ממוצע נע אקספוננציאלי (EMA)

Joel on Crypto - MACD ScalpingJoel on Crypto - MACD Scalping
This is a Scalping indicator primarily intended for the 5 minute time frame.
It is based on the Crypto Scalping YouTuber Joel on Crypto's popular 5 minute scalping strategy and this is the indicator he personally use when Scalping.
This is a Multi-timeframe indicator where if you use it on the 5 minute time frame, the MACD Histogram bars will be based on the 1 minute timeframe.
The purpose of this indicator is not to trade it like a bot. The purpose is to grab the traders attention a time where there COULD be a scalping opportunity.
Use this indicator at your own risk.

Multi EMA with labels (Any timeframe)This script lets you add up to 8 EMAs (Exponential Moving Averages) that can be set to any timeframe and length. The difference between this and other EMA indicators is that it has a simple label attached to each EMA showing which timeframe it belongs to and what length it is, so you can get that information at a glance while trading without having to remember the specific settings for each EMA.
I was personally looking for something like this because I like clarity on my chart and these labels really help. The existing EMA indicators I found with labels don't support multiple timesframes or if they do, they don't include the timeframe itself in the label, so that's why I created this simple script and shared it in case somebody else is looking for the same. Enjoy.

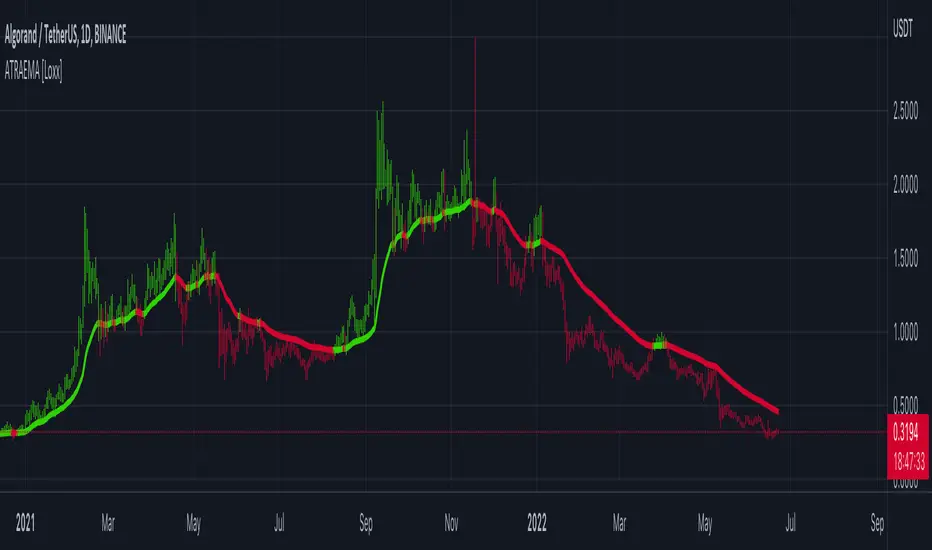
ATR Adaptive EMA [Loxx]ATR adaptive EMA is an exponential moving average with dynamic ATR-adjusted length inputs.
What is Average True Range (ATR)?
The average true range (ATR) is a technical analysis indicator, introduced by market technician J. Welles Wilder Jr. in his book New Concepts in Technical Trading Systems, that measures market volatility by decomposing the entire range of an asset price for that period.1
The true range is taken as the greatest of the following: current high less the current low; the absolute value of the current high less the previous close; and the absolute value of the current low less the previous close. The ATR is then a moving average, generally using 14 days, of the true ranges.
VWAP/EMA50/EMA200We script this one for combining VWAP , EMA50 and EMA200. The tool is fantastic if traders know how VWAP , EMA work? Just adding this script in your favorite and work like charm:
VWAP: How to trade with that
- One of the simplest uses of the VWAP is gauging support and/or resistance.
- A trader who is long a stock can use the VWAP as a target exit if its trading below.
- A stock trading over intraday VWAP may be bullish , while a stock trading under may be bearish .
EMA 50/EMA200: How to trade with that timeframe 50-day or 200-day period
- Identify the trend of market in longterm
- Golden-cross (short term EMA cross above longterm EMA ) is call golden-cross signals. It is opportunity for buying.
- Deal-cross ( short term EMA cross below longterm EMA ) is call dead-cross signals. It is opportunity for selling.
- Identify support levels
- Identify resistance levels
Let me know if you see anything else that should be added/changed.

MTF DSS (Double Smoothed Stochastic) [TH]The Double Smoothed Stochastic indicator was created by William Blau.
The DSS ranges from 0 to 100, like the standard Stochastic Oscillator.
The same rules of interpretation apply to Stochastics can be applied to DSS, although the DSS offers a much smoother curve than the raw Stochastic.
How it works:
It applies Exponential Moving Averages (EMAs) of two different periods to a standard Stochastic %K.
The components that construct the Stochastic Oscillator are first smoothed with the two EMAs.
Then, the smoothed components are plugged into the standard Stochastic formula to calculate the indicator.
Calculation:
EMA of the ( EMA of the (Close – Lowest Low for the specified period) )
Divided by
EMA of the ( EMA of the (Highest High for the specified period – Lowest Low for the specified period) )
X 100
How to add alerts:
Check off each piece of criteria you want for the alerts, then select Okay.
Then go to 'Create Alert' and set the condition to 'MTF DSS', select create.

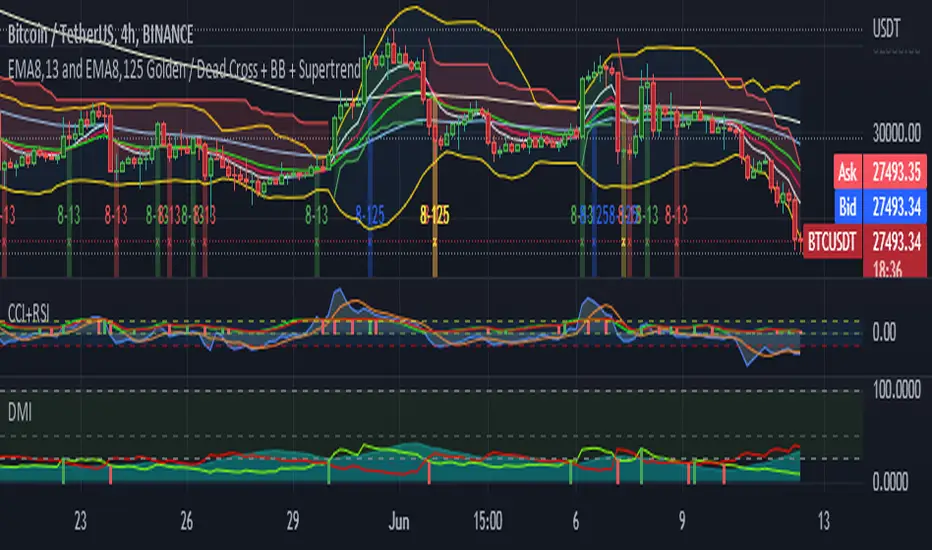
5EMA(8,13,21,55,125) w/ EMA8-13 + EMA8-125 GC/DC Signal-by TerryThis Script are Combined 5 EMAs Indicator with Golden / Death Cross EMA 8 -13 and EMA 8 - 125 within Green or Red Column Line as Default Signal. This Indicator also combined with Ballinger Band and Super Trend Channel.
If you have like this Indicator, please add to your favorite Indicator, and If You Don't, Don't be like a man without woman :) ... God Bless You All
Joe's Ultimate MA Ribbon (w/ Crossover Triggers)Tired of having to add multiple moving average indicators to your chart? Well, stop doing that.
Here's a sweet moving average ribbon (with 1-10 moving average lines!) that will make your charts look much cooler 😎.
Not only that, it also includes triggers for MA crossovers. So, yeah...you can pick which MA crossovers trigger for longs and shorts separately. Yup, you read that right.
Options:
Show/Hide MA Lines: Only show the lines you wanna see. No more. No less.
MA Type (can be different for each line!): EMA, SMA, SMMA (RMA), WMA, VWMA
MA Source (for each line): open, close, high, low, hl2, hlc3, ohlc4, hlcc4
MA Length (for each line): any number between 1 and 4999
Line Colors: Ooh, pretty.
Triggers: On or Off
Crossover Long Triggers: When _______ crosses over _______ on timeframe _______
Crossover Short Triggers: When _______ crosses over _______ on timeframe _______
Trigger Characters and Location

Ext/Non EMA SignalsThis allows for one EMA to reference the regular session well the other references the extended session. A green arrow will appear above a bear candle closing above both the EMAs and a Red arrow on bull candles closing below both.
This saves me time from jumping back and forth from extended sessions and regular session.
Let me know if you have any questions, I just recently started using Pine Editor to build indicators I was not able to find in the library.

Expected DCA PriceShowing the expected price of the DCA strategy in half a year / one year / two years, weighted by the USD supply (M2) by default

Neo Matrix
What is NeonMoney Indicator?
NeonMoney Indicator is a trend following indicator which gives strong support and resistance indications with some moving averages.
Description
After the long research of 2 years along with 100’s of indicators & oscillators we have created this wonderful indicator which can avoid signals in a choppy market & gives perfect signal to buy and sell at a right time with high winning probability and higher reward to risk.
Main part of this indicator is timeframe period that is it shifts from one to another pivots , vwap and MAs tf automatically which helps in top down analysis.
This indicator is made with Vwap , MA, cpr and fibonacci pivots calculations. It can be useful to trade every market like in crypto, forex, commodities and as well as stock market . To use this indicator trader must have basic understanding of candle pattern and chart pattern identification studies with moving averages retrenchments.
This indicator works well & gives better results if you have moving average retrenchment knowledge. When candles are retrenching specific moving average line then also sometimes traders get confuse whether to enter with moving average direction / favor or not. So, to come out from this confusion this indicator is very useful. Because it gives signal in moving average favors and target at pivot levels. So ultimately traders gain some confident on his/her trade that he/she is in the right side of the market.
Another advantage of this indicator is in some of the criteria it gives fix signal in-between the candle formation & once signal is given then it will not change.
About uses instruction and components.
Time frame – 1m, 3m , 15m, 1H, 4H, DailyTF
Components: Vwap , MAs, CPR , and Fibonacci Pivots .
Dotted line - Vwap
Straight gray line and zone - CPR
Curvy Gray lines - MAs
Colorful lines - Fibonacci pivots
Stacked EMAsStacked Daily & Weekly EMAs + Labels
Pretty much self-explanatory indicator that shows the current momentum based on the key exponential moving averages.
Three stages of the EMAs:
1. Stacked Positively (Bullish) - EMAs are stacked on top of each other which represents a healthy bullish uptrend (green Label).
2. Stacked Negatively (Bearish) - EMAs are stacked below each other meaning the trend is bearish (red label).
3. Stacked Neutral (Neutral) - EMAs are crossing each other without any clear direction = chop (yellow label).
Hope it helps.

Customized Multi EMAPlot several EMA with only one script.
Default EMA: 20、50、100、200.
All of these are adjustable.
Also, Vegas tunnel and filter line can be presented or not according to your needs.
Saturns Rings5 EMAs in One Indicator
Recommended Settings:
Fibonacci Series (Default): 8, 21, 34, 55, 89
Standard: 10, 20, 50, 100, 20

Trend CandlesThis indicator uses simple moving average and exponential moving average to calculate the trend of the symbols.
If the trend is BULL, the bars' color will be lime(green).
If the trend is BEAR, the bars' color will be black.
Otherwise, the bars' color will be gray.
Enjoy it!

Risk Management & Position Size DashboardRisk Management and Position Size Calculator
This indicator is designed to assist traders by instantly providing the necessary information to execute orders based on defined risk parameters. This is not an indicator that tells you WHEN to buy or sell, but HOW MUCH to buy or sell based on your risk appetite. The indicator is compatible with any strategy and any instrument
The indicator uses some great pinescript features, allowing you to drag and drop your levels directly on the chart for instant feedback from the risk management dashboard. Huge timesaver.
Instructions:
1. The first time you add the indicator to your chart, you will be asked to identify your Entry, Stop and Target levels by clicking on them directly on the chart. You can at any point adjust these levels directly on the chart, or you can manually enter them in settings
2. Setup your risk profile in the indicator settings:
(a) Current Capital: Enter the current value of your trading account
(b) Max Risk Per Trade: Enter the maximum % of your Capital you want to risk per trade
(c) Max Leverage: Enter the maximum leverage you want applied to your account. This comes in handy when you trade on very low timeframes where position sizes can become very large. No matter what you enter here, position size will never exceed Max Risk Per Trade
(d) Stop Ticks: Number of ticks to use above/below the identified high/low for stops
(e) Use Current Price as Entry (Market Orders): By default, the system will use the entry level you have selected for limit orders. If you want to use the system to display data based on current price for market orders, select “Use Current Price as Entry (Market Orders)”
3. Based on your stop and target levels, the system will automatically display the dashboard for Longs (bottom of screen) or Shorts (top of screen). The levels will also be displayed to the right of the current price bar
4. Display Free Trade Level: toggle this on to display the level you should exit 50% of your position to make the trade risk free
5. Dashboard / Text size and level colours and positions are customisable
The Dashboard displays the following information at all times:
1. Entry
2. Stop
3. Trade Risk (%): Percentage price difference between Entry and Stop
4. Max Risk ($): Currency value of loss if the trade is stopped out
5. Size: Position Size to execute your trade based on your risk profile/appetite
6. Size($): Position Size in currency value
7. P&L($): Potential profit to your Capital in currency value
8. P&L(%): Potential profit to your Capital in %
9. R:R: Risk to Reward Ratio
10. % to Target: Percent price needs to move to achieve your target
Hope this helps you with your trading. I built this as I was tired of wasting time opening up spreadsheets or calculators to execute trades - especially on lower timeframes. Making the code open source so if you do make improvements to this I'd love to hear from you. Also open to suggestions.
Happy Trading!
SSL HYBRID AdvancedSSL HYBRID Advanced
SSL Hybrid is an Advanced version of the default SSL Hybrid by Mihkel00.
Multiple Indicators
MACD Crossover Signals
EMA 200
Bollinger Band
Bollinger Band Squeeze
ADX Crossover and ADX level
CCI Over Brought /Sold
Stochastic Over Brought /Sold
RSI Over Brought /Sold
CREDITS
QQE MOD byMihkel00
SSL Hybrid by Mihkel00
Waddah Attar Explosion by shayankm
Support Resistance LonesomeTheBlue
Indicators On Chart
QQE MOD is plotted as Dot below and above the candle and also as Background
QQE line is plotted and can be used as crossover to find trend. Flat movement of QQE is Sideways
Weak ADX is plotted as a Background color. Same can be verified using Bollinger band Squeeze.
EMA crossover can be plotted by selecting MTF MA(multi time frame moving average indicator) Area plot is provided.
CCI , Stochastic, RSI signals provided in the table option
WAE (volume indicator ) is shown in Table
EMA 200 is plotted and color Represents ADX level and direction. Plots on EMA 200 are ADX crossovers
MACD crossovers are represented by Triangles above and below Candles
Support Resistance levels are plotted (change settings)
Pivot Points are plotted (change settings)
Bollinger Bands Plotted
EMA 20 and EMA 50 plotted with AREA for additional confirmation
Buy: When the table option shows completely Blue signals in all indicators
Sell: When the table option shows completely Pink signals in all indicators
WARNING not recommended for lower time frames. Use at your own Risk.
Updates will be released shortly if any. please provide your suggestions to make it more functional indicator.

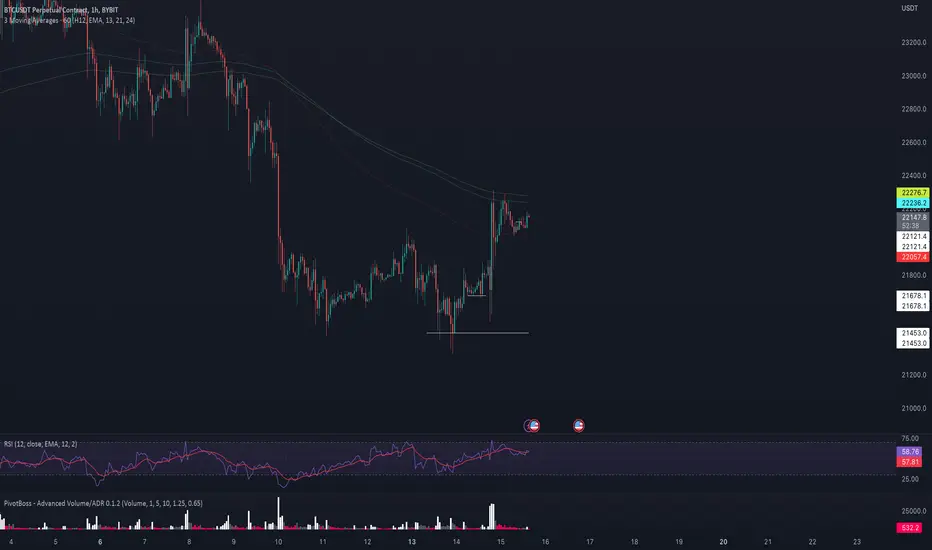
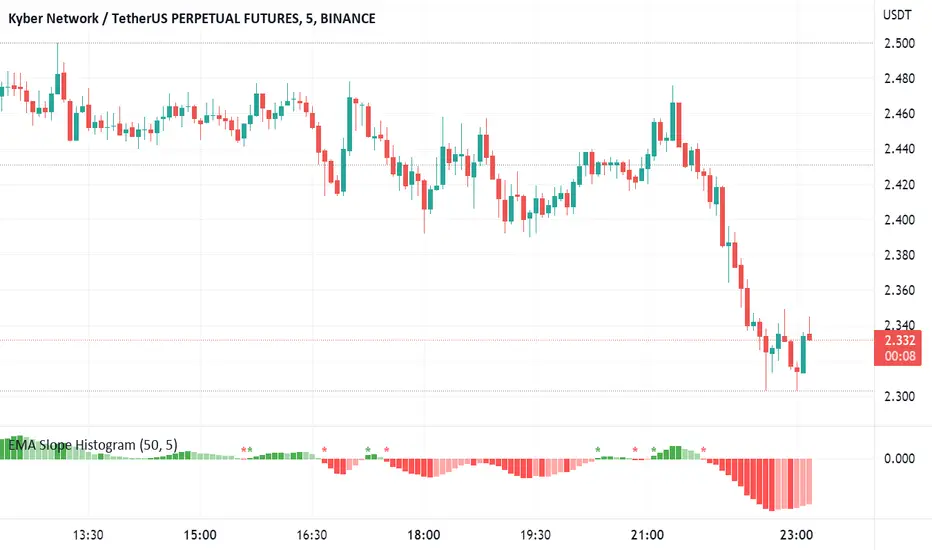
EMA Slope HistogramThe script shows change in a single EMA over a specified period as a histogram. The period of EMA as well as Change period can be specified. Moreover, it also shows change in direction of EMA. The change can be negative for a downward trend and positive for an upward trend.
EMA Price Distance TrackerThis simple indicator tracks the distance that the price is from a moving average. This can be helpful when looking for reversals based on historical informaiton.

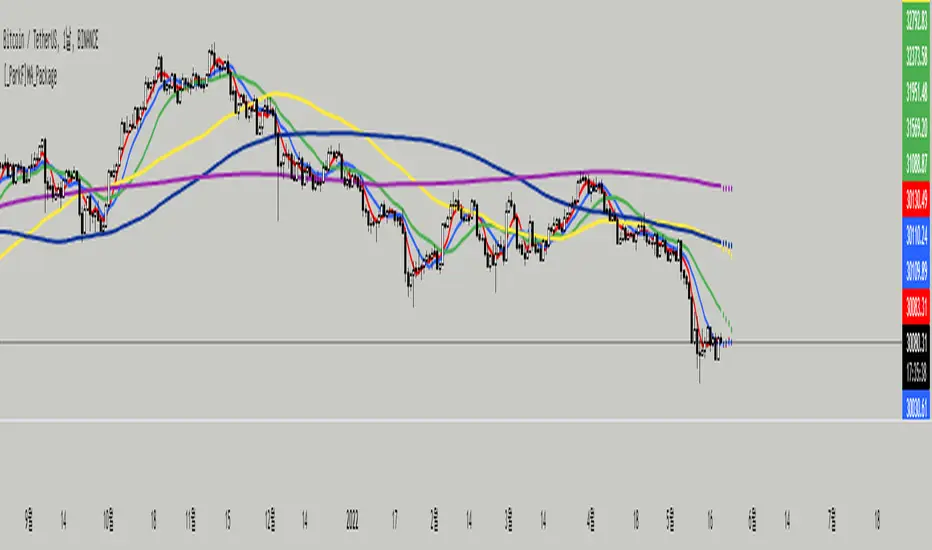
[_ParkF]MA_PackageThis indicator is a comprehensive set of moving averages.
All settings are handled in the input menu.
1. 6 moving averages are included.
2. You can edit the source of 6 moving averages.
3. You can change the type of each moving average line.
4. You can change the period value of each moving average line.
5. You can change the color of each moving average line.
6. You can change the thickness of each moving average line.
7. The predictive value of each moving average line will be displayed as a dot, and this value will be changed according to the type of the moving average line.
--------------------------------------------------------------------------------------------------------------------------------------------------------------------------------------------------------
이 지표는 이동평균선의 종합선물세트 입니다.
모든 설정은 input 메뉴에서 다뤄집니다.
1. 6개의 이동평균선이 포함 되어 있습니다.
2. 6개의 이동평균선의 소스를 수정할 수 있습니다.
3. 각각의 이동평균선의 타입을 변경할 수 있습니다.
4. 각각의 이동평균선의 기간값을 변경할 수 있습니다.
5. 각각의 이동평균선의 색상을 변경할 수 있습니다.
6. 각각의 이동평균선의 두께를 변경할 수 있습니다.
7. 각각의 이동평균선의 예측값이 점으로 표시될 것이고 이 값은 해당 이동평균선의 타입에 맞춰 변경됩니다.
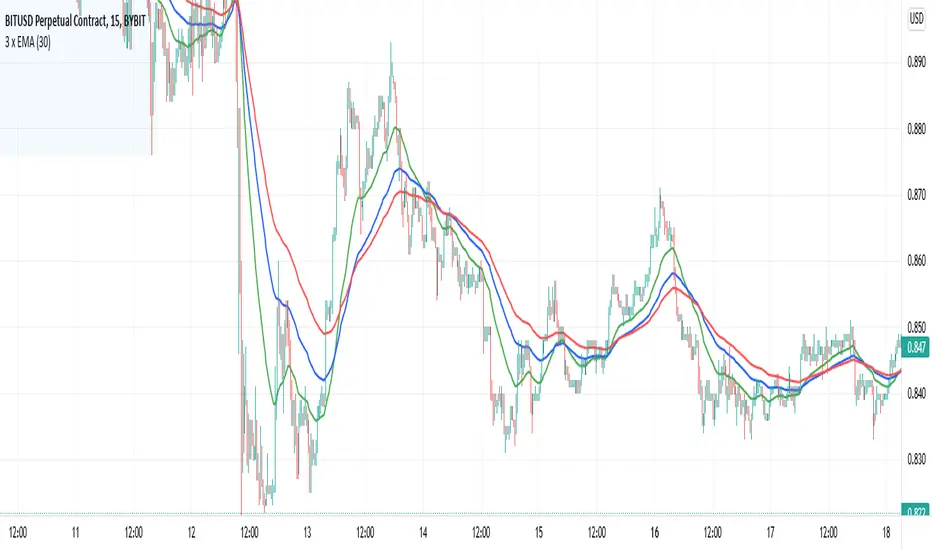
3 x EMAExponential Moving Averages
The indicator plots three moving averages.
The settings specify the period for the first moving average.
The period for the second moving average is considered as the period for the first one multiplied by 2.
The period for the third moving average is considered as the period for the first one multiplied by 3.
MA with a short period - green
MA with an average period - blue
MA with a long period - red
Экспоненциальные скользящие средние
Индикатор строит три скользящие средние.
В настройках указывается период для первой скользящей средней.
Период для второй скользящей считается как период для первой умноженной на 2.
Период для третьей скользящей считается как период для первой умноженной на 3.
Скользящая с коротким периодом - зеленая
Скользящая со средним периодом - синяя
Скользящая с длинным периодом - красная
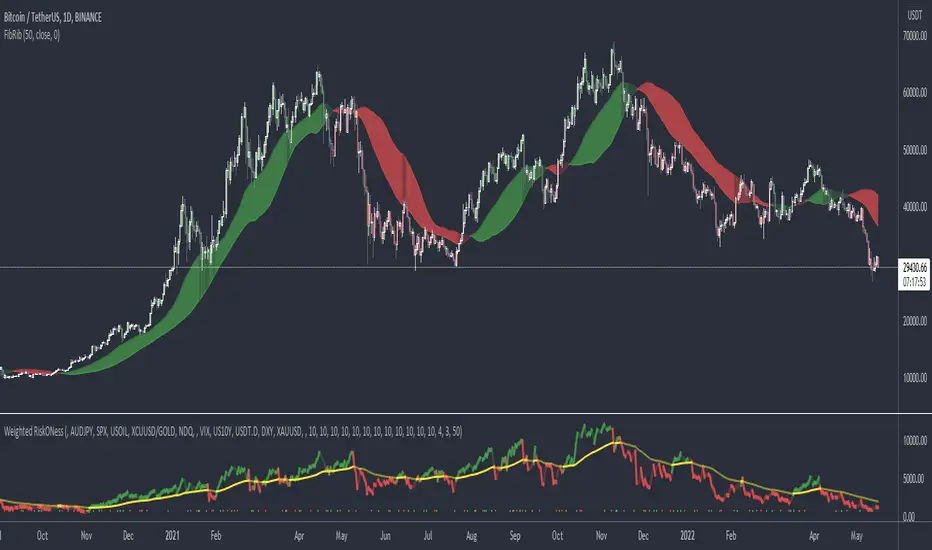
Fibonacci RibbonThe Fibonacci Ribbon (FibRib) creates two Fibonacci moving averages: essentially a Fibonacci WMA and a Fibonacci EMA.
The ribbon colors based on which is higher and where PA is relative to the ribbon.
Optional colored candles shades candles the same color as the ribbon.
OpenCipher AOpenCipher A is an open-source and free to use Overlay.
Features:
EMA Ribbons (Lengths: 5, 11, 15, 18, 21, 25, 29, 33)
Symbols ("Be careful" and "attention required" signals)
EMA Ribbons
The EMA RIbbons are a set of exponential moving averages. Blue and white ribbons = uptrend, gray ribbons = downtrend. The ribbons can act as support in uptrends and as resistance in downtrends.
Lengths and source of the ribbons are customizable.
Symbols
Green Dots: The green dot is a bullish symbol that appears whenever the EMA 11 crosses over EMA 33.
Red Cross: The red cross is a bearish symbol that appears whenever the EMA 5 crosses under EMA 11.
Blue Triangle: The blue triangle marks a possible trend reversal that appears whenever the EMA 5 crosses over EMA 25 while EMA 29 is below EMA 33.
Red Diamond: The red diamond is a bearish symbol that marks a potential local top whenever a bearish wavecross occurs (fast wave crosses under slow wave).
Yellow X: The yellow X is a warning signal that appears whenever a bearish wavecross occurs while the slow wave of the wavetrend is below -40 and the moneyflow is in the red (below zero).
Blood Diamond: The blood diamond is a bearish symbol that highlights whenever the red diamond and the red cross appear on the same candle.
Usage
Treat the symbols as signs that your attention might be required and don't trade based on them.
