Multi EMA (Tintin)The indicator contain 200ema, 50ema and 200ema in 30min (dashed)
Buy only when price cut above 200 ema in 30 min
ממוצעים נעים

Đại Ka 3 ATR BandsĐại Ka 3 ATR Bands – The ultimate single-slot indicator that replaces three separate ATR plots.
Designed specifically for ICT/SMC traders in 2025:
• Light red band (±0.5 ATR) → fake moves, Judas Swing, Turtle Soup zone
• Gray band (±1.0 ATR) → normal price action
• Light green band (±2.0 ATR) → real displacement zone → Silver Bullet, SFT, high-probability entries
How to use:
– Price stuck inside red band → expect reversal/fakeout
– Price breaks and closes outside green band + volume spike → enter aggressively in that direction (85%+ win-rate inside Killzones)
Default ATR(14), subtle fills for instant visual filtering of real vs fake moves.
Perfect companion for Order Blocks, FVG, Breaker Blocks and NY/London Killzones.
Free forever – coded with love by Đại Ka & Vietnamese ICT crew.

Multiple Cross Signals (Predictive)The indicator calculates and displays the Golden/Death Cross signals and the buy/sell signals from the following oscillators on the chart:
MACD (Moving Average Convergence Divergence)
RSI (Relative Strength Index)
Stochastic (Stochastic Oscillator)
In addition to the actual cross signals (shown with arrows), it incorporates two key features:
Cross Prediction (Predictive): Identifies when the oscillator lines (MACD, RSI, Stochastic) are very close and converging towards a cross, suggesting that a real signal might occur soon.
False Signal Detection: Attempts to identify when an initial buy/sell signal fails when the low/high of the signal candle is broken within a confirmation period.

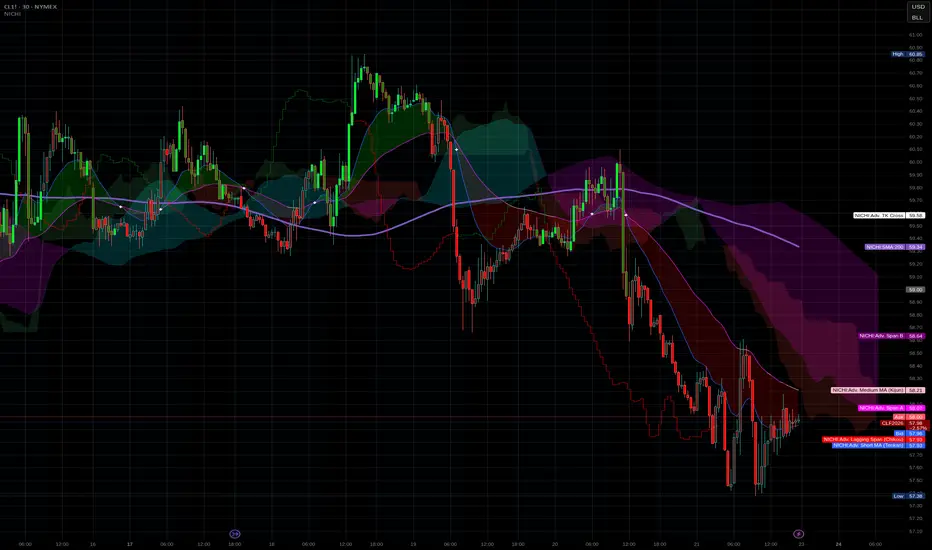
NICHI Beta (NuwenPham's Ichimoku)# **NuwenPham’s Ichimoku (NICHI)**
**Version BETA.251123a.3.1.2 – Pine Script v6**
**Author:** NuwenPham
**Forked from:** Donovan Wall
**Contributors:** Claude (Anthropic)
**License:** MPL 2.0
---
# **Overview**
**NICHI (Nuwen’s Ichimoku)** is a next-generation Ichimoku system that merges the classical Hosoda Ichimoku with a modular adaptive-smoothing engine, enhanced Kumo logic, directional trend counters, and multi-mode bar coloring.
The indicator includes **two completely separate Ichimoku engines**:
* **Standard Ichimoku** – Traditional Donchian-based Tenkan, Kijun, Senkou A/B, and Chikou
* **Advanced Ichimoku** – Fully customizable Ichimoku using 15+ moving-average filters and enhanced logic
NICHI is designed for modern markets—especially **futures and volatile instruments** (NG, CL, ES, NQ, crypto).
---
# **Key Features**
## **1. Dual Ichimoku Systems**
* **Standard Mode:**
Classic Donchian Ichimoku with Tenkan, Kijun, Senkou A/B, and Chikou.
Clean, faithful implementation.
* **Advanced Mode:**
Every Ichimoku line uses a **selected smoothing filter** (EMA, KAMA, FRAMA, Hull, McGinley, etc.).
Includes directional persistence tracking, enhanced cloud logic, and adaptive bar coloring.
---
## **2. Advanced Filter Engine (15+ Smooth Types)**
Use any of the following for Tenkan, Kijun, Senkou B, or Chikou:
* EMA
* DEMA
* SMA
* SMMA (RMA)
* WMA
* VWMA
* Hull MA
* ALMA
* LSMA (Linear Regression)
* McGinley Dynamic
* KAMA
* FRAMA
* COVWMA
* Moving Median
* 50th Percentile (Nearest Rank)
This transforms Ichimoku into an **adaptive trend system**.
---
## **3. Enhanced Cloud (Kumo) Modeling**
* Independent forward offsets for Span A & Span B
* Cloud colors adapt based on strength, direction, and filter behavior
* Cloud thickness reflects volatility
* Neutral cloud state available when spans disagree
---
## **4. Directional Persistence Counters**
NICHI tracks the **trend streak** of each main component:
* Tenkan rising/falling
* Kijun rising/falling
* Span A rising/falling
* Span B rising/falling
These counters make cloud and line colors more accurate and stable.
---
## **5. Regime-Based Bar Coloring (3 Modes)**
NICHI includes three built-in trading frameworks:
### **Mode 1: Kumo-Based**
Bar color reflects price relative to the cloud:
* Green = Above Kumo
* Red = Below Kumo
* Orange = Inside Kumo
Ideal for **trend-following** and **market regime detection**.
---
### **Mode 2: Tenkan/Kijun-Based**
Bar color reflects momentum structure:
* Green = Price above both Tenkan & Kijun
* Red = Price below both
Designed for **momentum entries and TK breakouts**.
---
### **Mode 3: Chikou-Based**
Bars reflect historical confirmation:
* Green = Chikou > price (offset period)
* Red = Chikou < price
Excellent for **confirmation-first strategies** where accuracy matters most.
---
## **6. Multi-MA Overlay System**
Up to **four optional moving averages**:
* SMA, EMA, SMMA, WMA, HMA, VWMA
* Independent lengths, widths, colors
* Useful for bias, confluence, trend filters
Default: **SMA 200** enabled.
---
## **7. TK Cross Signals**
Both systems show TK crosses:
* Standard TK Cross (classic)
* Advanced TK Cross (filtered version)
Crosses appear with clear markers for entry/exit logic.
---
# **How to Use NICHI**
## **1. Choose Your Engine**
* **Standard:** Clean, classic Ichimoku
* **Advanced:** Adaptive, filter-driven Ichimoku
* **Both:** Comparative analysis
---
## **2. Select Your Filter Type (Advanced Mode)**
Suggested filters:
| Market | Filter Type | Notes |
| ---------------- | ---------------- | -------------------------- |
| Natural Gas (NG) | KAMA or FRAMA | Handles extreme volatility |
| Crude Oil (CL) | McGinley Dynamic | Smooths spikes |
| ES / NQ | SMMA or WMA | Balanced response |
| Crypto | Hull or ALMA | Handles momentum bursts |
| FX | EMA or SMMA | Classic, stable |
---
## **3. Choose a Bar-Color Strategy**
* **Kumo-Based:** Trend following
* **TK-Based:** Momentum and breakouts
* **Chikou-Based:** Highest confirmation/accuracy
Each strategy is valid and intentionally distinct.
---
## **4. Reading the Cloud**
* **Bullish Cloud:** Span A > Span B
* **Bearish Cloud:** Span A < Span B
* **Neutral Cloud:** Disagreement between spans
* **Thick Cloud:** High volatility / stronger structure
* **Thin Cloud:** Weak trend / potential twist
---
## **5. Entry & Exit Concepts**
### **Entries**
* **Momentum Entry:** TK cross with price above the cloud
* **Reversal Entry:** TK cross before a cloud twist
* **Confirmation Entry:** Chikou breaks cleanly above/below past price
### **Exits**
* Price falling through Kijun
* Re-entering the cloud
* Opposite TK cross
* Cloud flipping against position
---
# **Recommended Trading Approaches**
## **Kumo-Based Trend Strategy**
* Long above cloud, short below
* Avoid signals inside cloud
Best for swing/position trading.
---
## **TK-Based Momentum Strategy**
* Enter on Tenkan/Kijun breakout
* Bar color confirms momentum
* Cloud filter optional but helps
Great for high-velocity markets.
---
## **Chikou-Based Confirmation Strategy**
* Enter only when Chikou confirms structure
* Highest accuracy, fewest trades
* Ideal for volatile markets (NG, CL)
---
# **Closing Notes**
NICHI is a **research-grade Ichimoku framework** designed to handle modern volatility where traditional Ichimoku often fails.
It supports scalpers, swing traders, and system developers alike.
Experiment with:
* Filter types
* Cloud offsets
* Bar-color modes
* MA overlays
to match your strategy and market.
Simple Moving Averages (5, 10, 20, 60, 120, 200SMA for different time frames.
Covers 5, 10, 20, 60, 120, 200 sma units
Alg0 ۞ Hal0 Triple EMA BlastFully customizable and stand-alone comprehensive indicator for scalping and short-term trading.
Cheers!
A۞H
Multi-Period MA Custom DisplayMulti-Period MA Custom Display / 多周期MA自定义显示
@ y4n9m0n3y
Professional Multi-Moving Average Indicator
This advanced MA indicator provides complete flexibility to display up to 10 different moving averages with fully customizable periods, colors, and display settings. Perfect for traders who need multiple timeframe analysis in one clean overlay.
Key Features:
9 independent MA lines with individual period control (1-1000 periods)
Toggle visibility for each MA line to avoid chart clutter
MA type selection: SMA, SMMA, EMA, or WMA calculation methods
专业多周期移动平均线指标
这款高级MA指标提供完整的灵活性,可显示最多9条不同的移动平均线,每条均线均可自定义周期、颜色和显示设置。适合需要在一个图表中进行多时间框架分析的交易者。
核心功能:
9条独立MA线,周期可自定义(1-1000周期)
可单独切换每条MA线的显示,避免图表混乱
MA类型选择:SMA、SMMA、EMA或WMA计算方式

[CASH] Crypto And Stocks Helper (MultiPack w. Alerts)ATTENTION! I'm not a good scripter. I have just learned a little basics for this project, stolen code from other public scripts and modified it, and gotten help from AI LLM's.
If you want recognition from stolen code please tell me to give you the credit you deserve.
The script is not completely finished yet and contains alot of errors but my friends and family wants access so I made it public.
_________________________________________________________________________________
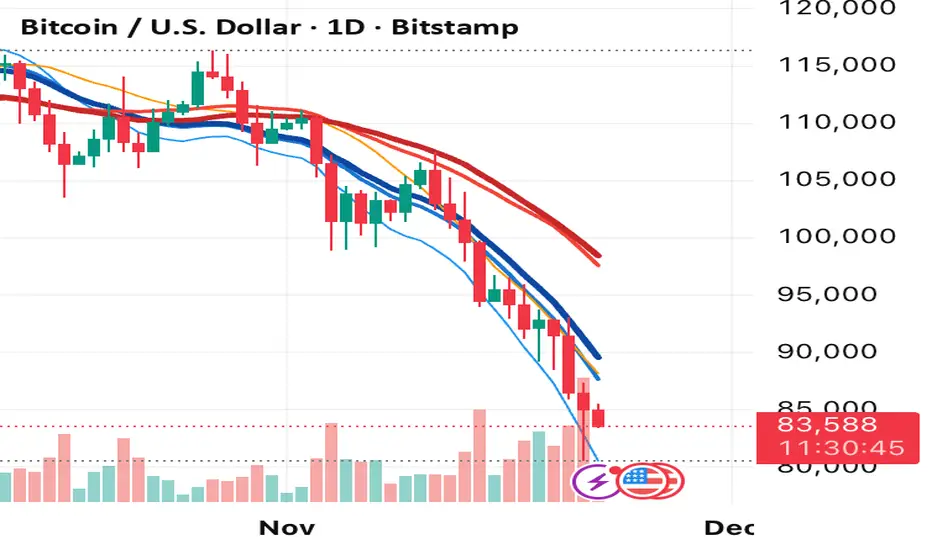
CASH has multiple indicators (a true all-in-one multipack), guides and alerts to help you make better trades/investments. It has:
- Bitcoin Bull Market Support Band
- Dollar Volume
- 5 SMA and 5 EMA
- HODL Trend (a.k.a SuperTrend) indicator
- RSI, Volume and Divergence indicators w. alerts
More to come as well, like Backburner and a POC line from Volume Profile.
Everything is fully customizable, appearance and off/on etc.
More information and explainations along with my guides you can find in settings under "Input" and "Style".

Momentum Tide [Alpha Extract]A sophisticated momentum-based trend identification system that measures normalized price deviation from an EMA baseline using ATR scaling and hyperbolic tangent smoothing for precise trend state classification. Utilizing advanced signal processing with configurable neutral bands and slope sensitivity adjustments, this indicator delivers institutional-grade momentum analysis with continuous strength measurement and visual trend confirmation. The system's three-state classification (bullish, bearish, neutral) combined with dynamic color intensity scaling provides comprehensive market momentum assessment across varying volatility conditions.
🔶 Advanced Baseline Deviation Framework
Implements EMA-based baseline calculation with ATR-normalized deviation measurement to create volatility-adjusted momentum signals. The system calculates raw price deviation from the baseline, scales by ATR and slope sensitivity factor, then applies exponential smoothing for stable signal generation with reduced noise and false transitions.
// Core Momentum Calculation
Baseline = ta.ema(close, Baseline_Length)
ATR_Value = ta.atr(ATR_Length)
Raw_Deviation = (close - Baseline) / (ATR_Value * Slope_Scaler)
Signal = ta.ema(Raw_Deviation, Signal_Smoothing)
🔶 Hyperbolic Tangent Normalization Engine
Features sophisticated tanh transformation that clamps raw deviation signals into normalized -1 to +1 range for consistent interpretation across all market conditions. The system applies safe exponential calculations with value capping to prevent overflow while maintaining signal sensitivity, creating bounded momentum readings suitable for systematic threshold analysis.
// Tanh Normalization
Clamped_Signal = tanh(Signal) // Bounded to
Strength = abs(Clamped_Signal) // Momentum intensity
🔶 Three-State Classification System
Implements intelligent trend state determination using configurable neutral band thresholds to reduce whipsaw signals during ranging conditions. The system classifies market as bullish (+1) when momentum exceeds upper neutral band, bearish (-1) below lower neutral band, and neutral (0) within the band, providing clear directional bias with built-in consolidation recognition.
🔶 Dynamic Color Intensity Architecture
Provides advanced visual feedback through momentum strength-based color intensity modulation, where stronger trends display more opaque colors and weaker trends show increased transparency. The system dynamically adjusts color alpha values based on absolute momentum strength, creating intuitive visual representation of trend conviction across baseline, candles, and bars.
🔶 Trend Strength Meter Visualization
Features innovative horizontal gradient meter displaying real-time momentum position across bear-to-bull spectrum with 24-segment resolution. The system creates smooth color transitions from bearish red through neutral gray to bullish green, with arrow indicator showing precise momentum location for instant trend strength assessment without cluttering the price chart.
🔶 Intelligent Flip Detection System
Generates transition markers when trend state changes from neutral/bearish to bullish or neutral/bullish to bearish, with duplicate signal suppression to prevent marker clustering. The system tracks previous signal states and only plots new markers on genuine trend reversals, providing clean entry signal visualization for systematic trading approaches.
snapshot
🔶 Configurable Neutral Band Framework
Implements adjustable neutral zone width using ATR percentage parameters to optimize signal frequency for different trading styles and market conditions. Wider bands reduce flip frequency for position trading while tighter bands increase sensitivity for active trading strategies, enabling customization without code modification.
🔶 Slope Sensitivity Adjustment
Features slope scaler parameter that modulates ATR normalization factor, controlling signal smoothness versus responsiveness trade-off. Higher values create smoother momentum readings with fewer transitions while lower values increase snappiness for faster reaction to price changes, allowing optimization across different volatility regimes and timeframes.
🔶 Comprehensive Visual Integration
Provides multi-dimensional trend visualization through color-coded baseline overlay, momentum-synchronized candle coloring, and bar color modification with configurable display toggles. The system includes optional flip markers and strength meter with position control for complete chart integration without visual overload.
🔶 Performance Optimization Framework
Utilizes efficient calculation methods with optimized table management for strength meter updates and minimal computational overhead for real-time momentum processing. The system includes intelligent state tracking and safe mathematical operations to prevent errors during extreme market conditions while maintaining consistent performance.
🔶 Why Choose Momentum Tide ?
This indicator delivers sophisticated momentum-based trend analysis through normalized deviation measurement and intelligent three-state classification. Unlike traditional momentum oscillators that operate in separate windows, Momentum Tide integrates directly with price action through baseline overlay and candle coloring while providing the analytical depth of bounded momentum measurement. The system's combination of tanh normalization, configurable neutral bands, dynamic color intensity, and innovative strength meter makes it essential for traders seeking adaptive trend-following approaches with clear visual feedback across cryptocurrency, forex, and equity markets. The three-state system naturally filters ranging periods while the momentum strength measurement enables position sizing and confidence assessment for systematic trading strategies.

MA % Deviation ChannelMA % Deviation Channel — an indicator for measuring price deviation from the moving average
MA % Deviation Channel (MA%DC) is a visual analysis tool that shows how far the current price deviates from a selected moving average, expressed in percentages. The indicator builds dynamic channels based on historical percentage deviations, helping traders identify statistical extremes and use them as potential reversal or continuation zones.
How the indicator works
MA%DC calculates the percentage deviation of High and Low from the chosen MA and stores these values in arrays. Based on the average deviation values, the script plots four key levels:
Avg. High Dev. — average deviation of highs from the MA
Avg. Low Dev. — average deviation of lows from the MA
Avg. Extreme High Dev. — extreme (above-average) deviations of highs
Avg. Extreme Low Dev. — extreme (below-average) deviations of lows
The width of the channel automatically adapts to the selected MA period — the longer the period, the deeper the historical analysis.
Purpose and use cases
MA % Deviation Channel helps:
Evaluate volatility relative to the moving average
Identify overbought and oversold zones based on real price behavior
Filter breakouts and false impulses
Build trend-following and counter-trend strategies using statistical deviations
Advantages
Based on percentage deviation rather than fixed distances
Adaptive to changing market conditions
Supports 5 popular types of moving averages
Settings
MA Source — data source for the moving average
MA Type — moving average type (SMA, EMA, WMA, VWMA, RMA)
MA Length — smoothing period
Visual elements
The moving average line
Average deviation channels
Extreme deviation channels
Color fills between levels for improved readability

HTF BIAS FILTER🧭HTF Bias Filter Indicator: 5 in 1 indicator
Technical Overview
The Bias Filter is a comprehensive multi-timeframe tool designed to confirm directional bias using five key indicators before entering a trade. It plots higher-timeframe Moving Averages directly on the chart and provides an immediate status summary via a static dashboard.
The more confluence on the dashboard, the greater the probability of the direction of the trade.
1. 📊 Display Components
A. Plotted Lines
The indicator uses the request.security function to draw Moving Averages from higher timeframes onto your current chart:
1H EMA 21 (Purple): The 21-period Exponential Moving Average calculated on the 1-Hour (60 min) chart. Plotted using a step-line style.
4H EMA 50 (Red): The 50-period Exponential Moving Average calculated on the 4-Hour (240 min) chart. Plotted using a step-line style.
B. Directional Dashboard
A fixed-position summary table is anchored to the bottom-right corner of the chart, providing a quick glance at the current status of all five filters.
2. 🎨 Colour Logic
Each of the five indicators is assigned a colour based on its current directional signal. The more indicators that show the same colour (confluence), the stronger the signal and the higher the likelihood of a high-probability trade.
🟢 Green indicators are signaling UP/BUY (Bullish momentum or trend).
🔴 Red indicators are signaling DOWN/SELL (Bearish momentum or trend).
⚫ Gray indicators are signaling Mixed or flat directions (neutral or undecided).
Note: The dashboard's main header color is determined by a strict confluence logic (All four 4H filters must align for Green/Red), while individual indicator colors follow the simple rules above.
3. 📋 Indicator Breakdown and Logic
The dashboard provides the direction of five different filters.
3.1. Higher-Timeframe (HTF) Trend Indicators
These two signals determine the immediate slope and direction of the primary Moving Averages:
4H EMA 50:
Timeframe: 4-Hour (240 min)
Logic: Compares the current EMA value to the value two bars ago on the 4H chart.
Output: UP ↑, DOWN ↓, or FLAT ⏸
1H EMA 21:
Timeframe: 1-Hour (60 min)
Logic: Compares the current EMA value to the value two bars ago on the 1H chart.
Output: UP ↑, DOWN ↓, or FLAT ⏸
3.2. 4-Hour Confluence Filters
These three indicators provide supplementary confirmation on Volume, Price Position, and Momentum, all calculated on the 4-Hour (240 min) chart:
4H OBV (Smoothed):
Timeframe: 4-Hour (240 min)
Logic: Direction is based on the current value of the 21-bar smoothed On-Balance Volume (OBV) compared to its value nine bars ago.
Output: UP ↑, DOWN ↓, or FLAT ⏸
4H ATR DIR (EMA Proxy):
Timeframe: 4-Hour (240 min)
Logic: Determines the price position by comparing the current Close price against the 4H EMA 50.
Output: BUY 🟢 (Close > EMA 50), SELL 🔴 (Close < EMA 50), or FLAT ⏸️ (Close = EMA 50).
4H RSI (14):
Timeframe: 4-Hour (240 min)
Logic: Momentum check comparing the 14-period Relative Strength Index (RSI) value against the 50 level.
Output: BUY 🟢 (RSI > 50), SELL 🔴 (RSI < 50), or FLAT ⏸️ (RSI = 50).

RSI Hybrid + EMA Cloud + Swings(15m/2H)RSI Hybrid + EMA Cloud (15m Trend + 2H Momentum)
A dual-timeframe trading system combining fast 15-minute trend structure with higher-timeframe 2-Hour momentum, volume and structural levels.
🧩 What This Indicator Does
This tool blends:
🔹 15m Trend (EMA Cloud) – 2 Points
EMA 7 vs 21 → Short trend
EMA 30 vs 74 → Long trend
Cloud shading highlights bullish/bearish alignment
Faster, intraday trend sensitivity
🔹 2H Momentum (RSI Hybrid) – 3 Points
RSI > 50
RSI > SMA(4)
RSI > SMA(12)
Gives short / medium / long momentum confirmation from the higher timeframe.
🔹 2H Volume Pressure – 1 Point
Volume vs 20-SMA
Mild / Moderate / Strong Bull/Bear
Confirms true participation behind price moves
⭐ Score System (0–6 Total)
Component Points
15m EMA Trend 2
2H RSI Hybrid 3
2H Volume Power 1
Total 6
Interpretation:
5–6 → High-confluence direction
3–4 → Partial confluence
1–2 → Weak bias
0 → No reliable direction
Designed for discretionary and semi-systematic intraday traders.
📊 15m Structural Levels
Includes:
✔ Last confirmed 15m Swing High / Swing Low
Based on close-price pivots, not highs/lows.
✔ Live Running High since last Swing LOW
Tracks how far price has extended upward.
✔ Live Running Low since last Swing HIGH
Tracks downward extension after a swing high.
✔ ATR(15m)
Volatility reference for SL/TP or risk modeling.
These levels help in timing entries, managing stops, and identifying breakout/breakdown zones.
🖥 On-Chart Info Table
Summarizes:
15m EMA short & long trend
2H RSI short/medium/long momentum
RSI vs 50
2H volume power
Bull & Bear score (with breakdown)
Last 15m swing highs/lows
ATR(15m)
Color-coded for clarity
💡 Why Use This Indicator
High-speed 15m trend detection
Higher-TF 2H momentum & volume confirmation
Multi-layered bias presented in a simple score
Built-in structure for more intelligent entries/exits
Works on indices, stocks, FX, crypto
Ideal for intraday traders who want speed + reliability

FortesThis script generates buy and sell alerts based on the crossover of two EMAs (9 and 21). When the 9 EMA crosses above the 21 EMA, it signals a buy; when it crosses below, it signals a sell. Simple and effective for EMA crossover trading.
MTF EMA Directional Bias -1hr and 4hr A compact, fixed-position table (bottom-right corner) that shows the current slope direction of two higher-timeframe EMAs:
4H EMA 50 → direction over the last 2 bars (UP ↑, DOWN ↓, or FLAT ⏸)
1H EMA 21 → direction over the last 2 bars (UP ↑, DOWN ↓, or FLAT ⏸)
Background color logic:
Green → both 4H and 1H EMAs are sloping upward
Red → both 4H and 1H EMAs are sloping downward
Gray → mixed or flat directions (no confluence)
Additionally draws the actual 1H EMA-21 (purple) and 4H EMA-50 (red) as step-lines on the chart.

20/50/200 EMA with RVOL Filter Hariss 369Understanding to trade with this indicator is very simple. 20 EMA acts as dynamic support and resistance. 50 EMA is best for intraday/short term trend filter and 200 EMA is best for long term trend filter. One should always trade with the trend. Combination of all threes entails safe trading with trend. Undoubtedly, volume plays vital role to move the price up or down. The volume indicator used here is Relative Volume (RVOL) rather simple volume. 1.5 RVOL is considered as strong trend to trade considering other factors intact. You can tick/untick RVOL and you can also change the level of RVOL from input section.
You can also change the color of EMAs and pattern of buy and sell signal. Place this indicator over the chart. You can choose any type of asset and any time frame.
Though buy and sell signals are there. The concept of trading is buy when price closes above 20 ema and 20 ema >50ema>200 ema. Place stop loss below the low of last candle or just below 20 ema. Target 1.5/2 times of stop loss. You can also trail it with 20 ema or 50 ema depending upon your trading style and risk appetite. You can also take positional trade, in that case 200 ema to be considered as stop loss. Sell when price closes below 20 ema, 20 ema<50ema<200 ema. For intraday trading, 20 ema is best to enter and exit. Taking RVOL into consideration is best way in order to trade with high liquidity-safer way to entry and exit.

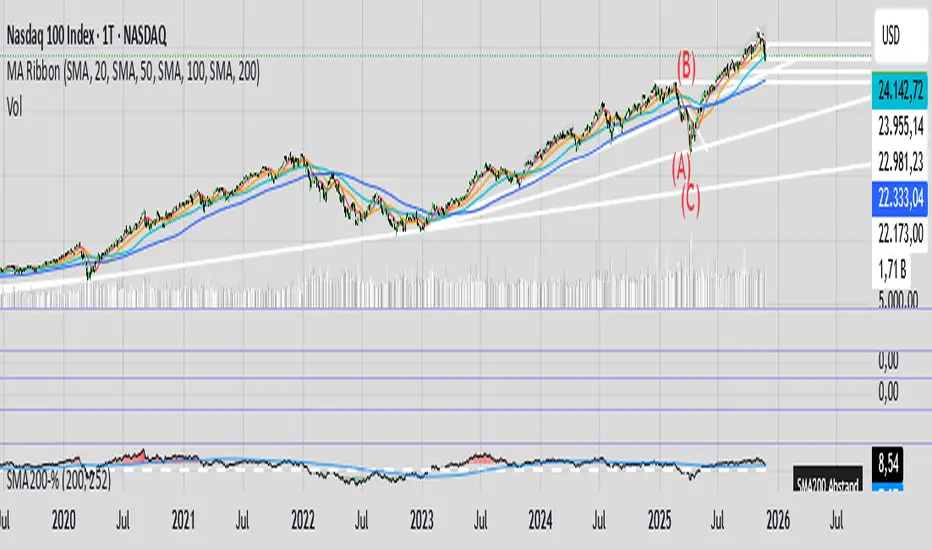
200SMA Distance OscillatorThe oscillator measures the percentage deviation of closing price x from SMA200.
The idea behind the oscillator was preceded by an analysis of how often MAs in the index hold/bounce or are broken through.
Basically, the idea was about index analysis, i.e., the macro picture of a market.
Who wants to buy individual stocks when the overall market is plummeting ;-)
Or in other words: How long are you long in a market? When is it time to take profits?
After the analysis of the stability of SMAs in the index was rather modest (ratio of just under 6:4 for bounce to breakout – overall in 20, 50, 100, and 200 frames from 2020 to 2025), it was noticeable that the percentage over- or underperformance was scalable, especially in indices.
And since indices generally move upwards, there were fixed limits for over- and underestimations – especially in the longer term (SMA200) – unlike with individual stocks.
It is therefore more a question of macro trends and less of short-term movements, e.g., in day trading.
It was now interesting to see at what percentage range counter-movements were likely – particularly in the positive range for profit-taking, but of course also in the negative range for entry into sold-off markets.
If, for example, closing prices around +25% above SMA200 were reached in the NDX, the probability is very high that the market has overreacted and an interim correction will follow – so the theory goes.
On the other hand, continuous levels of +5 to +10% are a product of healthy positive development in a bull market and do not necessarily require action.
The oscillator was specifically designed for the NDX, but can also be used for the SPX and others.
The style was based on the RSI, so that the color level rises from 10% to 20% (overbought/oversold principle).
Based on manually examined movements, the criteria were set as follows:
+/-10% = flow / no color background
> +/-10% = border areas / color background
The center line represents the 252 average of the percentage deviations and could also be used as a trigger, provided it has been historically examined and is valid.
The oscillator is very interesting because it behaves completely differently from one financial instrument to another and, as a result, also in the timeframes (4h, D, W).
It would probably make sense to change the flow and border levels in the code when using it outside of indices.
The fact is that the oscillator must be “adjusted” to each instrument in order to achieve its goal of providing the best possible prediction. “Adjusting” refers to the analysis of the levels at which an instrument/asset usually reacts.
As with all indicators and oscillators, it is advisable to take other indicators and, in particular, macro news into account when analyzing this development.
If I find any substantial correlations with other indicators, I will be happy to provide an update.
The idea came from me, the code from Grok.
The code is not 100% perfect, but the data (percentage deviation, color background) is correct according to initial analysis.
In the settings, you can make the lines of the plots invisible. This makes the oscillator clearer. You can also adjust the settings for the average line.
DeltaATR + VWAP DIF + MA'sI attempted to create an indicator using a different approach to analyzing potential trend reversals, and although it is still a work in progress, it is already fully functional. The indicator combines the price relative to VWAP with ATR normalization, providing a way to measure deviations in terms of market volatility.
How the indicator works:
Delta Calculation:
The core of the indicator calculates the difference between the current price and the VWAP (Volume Weighted Average Price), then normalizes this difference by the ATR (Average True Range). This provides a volatility-adjusted measure of how far the price has moved relative to its typical range.
Histogram Visualization:
The deltaATR is displayed as a histogram, where positive values indicate the price is above VWAP and negative values indicate it is below. The histogram is color-coded for easy interpretation: typically red for above VWAP and green for below, with configurable transparency.
Dual Moving Averages:
Two moving averages (fast and slow) are applied to the deltaATR. This creates a crossover system:
When the fast average crosses above the slow average, it may indicate an upcoming bullish reversal.
When the fast average crosses below the slow average, it may indicate a potential bearish reversal.
Zero Line Reference:
A reference line at zero corresponds to VWAP, helping traders see whether price is generally above or below the average volume-weighted level.
Alert Lines (Optional Panel):
A second panel provides four configurable alert lines, allowing users to set key thresholds to monitor extreme deltaATR values. These lines are thin, dashed, and fully customizable in terms of color and thickness.
Panel for Values and Signals:
The indicator includes a side panel showing:
Current deltaATR
Fast and slow averages
Current trend signal (Bullish, Bearish, or Neutral)
How it can be used:
Identify potential trend reversals by monitoring the crossover between the fast and slow averages of deltaATR.
Use the histogram to observe when the price is deviating significantly from VWAP in terms of ATR.
Set alert lines for specific thresholds to highlight overextended conditions or significant volatility moves.
Combine with other technical indicators for confirmation before entering or exiting trades.
This indicator is particularly useful for traders looking to anticipate reversals in volatile markets, as it adapts the delta measure to the current market conditions using ATR normalization, making it more responsive and robust than raw price deviations alone.

9/21 EMA Trend TOP rIGHT CORNER INDICATORCrossover indicator for the 9 & 21 EMA. Buy Sell for cross up or down respectively. Daily, weekly and Monthly trend.

Thi Cloud EMA SystemThis is a spinoff of the Ripster's cloud system.
I altered it in order to be more accurate using the 5 min candle instead of the 10

GBPUSD Weekly Cross LinesThis indicator tracks 20/50 EMA crossovers on GBPUSD (Weekly timeframe) and displays the crossover points across all symbols and timeframes, allowing traders to visually align current price action with key historical turning points in GBPUSD.
The script works by detecting bullish (20 EMA crossing above 50 EMA) and bearish (20 EMA crossing below 50 EMA) signals since 2010, using request.security() to source data from GBPUSD weekly candles, even if the indicator is applied to AAPL, EURJPY, BTCUSD, or any other asset.
Each crossover is marked with a vertical line that persists across all charts, offering a powerful way to:
Compare current market context with GBPUSD’s historical trend shifts
Observe intermarket correlations
Align trading timing across multiple assets
Spot macro trend transitions that ripple across global markets

Uptrick: Dynamic Z-Score DivergenceIntroduction
Uptrick: Dynamic Z-Score Divergence is an oscillator that combines multiple momentum sources within a Z-Score framework, allowing for the detection of statistically significant mean-reversion setups, directional shifts, and divergence signals. It integrates a multi-source normalized oscillator, a slope-based signal engine, structured divergence logic, a slope-adaptive EMA with dynamic bands, and a modular bar coloring system. This script is designed to help traders identify statistically stretched conditions, evolving trend dynamics, and classical divergence behavior using a unified statistical approach.
Overview
At its core, this script calculates the Z-Score of three momentum sources—RSI, Stochastic RSI, and MACD—using a user-defined lookback period. These are averaged and smoothed to form the main oscillator line. This normalized oscillator reflects how far short-term momentum deviates from its mean, highlighting statistically extreme areas.
Signals are triggered when the oscillator reverses slope within defined inner zones, indicating a shift in direction while the signal remains in a statistically stretched state. These mean-reversion flips (referred to as TP signals) help identify turning points when price momentum begins to revert from extended zones.
In addition, the script includes a divergence detection engine that compares oscillator pivot points with price pivot points. It confirms regular bullish and bearish divergence by validating spacing between pivots and visualizes both the oscillator-side and chart-side divergences clearly.
A dynamic trend overlay system is included using a Slope Adaptive EMA (SA-EMA). This trend line becomes more responsive when Z-Score deviation increases, allowing the trend line to adapt to market conditions. It is paired with ATR-based bands that are slope-sensitive and selectively visible—offering context for dynamic support and resistance.
The script includes configurable bar coloring logic, allowing users to color candles based on oscillator slope, last confirmed divergence, or the most recent signal of any type. A full alert system is also built-in for key signals.
Originality
The script is based on the well-known concept of Z-Score valuation, which is a standard statistical method for identifying how far a signal deviates from its mean. This foundation—normalizing momentum values such as RSI or MACD to measure relative strength or weakness—is not unique to this script and is widely used in quantitative analysis.
What makes this implementation original is how it expands the Z-Score foundation into a fully featured, signal-producing system. First, it introduces a multi-source composite oscillator by combining three momentum inputs—RSI, Stochastic RSI, and MACD—into a unified Z-Score stream. Second, it builds on that stream with a directional slope logic that identifies turning points inside statistical zones.
The most distinctive additions are the layered features placed on top of this normalized oscillator:
A structured divergence detection engine that compares oscillator pivots with price pivots to validate regular bullish and bearish divergence using precise spacing and timing filters.
A fully integrated slope-adaptive EMA overlay, where the smoothing dynamically adjusts based on real-time Z-Score movement of RSI, allowing the trend line to become more reactive during high-momentum environments and slower during consolidation.
ATR-based dynamic bands that adapt to slope direction and offer real-time visual zones for support and resistance within trend structures.
These features are not typically found in standard Z-Score indicators and collectively provide a unique approach that bridges statistical normalization, structure detection, and adaptive trend modeling within one script.
Features
Z-Score-based oscillator combining RSI, StochRSI, and MACD
Configurable smoothing for stable composite signal output
Buy/Sell TP signals based on slope flips in defined zones
Background highlighting for extreme outer bands
Inner and outer zones with fill logic for statistical context
Pivot-based divergence detection (regular bullish/bearish)
Divergence markers on oscillator and price chart
Slope-Adaptive EMA (SA-EMA) with real-time adaptivity based on RSI Z-Score
ATR-based upper and lower bands around the SA-EMA, visibility tied to slope direction
Configurable bar coloring (oscillator slope, divergence, or most recent signal)
Alerts for TP signals and confirmed divergences
Optional fixed Y-axis scaling for consistent oscillator view
The full setup mode can be seen below:
Input Parameters
General Settings
Full Setup: Enables rendering of the full visual system (lines, bands, signals)
Z-Score Lookback: Lookback period for normalization (mean and standard deviation)
Main Line Smoothing: EMA length applied to the averaged Z-Score
Slope Detection Index: Used to calculate directional flips for signal logic
Enable Background Highlighting: Enables visual region coloring in
overbought/oversold areas
Force Visible Y-Axis Scale: Forces max/min bounds for a consistent oscillator range
Divergence Settings
Enable Divergence Detection: Toggles divergence logic
Pivot Lookback Left / Right: Defines the structure of oscillator pivot points
Minimum / Maximum Bars Between Pivots: Controls the allowed spacing range for divergence validation
Bar Coloring Settings
Bar Coloring Mode:
➜ Line Color: Colors bars based on oscillator slope
➜ Latest Confirmed Signal: Colors bars based on the most recent confirmed divergence
➜ Any Latest Signal: Colors based on the most recent signal (TP or divergence)
SA-EMA Settings
RSI Length: RSI period used to determine adaptivity
Z-Score Length: Lookback for normalizing RSI in adaptive logic
Base EMA Length: Base length for smoothing before adaptivity
Adaptivity Intensity: Scales the smoothing responsiveness based on RSI deviation
Slope Index: Determines slope direction for coloring and band logic
Band ATR Length / Band Multiplier: Controls the width and responsiveness of the trend-following bands
Alerts
The script includes the following alert conditions:
Buy Signal (TP reversal detected in oversold zone)
Sell Signal (TP reversal detected in overbought zone)
Confirmed Bullish Divergence (oscillator HL, price LL)
Confirmed Bearish Divergence (oscillator LH, price HH)
These alerts allow integration into automation systems or signal monitoring setups.
Summary
Uptrick: Dynamic Z-Score Divergence is a statistically grounded trading indicator that merges normalized multi-momentum analysis with real-time slope logic, divergence detection, and adaptive trend overlays. It helps traders identify mean-reversion conditions, divergence structures, and evolving trend zones using a modular system of statistical and structural tools. Its alert system, layered visuals, and flexible input design make it suitable for discretionary traders seeking to combine quantitative momentum logic with structural pattern recognition.
Disclaimer
This script is for educational and informational purposes only. No indicator can guarantee future performance, and trading involves risk. Always use risk management and test strategies in a simulated environment before deploying with live capital.

Daily vs Monthly VWAP CrossoverDaily vs Monthly VWAP Crossover Strategy
Description:
Overview This indicator is a trend-following tool designed to identify significant shifts in market sentiment by comparing short-term institutional value against the longer-term trend. It utilizes Anchored VWAP (Volume Weighted Average Price) logic to track the average price paid by traders for the current Day versus the current Month.
How It Works Unlike standard Moving Averages which lag significantly, VWAP factors in volume, making it a preferred benchmark for institutional traders.
Daily VWAP (Fast Line): Anchors at the start of the current trading day. It represents the intraday equilibrium price.
Monthly VWAP (Slow Line): Anchors at the start of the current month. It represents the broader value consensus for the month.
The indicator calculates these values cumulatively on every tick/bar, regardless of the chart timeframe selected (e.g., 30m, 1h).
Trading Logic & Signals The strategy is based on the concept of value migration:
BUY Signal (Bullish Reversal): Triggers when the Daily VWAP crosses ABOVE the Monthly VWAP. This suggests that short-term buying pressure and volume are pushing the price higher than the monthly average cost basis, indicating a potential breakout or trend continuation.
SELL Signal (Bearish Reversal): Triggers when the Daily VWAP crosses BELOW the Monthly VWAP. This indicates that intraday weakness has dragged the price below the month's average value, signaling potential downside momentum.
Features
Visual Crossovers: Clearly marked "B" (Buy) and "S" (Sell) labels on the chart.
Trend Background: The background color changes subtly (Green/Red) to indicate the current dominance of the Daily vs. Monthly trend.
Alerts: Fully compatible with TradingView alerts for real-time notifications on crossovers.
Best Practices
Timeframe: Designed optimally for intraday charts such as 30-minute or 1-hour timeframes.
Confirmation: As with any VWAP strategy, this works best when combined with price action analysis (e.g., breakout of key resistance) rather than used blindly in choppy, sideways markets.
Multi Time Frame EMA & MA IndicatorThis indicator automatically applies prime-number EMAs and MAs based on the current chart timeframe, using faster cool-tone EMAs and slower warm-tone MAs to clearly distinguish momentum vs trend.
It adapts dynamically for 1m, 5m, 15m, 1H, 4H, and 1D charts, and uses a visual hierarchy where thinner lines represent faster averages and thicker lines represent slower ones, ensuring clarity in both light and dark themes.
An on-chart label displays which EMA and MA lengths are active for the selected timeframe.