Sell-to-Buy Pressure RatioSell/Buy Pressure Ratio
What It Measures
The Sell/Buy Pressure Ratio quantifies the aggressiveness of sellers versus buyers by comparing conviction-weighted volume on down candles versus up candles. It answers a simple question: who is more committed right now—buyers or sellers?
How It Works
The indicator examines each candle and determines directional conviction based on where price closes within the bar's range. A candle that closes near its high shows strong buyer conviction. A candle that closes near its low shows strong seller conviction. This conviction percentage is then multiplied by volume to create a weighted measure of buying and selling pressure.
The ratio divides total selling pressure by total buying pressure over a lookback period. A ratio of 1.5 means sellers are 50% more aggressive than buyers. A ratio of 0.5 means buyers are twice as aggressive as sellers.
Key Features
Conviction weighting: Not all volume is equal. A strong close near the high counts more than a weak close mid-range.
Doji handling: Indecisive candles (where open and close are nearly equal) split volume 50/50 between buyers and sellers.
Volume filtering: Low-volume bars below 60% of average are excluded to focus on meaningful activity.
Normalized output: Optional -1 to +1 scale for cross-stock comparison.
Interpretation
RatioMeaning≤ 0.5Strong buyers — accumulation, continuation setups0.5 – 0.8Buyers favored — healthy environment for longs0.8 – 1.2Balanced — equilibrium, wait for direction1.2 – 1.5Sellers favored — caution warranted≥ 1.5Strong sellers — distribution, avoid new longs
Primary Use
Timing entries within confirmed trends. The ratio identifies when selling pressure has exhausted itself, signaling safer entry points. Rather than buying strength, traders wait for the ratio to transition from elevated levels back toward equilibrium—buying when selling stops being dangerous.
What It Does Not Do
This indicator does not predict direction. It measures current pressure dynamics. Pair it with trend analysis (moving averages, price structure) to determine direction, then use the pressure ratio to time entries and exits.
ממוצעים נעים

EMA/SMA Full color signal candles💡 What It Does:
The indicator calculates and plots the 21-period Exponential Moving Average (EMA) and the 30-period Simple Moving Average (SMA). It then analyzes the closing price of each candle and colors the entire candlestick (body and border) according to pre-defined trend conditions.
This visualization allows traders to identify strong trend environments versus periods of consolidation or indecision at a glance, removing the need to constantly check the price relationship manually.
🎨 Color Conditions and Meaning:
The indicator uses three distinct color states to signal the market's current momentum:
Color,Condition,Market Interpretation
🟢 GREEN,Closing Price is ABOVE both the 21 EMA AND the 30 SMA.,Strong Bullish Trend: Suggests high momentum and confirmation of an uptrend. Ideal for long bias.
🔴 RED,Closing Price is BELOW both the 21 EMA AND the 30 SMA.,Strong Bearish Trend: Suggests high downward pressure and confirmation of a downtrend. Ideal for short bias.
⚫ GRAY,"Closing Price is in any other state (e.g., between the two MAs, or under one and over the other).","Neutral / Consolidation: Indicates uncertainty, low momentum, or potential trend exhaustion/reversal. Caution is advised."
🔧 Customization Options:The indicator is fully customizable, allowing users to fine-tune the periods to match their preferred trading style (e.g., scalping, swing trading).Dĺžka EMA (Length EMA): Allows you to change the period for the Exponential Moving Average (default is 21).Dĺžka SMA (Length SMA): Allows you to change the period for the Simple Moving Average (default is 30).
I added also Extra 4 EMA lines to have extra edge.
Slope Averages
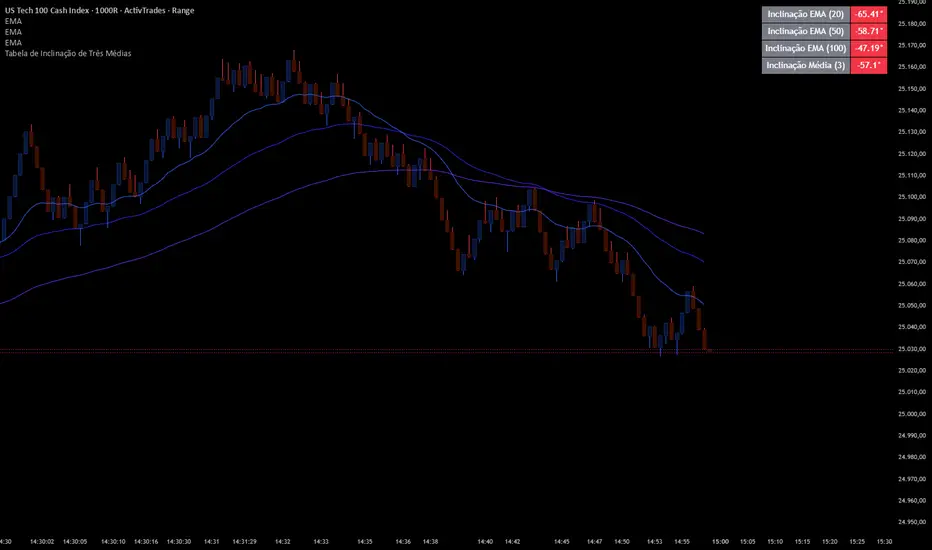
📊 Indicator Overview: Three Moving Averages Slope Table
This indicator is designed to calculate and display the slopes and averages of three different moving averages (MAs) in a table format. It helps traders quickly visualize the direction and strength of multiple moving averages, as well as their combined averages, across different timeframes.
⚙️ Inputs and Configuration
• MA Type 1, 2, 3: Choose the type of moving average for each line. Options:
• (Exponential Moving Average)
• (Simple Moving Average)
• (Weighted Moving Average)
• (Volume-Weighted Moving Average)
• (a custom smoother using multiple EMAs)
• Length 1, 2, 3: Periods for each moving average (e.g., 20, 50, 100).
• Source: The price source used (default = ).
• Extra Timeframes (optional): You can configure up to 3 additional timeframes (e.g., 1h, 4h, Daily) to compare the combined average across different chart periods.
🔧 Functions Explained
1. tilson(src, length)
• A custom moving average that smooths price using 8 sequential EMAs.
• Produces a smoother line than a standard EMA.
2. getMA(src, length, maType)
• Selects the correct moving average type based on user input.
• Returns the chosen MA value.
3. Slope Calculation
• Each slope is calculated as:
• This converts the difference between current and previous MA values into an angle in degrees.
• Positive slope = upward trend, negative slope = downward trend.
4. Combined Slopes
• : Average slope of all three MAs.
• , , : Average slopes of pairs of MAs.
5. Combined Averages
• : Average of MA1 and MA2.
• : Average of MA2 and MA3.
• : Average of MA1 and MA3.
• : Average of all three MAs.
6. Color Function
• : Returns green if value ≥ 0, red if value < 0.
• Used to color table cells for quick visual feedback.
📋 Table Output
The table shows:
1. Individual slopes of MA1, MA2, MA3.
2. Average slope of all three.
3. Combined averages (M1+M2, M2+M3, M1+M3).
4. Combined slopes of pairs.
5. Overall average .
6. Optional: RSI or multi-timeframe averages can also be added.
Each value cell is colored green if positive, red if negative, making it easy to spot bullish or bearish conditions.
🎯 How to Use It
• Trend Strength: Look at the slope values. Steeper positive slopes = stronger uptrend; steep negative slopes = stronger downtrend.
• Confluence: When all three MAs and their combined averages point in the same direction, it signals strong trend alignment.
• Multi-Timeframe Analysis: Configure extra timeframes to see if short-term and long-term averages agree. If they align, confidence in the trend increases.
• RSI Integration (optional): Add RSI to confirm momentum. For example, bullish slope + RSI > 50 = stronger buy signal.
✅ Practical Example
• MA1 = EMA(20), MA2 = SMA(50), MA3 = WMA(100).
• If slope1, slope2, slope3 are all positive and green, and is also green → strong bullish trend.
• If slopes are mixed (some green, some red), the market is consolidating.
• If all slopes are red and is red → strong bearish trend.

UT Bot + SMC PRO (PROP) + VISUAL SIGNALS-DE ALEJANDRO PONCEHOW TO USE THEM TOGETHER (GOLDEN RULE)
Reading Sequence
UT → without B Bounce / pullback
B → without UT Weak break
UT → B (same direction) ✅ Valid setup
UT ↔ Opposite Bs Noise / range

Colored HMA + Color SARThis is a simple yet effective chart setup that I really like and trade with. I use the Heiken Ashi candlesticks so with this I get three conformations in one. If you like it great. I am not a coder but I do know what works for my brain and thought I would share this, thanks to Chat GBT.
I use it for entry most of the time on the 5 minute chart New York open. I also like the Orb break and retest by Quant Crawler as my second indicator.

Dynamic Multi-Timeframe SMAs (Brian Shannon Style)Overview : This indicator implements the logic of Brian Shannon's "Multi-Timeframe Analysis" on intraday charts. It automatically calculates the correct length for the 5-Day and 50-Day Simple Moving Averages (SMA), regardless of the timeframe (e.g., 5m, 15m, 1h) you are viewing.
How it works Standard SMAs only count bars. A "50 SMA" on a 5-minute chart only looks back ~4 hours. This script dynamically calculates how many bars represent full trading days.
Features:
Asset Class Selector : Choose between Crypto (24/7) and Stocks (6.5h US Session) to ensure correct minute-per-day calculations.
Info Table : Displays exactly how many bars are being used for the calculation in real-time.


CS Trendline ProTitle: CS Trendline Pro
Description:
CS Trendline Pro is a comprehensive scalping and day-trading system designed to filter out noise and identify high-probability breakout setups. It combines the structural precision of Fractal Trendlines with a robust Dual-EMA Filter, visualized through an intuitive "Traffic Light" color system.
This tool is specifically engineered for traders who want to trade Trendline Breakouts but need a safety mechanism to avoid false signals (fakeouts) and counter-trend traps.
🚦 How the "Traffic Light" Logic Works
The core feature of this script is the dynamic coloring of the candles, which acts as a visual filter for your entries:
🟢 GREEN Zone (Safe Buy):
Condition: A Bullish Trendline Breakout has occurred AND the price is holding ABOVE the EMA 30 (Yellow Line).
Meaning: Momentum is bullish, and you are in a safe zone to look for Long entries.
🔴 RED Zone (Safe Sell):
Condition: A Bearish Trendline Breakout has occurred AND the price is holding BELOW the EMA 30 (Yellow Line).
Meaning: Momentum is bearish, and you are in a safe zone to look for Short entries.
⚪ GRAY Zone (No Trade / Wait):
Condition: A breakout occurred, but the price is on the "wrong side" of the EMA 30.
Meaning: Indecision. The market structure is conflicting with the immediate momentum. It is recommended to stay out until the color changes.
🛠️ Key Features
** automated Trendlines:** Automatically draws Support and Resistance dynamic trendlines based on pivot points (LuxAlgo engine).
Dual EMA Filter:
EMA 30 (Yellow): Acts as the immediate "Safe Zone" filter.
EMA 200 (White): Displays the macro trend. (Pro Tip: Only take Green signals if price is above the White line).
CS-BUY / CS-SELL Labels: Clear text markers appear exactly when a valid breakout occurs.
Customizable: Adjustable sensitivity (Length), EMA periods, and Slope calculation methods (ATR, Stdev, Linreg).
📉 How to Trade with CS Trendline Pro
For Scalping (5m / 15m):
Identify the Main Trend: Look at the White EMA (200).
If Price > EMA 200 → Focus on BUY signals.
If Price < EMA 200 → Focus on SELL signals.
Wait for the Signal:
Wait for the candle to turn Teal (Green) or Red.
Ensure the candle closes with the new color.
Risk Management:
Place Stop Loss below the recent swing low (for buys) or above the swing high (for sells).
Target a 1.5 Risk/Reward ratio or trail your stop using the EMA 30.
⚠️ Important Note on Backpainting
This indicator uses pivot points to draw trendlines. By nature, a pivot point can only be confirmed after a few bars have passed (Lag).
Backpaint Setting (Default ON): Keeps your historical chart clean by connecting the exact pivot points in the past.
Real-Time Behavior: In live trading, the trendline and signal will appear once the pivot is confirmed (based on your 'Length' setting). This is normal behavior for any trendline script.
Settings Recommended:
5-Minute Chart: Length 10 or 14.
15-Minute Chart: Length 14.
Enjoy trading with precision! ~ CS Trading

H1 Bias Rhythmic Lite Public V1.0 by SRTH1 Bias Rhythmic Lite Public V1.0 by SRT
Version: 1.0 (Public Lite)
Author: SRT
Platform: TradingView / Pine Script v6
Overlay: Yes (works directly on price chart)
Purpose: Provide H1 directional bias with D1 alignment and basic rhythm signals. Perfect for traders looking for clean bias visualization without clutter.
💡 Key Features
H1 Bias (Primary Engine)
Uses EMA7, EMA40, SMA150, and SMA200 for H1 directional bias.
Clearly identifies bullish, bearish, and neutral conditions.
Stack-based logic ensures consistency and reliability.
D1 Bias Alignment
Pulls higher timeframe (daily) EMA40, SMA150, SMA200.
Confirms H1 bias alignment with daily trend.
Helps filter trades in the direction of the larger trend.
Flush Detection
H1 flushes: Price fully “flushed” beyond EMA7 for bullish/bearish setups.
D+H1 flush: Aligns H1 flush with D1 bias for stronger context.
Visual dots with configurable sizes and colors indicate flush levels.
Price Action Signals
Engulfing (EB) detection with ATR filtering and body % thresholds.
Long Tail Body (LTB) detection with optional body % filter for precise swing points.
Both EB and LTB signals show clear labels above/below the candle for instant recognition.
ATR-Based Dynamic Offsets
Uses ATR (configurable length) to scale labels and flush dot offsets dynamically.
Ensures signals are proportionate to volatility.
Daily Pivot & Session Lines
Daily pivot plotted automatically.
Option to show daily session high-low lines and day labels.
Easily configurable label sizes and colors.
Bias Summary Table
Top-right table shows:
D1 bias
H1 bias
LTB allowed (Yes/No)
Color-coded for easy reference: green = Bull, red = Bear, gray = Neutral.
Alerts
H1 flush and D+H1 flush alerts.
LTB active alerts when bias is aligned.
Perfect for keeping an eye on actionable swings.
⚙️ User Inputs
Moving Average Lengths: EMA7, EMA40, SMA150, SMA200
Show/Hide MAs: Toggle to declutter the chart
ATR Settings: Length and % threshold for EB/LTB sizing
Signal Toggles: Show/Hide EBull, EBear, LTB Bull, LTB Bear, Flush Dots
Daily Pivot & Label Settings: Toggle visibility, label size, line/text colors
✅ Advantages for Users
Lightweight and fast — minimal lag on H1 charts.
Clear visualization of market bias and swing points.
Free access to core H1 Bias Rhythmic methodology.
Serves as a learning tool for traders who want to upgrade later.
⚠️ Limitations
No automatic entries, stops, or take profits (manual trade execution required).
Lite version only offers simplified signals and bias visualization.
Advanced rhythm and multi-timeframe alerts are reserved for the Premium version.
📢 Short Promo for Premium
For traders who want full power, check out H1 Bias Rhythmic Premium V1.0 by SRT — complete multi-phase alerts, advanced LTB & EB filters, EMA/SMA flip confirmations, and professional-level rhythm signals. Upgrade to premium for the full H1 trading experience.


Universe_Super MA [MTF & Multi-Type]**Overview**
"Universe_Super MA" is a comprehensive trend analysis tool designed to overcome indicator limits. Instead of adding 4 separate moving averages, this script allows you to monitor 4 distinct Moving Averages within a single indicator slot.
It features full **Multi-Timeframe (MTF)** capabilities, meaning you can view higher timeframe trends (e.g., Daily 200 SMA) while trading on lower timeframes (e.g., 15-minute chart).
**Default Configuration (Institutional Setup)**
The indicator comes pre-loaded with a powerful institutional trend setup:
1. **50 Period (Green):** Short-term trend and dynamic support.
2. **99 Period (Orange):** Medium-term trend filter.
3. **200 Period (Red):** The classic institutional dividing line between Bull and Bear markets.
4. **389 Period (Blue):** A long-term "Deep Trend" baseline used to identify major market cycles and heavy support/resistance levels.
**Key Features**
* **fully Customizable:** You can change the Length, Color, and Width of each line.
* **Multi-Timeframe (MTF):** Select any timeframe for any MA. (e.g., Keep MA1 on the "Chart" timeframe, but lock MA4 to the "Daily" timeframe).
* **6 MA Types:** Choose between SMA, EMA, WMA, HMA (Hull), RMA, and VWMA for each line independently.
* **Clean Interface:** Toggle any line On/Off via settings without removing the indicator.
**Usage & Interpretation**
* **Trend Identification:** The 200 (Red) and 389 (Blue) lines are designed to visualize the long-term market bias. In technical analysis, price action sustaining above these levels is generally considered a bullish context, while price below suggests a bearish context.
* **Crossover Monitoring:** The script facilitates the observation of interactions between short-term and long-term averages (e.g., the 50 crossing the 200), allowing users to easily spot common technical patterns like the "Golden Cross".
* **Dynamic Levels:** The 99 and 200-period lines act as dynamic levels that may align with technical support or resistance zones during market retracements.
**Settings**
* **Timeframe:** Leave empty to use the current chart's timeframe, or select a specific one (e.g., "1D" or "4H").
* **Type:** Select your preferred calculation method (SMA is default).
**Disclaimer**
This tool is for educational purposes and trend visualization only. Always manage your risk.

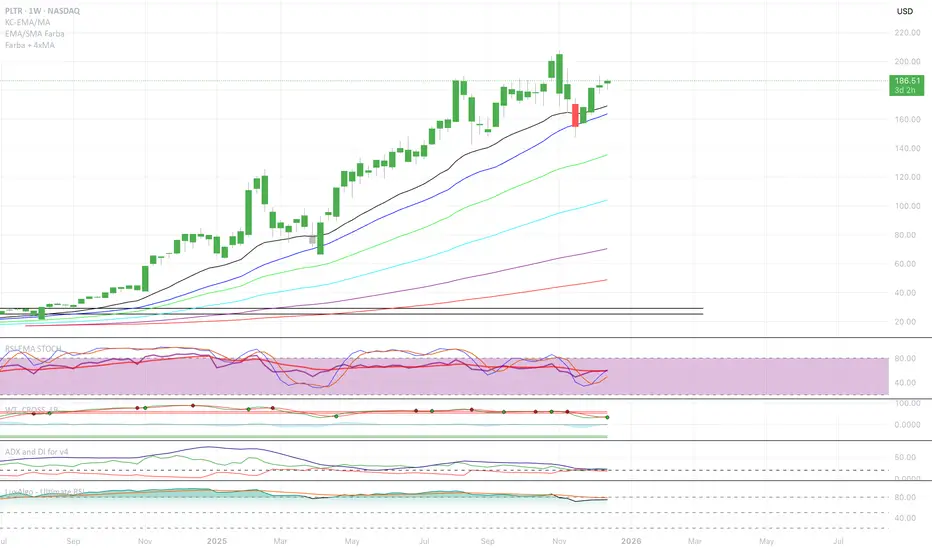
SMAHiLO- 2 EMA/SMA can be used for trend following default value is 50 and 200
- green box and red box incorporated to chart for visual representation for Week ,Daily, H4, H2,H1
- blue line representation for opening candle, previous low and previous high and by clicking prev. close open alert at setting it will alert if prev. low or high are reach and current opening candle is breakdown or breakout
settings:
- engulfing alert it will alert bullish engulfing entry if 50 is above 200 vise versa
- harami alert it will alert bullish harami if 50 is above 200 vise versa
- pullback alert it will alert bullish pullback if 50 is above 200 or bearish pullback if 50 below 200
- mcd ob/os alert it will display green circle above candle if macd getting weaker from bearish to bullish vise versa
- spot play alert most of the time buy alert only no sell alert.
- engul/harami alert it will alert if harami or engulfing is met unlike on engulfing alert and harami alert it will follow the trend if 50 above 200 vise versa.

Optimized 1st Touch 10SMA After RunThis indicator is designed to identify strong stocks that have recently made a meaningful rally and are now experiencing their first controlled pullback to the 10-day simple moving average (10SMA). It scans for stocks that have moved at least 10% over the past 10 trading days, maintained upward momentum by riding above the 10SMA during the advance, and are trading within a broader uptrend. The signal triggers only when price makes its first touch of the 10SMA since the rally and closes back above it, indicating potential support and trend continuation rather than weakness. Additional filters such as volume contraction and higher-timeframe trend alignment help isolate high-quality setups where strong stocks are digesting gains before a potential next leg higher.

EMA Slope Angle V2 Auto Threshold# EMA Slope Angle Indicator
## Overview
The EMA Slope Angle Indicator visualizes the Exponential Moving Average (EMA) slope as an angle in degrees, providing traders with a clear, quantitative measure of trend strength and direction. The indicator features **automatic threshold calculation based on Gaussian distribution**, making it adaptive to any market and timeframe.
## Key Features
### 🎯 **Automatic Threshold Calculation (NEW!)**
- **Gaussian Distribution-Based**: Automatically calculates optimal thresholds from the 50% interquartile range (IQR) of historical angle data
- **Asset-Adaptive**: Thresholds adjust to each instrument's unique volatility and price characteristics
- **No Manual Tuning Required**: Simply enable "Use Auto Thresholds" and let the indicator optimize itself
### 📊 **Dynamic EMA Coloring**
- **Color Intensity**: EMA line color intensity reflects slope strength
- **Visual Feedback**:
- Green shades for uptrends (darker = stronger)
- Red shades for downtrends (darker = stronger)
- Gray for flat/neutral conditions
### 📈 **Regime Detection**
- **Three Regimes**: RISING, FALLING, and FLAT
- **Smart Classification**: Based on statistical distribution of angles
- **Non-Repainting**: All calculations use confirmed bars only
### 🔔 **Trend-Shift Signals**
- **Visual Arrows**: Automatic signals when transitioning from FLAT to RISING/FALLING
- **Configurable**: Enable/disable signals as needed
- **Reliable**: Only triggers on significant regime changes
### 📋 **KPI Dashboard**
- **Real-Time Metrics**: Current angle, regime, and last signal
- **Auto-Threshold Display**: Shows calculated thresholds when auto-mode is active
- **Statistics**: Optional angle distribution statistics
- **Clean Layout**: Top-right corner, non-intrusive
### 📊 **Angle Statistics (Optional)**
- **Distribution Analysis**: Histogram of angle ranges
- **Dynamic Buckets**: Automatically adjusts to data distribution when auto-mode is enabled
- **Percentage Breakdown**: See how often each angle range occurs
## Settings
### Main Settings
- **EMA Length**: Period for the Exponential Moving Average (default: 50)
- **Slope Lookback Bars**: Number of bars to calculate slope over (default: 5)
### Angle Settings
- **Use Auto Thresholds**: Enable automatic threshold calculation (recommended!)
- **Analysis Period**: Number of bars to analyze for distribution (default: 500)
- **Manual Thresholds**: Flat, Rising, and Falling triggers (used when auto-mode is off)
- **Max Angle for Color Saturation**: Maximum angle for color intensity scaling
### Display Options
- **Colors**: Customize uptrend, downtrend, and flat colors
- **Show Signals**: Enable/disable trend-shift arrows
- **Show Statistics**: Display angle distribution table
- **Show Dashboard**: Toggle KPI dashboard visibility
## How It Works
### Angle Calculation
The indicator calculates the angle between the current EMA value and the EMA value N bars ago:
```
Angle = arctan((EMA_now - EMA_then) / lookback) × 180° / π
```
### Auto-Threshold Calculation
When enabled, the indicator:
1. Analyzes historical angle data over the specified period
2. Calculates mean and standard deviation
3. Determines thresholds based on the 50% interquartile range (IQR):
- **Flat Threshold**: ±0.674σ (middle 50% of data)
- **Rising Trigger**: 75th percentile (mean + 0.674σ)
- **Falling Trigger**: 25th percentile (mean - 0.674σ)
### Regime Classification
- **FLAT**: Angle within ±Flat Threshold
- **RISING**: Angle ≥ Rising Trigger
- **FALLING**: Angle ≤ Falling Trigger
## Use Cases
### Trend Following
- Identify strong trends (high angle values)
- Spot trend reversals (regime changes)
- Filter trades based on trend strength
### Range Trading
- Detect flat/consolidation periods
- Avoid trading during choppy markets
- Enter when regime shifts from FLAT to RISING/FALLING
### Multi-Timeframe Analysis
- Apply to different timeframes for confirmation
- Use higher timeframe for trend direction
- Use lower timeframe for entry timing
## Tips for Best Results
1. **Enable Auto-Thresholds**: Let the indicator adapt to your instrument
2. **Adjust Analysis Period**: Use more bars for stable markets, fewer for volatile ones
3. **Combine with Price Action**: Use regime changes as confirmation, not standalone signals
4. **Multi-Timeframe**: Check higher timeframes for trend context
5. **Backtest First**: Test settings on historical data before live trading
## Technical Details
- **Non-Repainting**: All calculations use `barstate.isconfirmed`
- **Pine Script v6**: Latest version for optimal performance
- **Efficient**: Minimal computational overhead
- **Customizable**: Extensive settings for fine-tuning
## Version History
**v2.0** (Current)
- Added automatic threshold calculation based on Gaussian distribution
- Dynamic bucket adjustment for statistics
- Enhanced dashboard with auto-threshold display
- Improved regime detection using IQR method
**v1.0**
- Initial release with manual thresholds
- Basic EMA coloring
- Trend-shift signals
- KPI dashboard
## Support
For questions, suggestions, or bug reports, please leave a comment or contact the author.
---
**Disclaimer**: This indicator is for educational purposes only. Past performance does not guarantee future results. Always use proper risk management and never risk more than you can afford to lose.
**Keywords**: EMA, slope, angle, trend, automatic thresholds, Gaussian distribution, regime detection, non-repainting, adaptive

SCOTTGO - RVOL Bull/Bear Painter (Real-Time) SCOTTGO - RVOL Bull/Bear Painter (Real-Time Momentum Detection)
📌Overview
The RVOL Bull/Bear Painter is a Pine Script indicator designed to instantly highlight high-momentum candles driven by significant Relative Volume (RVOL).
It provides a clear visual signal (bar color, shape, and label) when a candle's volume exceeds its average by a user-defined threshold, confirming strong bullish or bearish interest in real-time. This helps traders quickly identify potential institutional accumulation/distribution or breakout/breakdown attempts.
✨ Key Features
Relative Volume (RVOL) Calculation: Automatically calculates the ratio of the current bar's volume to its moving average (SMA or EMA) over a customizable lookback period.
Momentum Confirmation: Paints the candle green (bullish) or red (bearish) only when both price direction and high RVOL criteria are met.
Real-Time Detection: Uses a plotshape method to display the signal triangle as soon as the RVOL and direction conditions are met on the currently forming candle, aiming for faster alerts than bar-close coloring.
Customizable Threshold: Easily adjust the RVOL multiplier (e.g., 1.5x, 2.0x, 3.0x) to filter out noise and only focus on truly significant volume events.
Labels and Alerts: Displays a volume multiplier label (e.g., BULL 2.55x) and includes pre-configured alert conditions for automated notifications.
🛠️ How to Use It
1. Identify High-Conviction Moves
Look for the painted candles and the corresponding labels. A candle painted green with a BULL label (e.g., BULL 2.5x) indicates that buyers stepped in with 2.5 times the typical volume to drive the price higher.
2. Configure Your Sensitivity
The power of the script lies in customizing the inputs:
RVOL Lookback Period: Determines the length of the volume moving average.
Shorter periods (e.g., 9-20) make the indicator more reactive to recent volume changes.
Longer periods (e.g., 50-200) require a much larger volume spike to trigger a signal.
RVOL Threshold: This is the multiplier.
Lower values (e.g., 1.5) will generate more signals.
Higher values (e.g., 3.0) will generate fewer, but generally higher-conviction, signals.
3. Set Up Alerts
Use the pre-configured alert conditions (Bullish RVOL Signal and Bearish RVOL Signal) in TradingView's alert menu. Crucially, set the alert frequency to "Once per bar" or "Once per minute" to receive notifications as soon as the high RVOL event occurs, without waiting for the bar to close.

Danny Gee EMA Trend RibbonDanny Gee EMA Trend Ribbon - Multi-Timeframe Trend Analysis
A sophisticated 9-EMA ribbon system designed to visualize trend strength and direction with precision. This indicator creates a dynamic color-coded ribbon that adapts to market conditions, making trend identification effortless.
Key Features:
9 Customizable EMAs - Default periods: 8, 14, 20, 26, 32, 38, 44, 50, and 60
Intelligent Ribbon Coloring - Automatically displays bullish (green), bearish (red), or neutral (gray) based on EMA consensus
Smoothing Control - Adjustable smoothing period (default 2) reduces noise and false signals
Real-Time Trend Status - Live dashboard showing current trend state and EMA agreement count (e.g., "Bullish 8/9")
Visual Clarity - Color-coded EMA lines with the 60 EMA highlighted for key support/resistance
How It Works:
The indicator analyzes the slope direction of all 9 EMAs. When 7 or more EMAs agree on direction, the ribbon displays a clear bullish or bearish color. This consensus-based approach helps filter out weak or conflicting trends, keeping you focused on high-probability setups.
Best Used For:
✓ Identifying strong trending conditions
✓ Avoiding choppy, sideways markets
✓ Confirming trade direction with other indicators
✓ Multi-timeframe analysis (works on any chart timeframe)
Customization Options:
Adjust all EMA periods to match your trading style
Customize ribbon colors for personal preference
Toggle ribbon visibility on/off
Modify smoothing sensitivity
Perfect for swing traders, scalpers, and day traders looking for a clean, reliable trend filter that works across all markets - forex, crypto, stocks, and indices.

Price Crossing 144 EMA Alert (No Visuals)Price Crossing 144 EMA Alert (No VisuPrice Crossing 144 EMA Alert (No Visuals)Price Crossing 144 EMA Alert (No Visuals)Price Crossing 144 EMA Alert (No Visuals)Price Crossing 144 EMA Alert (No Visuals)als)

Trend Prediction Meter [PointAlgo]The Trend Prediction Meter & Levels is a composite market-bias and volatility visualization tool designed to summarize trend strength, momentum, price positioning, and volatility into a single normalized score.
It provides a structured framework to interpret directional bias and probable price expansion zones during active market conditions.
Concept Overview
Markets often reflect multiple conditions simultaneously—trend direction, momentum strength, price location within a range, and volatility.
This indicator combines these elements into a unified Bullish Score (0–100), displayed as a meter and supported by projected ATR-based levels.
Rather than focusing on a single signal, the script aims to present context about current market conditions.
Bullish Score Composition (0–100)
The meter represents a weighted blend of multiple market factors:
1. Trend Strength (EMA Structure)
Uses a fast and slow EMA to assess directional bias.
The distance between EMAs is normalized into a trend strength score.
Strong separation indicates directional conviction; compression suggests balance.
2. Momentum Strength (RSI Blend)
Combines a short-term and mid-term RSI.
Helps capture both immediate momentum and broader directional stability.
Higher readings indicate sustained bullish pressure, lower readings indicate bearish pressure.
3. Position Within Recent Range
Measures where price is trading relative to its recent high–low range.
Values near the top of the range reflect strength; values near the bottom reflect weakness.
Mid-range positioning indicates equilibrium.
4. Volume Participation
Compares current volume against its recent average.
Acts as a minor confidence modifier rather than a primary driver.
Each component is normalized and combined using fixed weights to produce a final Bullish Score between 0 and 100.
Bias Classification
The Bullish Score is translated into descriptive market states:
Extreme Bullish
Very Bullish
Bullish
Neutral
Bearish
Very Bearish
These labels describe current bias, not future certainty.
Meter Visualization
The meter plot dynamically changes color based on the score range.
A dashed midline at 50 represents balance.
Background shading highlights strong bullish or bearish dominance zones.
Crossovers of the 50-level indicate shifts in directional control.
ATR-Based Projection Levels:
To provide volatility context, the indicator calculates ATR-based upside and downside reference levels:
Two potential expansion levels (TP1 and TP2) are projected above and below price.
The distance of these levels adapts based on current bias strength.
These levels are contextual reference zones, not fixed targets.
Prediction Dashboard
An optional side table summarizes key readings at the most recent bar:
Symbol
Current bias label
Bullish Score
Current price
ATR value
Upside and downside projection levels
Directional comment (Upside favoured / Downside favoured / Balanced)
This dashboard is designed to provide a quick structural overview without requiring manual calculation.
Signals & Alerts
Built-in alerts are available for:
Bullish bias conditions
Bearish bias conditions
Bullish Score crossing above 50
Bullish Score crossing below 50
Alerts are informational and reflect internal state changes only.
Customization:
Users can adjust:
RSI lengths
EMA lengths
Range lookback period
ATR parameters
Display options for the meter and dashboard
This allows adaptation across different instruments and timeframes.
Usage Notes
Best suited for analytical interpretation rather than standalone decision-making.
Designed to complement price action, structure, or other indicators.
Works across multiple markets where volume and volatility data are available.
Disclaimer :
This indicator is intended for educational and analytical purposes only.
It does not provide investment, trading, or financial advice.
All signals and levels should be validated with independent analysis and appropriate risk management.

Relative Strength Index_YJ//@version=5
indicator(title="MACD_YJ", shorttitle="MACD_YJ",format=format.price, precision=2)
source = close
useCurrentRes = input.bool(true, title="Use Current Chart Resolution?")
resCustom = input.timeframe("60", title="Use Different Timeframe? Uncheck Box Above")
smd = input.bool(true, title="Show MacD & Signal Line? Also Turn Off Dots Below")
sd = input.bool(false, title="Show Dots When MacD Crosses Signal Line?")
sh = input.bool(true, title="Show Histogram?")
macd_colorChange = input.bool(true, title="Change MacD Line Color-Signal Line Cross?")
hist_colorChange = input.bool(true, title="MacD Histogram 4 Colors?")
// === Divergence inputs ===
grpDiv = "Divergence"
calculateDivergence = input.bool(true, title="Calculate Divergence", group=grpDiv, tooltip="피벗 기반 정/역배 다이버전스 탐지 및 알람 사용")
lookbackRight = input.int(5, "Lookback Right", group=grpDiv, minval=1)
lookbackLeft = input.int(5, "Lookback Left", group=grpDiv, minval=1)
rangeUpper = input.int(60, "Bars Range Upper", group=grpDiv, minval=1)
rangeLower = input.int(5, "Bars Range Lower", group=grpDiv, minval=1)
bullColor = input.color(color.new(#4CAF50, 0), "Bull Color", group=grpDiv)
bearColor = input.color(color.new(#F23645, 0), "Bear Color", group=grpDiv)
textColor = color.white
noneColor = color.new(color.white, 100)
res = useCurrentRes ? timeframe.period : resCustom
fastLength = input.int(12, minval=1)
slowLength = input.int(26, minval=1)
signalLength= input.int(9, minval=1)
fastMA = ta.ema(source, fastLength)
slowMA = ta.ema(source, slowLength)
macd = fastMA - slowMA
signal = ta.sma(macd, signalLength)
hist = macd - signal
outMacD = request.security(syminfo.tickerid, res, macd)
outSignal = request.security(syminfo.tickerid, res, signal)
outHist = request.security(syminfo.tickerid, res, hist)
// 가격도 같은 res로
hi_res = request.security(syminfo.tickerid, res, high)
lo_res = request.security(syminfo.tickerid, res, low)
// ── Histogram 색
histA_IsUp = outHist > outHist and outHist > 0
histA_IsDown = outHist < outHist and outHist > 0
histB_IsDown = outHist < outHist and outHist <= 0
histB_IsUp = outHist > outHist and outHist <= 0
macd_IsAbove = outMacD >= outSignal
plot_color = hist_colorChange ? (histA_IsUp ? color.new(#00FF00, 0) :
histA_IsDown ? color.new(#006900, 0) :
histB_IsDown ? color.new(#FF0000, 0) :
histB_IsUp ? color.new(#670000, 0) : color.yellow) : color.gray
macd_color = macd_colorChange ? color.new(#00ffff, 0) : color.new(#00ffff, 0)
signal_color = color.rgb(240, 232, 166)
circleYPosition = outSignal
// 골든/데드 크로스 (경고 해결: 먼저 계산)
isBullCross = ta.crossover(outMacD, outSignal)
isBearCross = ta.crossunder(outMacD, outSignal)
cross_color = isBullCross ? color.new(#00FF00, 0) : isBearCross ? color.new(#FF0000, 0) : na
// ── 플롯
plot(sh and outHist ? outHist : na, title="Histogram", color=plot_color, style=plot.style_histogram, linewidth=5)
plot(smd and outMacD ? outMacD : na, title="MACD", color=macd_color, linewidth=1)
plot(smd and outSignal? outSignal: na, title="Signal Line", color=signal_color, style=plot.style_line, linewidth=1)
plot(sd and (isBullCross or isBearCross) ? circleYPosition : na,
title="Cross", style=plot.style_circles, linewidth=3, color=cross_color)
hline(0, "0 Line", linestyle=hline.style_dotted, color=color.white)
// =====================
// Divergence (정배/역배) - 피벗 비교
// =====================
_inRange(cond) =>
bars = ta.barssince(cond)
rangeLower <= bars and bars <= rangeUpper
plFound = false
phFound = false
bullCond = false
bearCond = false
macdLBR = outMacD
if calculateDivergence
// 정배: 가격 LL, MACD HL
plFound := not na(ta.pivotlow(outMacD, lookbackLeft, lookbackRight))
macdHL = macdLBR > ta.valuewhen(plFound, macdLBR, 1) and _inRange(plFound )
lowLBR = lo_res
priceLL = lowLBR < ta.valuewhen(plFound, lowLBR, 1)
bullCond := priceLL and macdHL and plFound
// 역배: 가격 HH, MACD LH
phFound := not na(ta.pivothigh(outMacD, lookbackLeft, lookbackRight))
macdLH = macdLBR < ta.valuewhen(phFound, macdLBR, 1) and _inRange(phFound )
highLBR = hi_res
priceHH = highLBR > ta.valuewhen(phFound, highLBR, 1)
bearCond := priceHH and macdLH and phFound
// 시각화 (editable 파라미터 삭제)
plot(plFound ? macdLBR : na, offset=-lookbackRight, title="Regular Bullish (MACD)",
linewidth=2, color=(bullCond ? bullColor : noneColor), display=display.pane)
plotshape(bullCond ? macdLBR : na, offset=-lookbackRight, title="Bullish Label",
text=" Bull ", style=shape.labelup, location=location.absolute, color=bullColor, textcolor=textColor, display=display.pane)
plot(phFound ? macdLBR : na, offset=-lookbackRight, title="Regular Bearish (MACD)",
linewidth=2, color=(bearCond ? bearColor : noneColor), display=display.pane)
plotshape(bearCond ? macdLBR : na, offset=-lookbackRight, title="Bearish Label",
text=" Bear ", style=shape.labeldown, location=location.absolute, color=bearColor, textcolor=textColor, display=display.pane)
// 알람
alertcondition(bullCond, title="MACD Regular Bullish Divergence",
message="MACD 정배 다이버전스 발견: 현재 봉에서 lookbackRight 만큼 좌측.")
alertcondition(bearCond, title="MACD Regular Bearish Divergence",
message="MACD 역배 다이버전스 발견: 현재 봉에서 lookbackRight 만큼 좌측.")

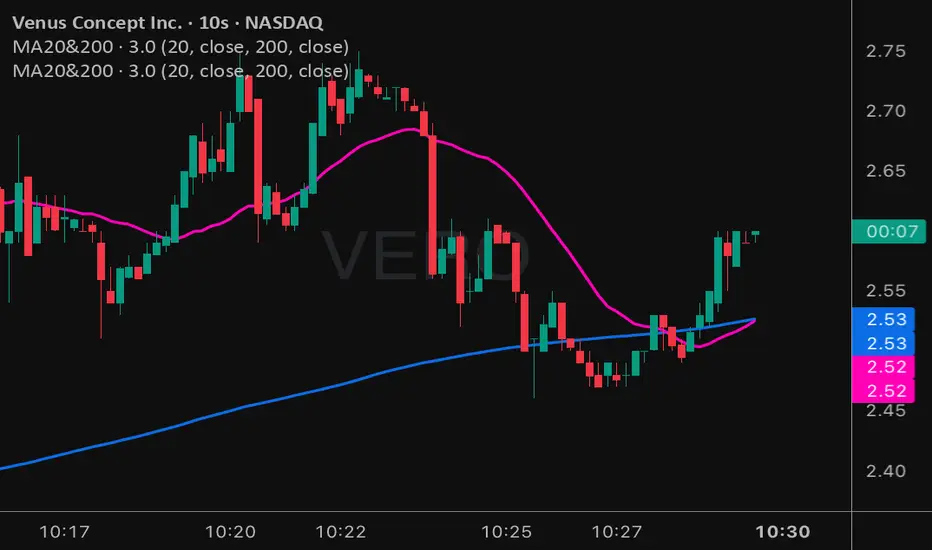
Moving Averages 20 & 200Moving Averages 20&200. Help you decide buy signal to find bullish or bearish.
Rainbow MA Width█ OVERVIEW
Rainbow MA Width is a companion indicator for Rainbow MA Cloud. It displays ribbon width as a normalized Z-Score, allowing traders to visualize trend momentum expansion and contraction relative to recent history.
█ CONCEPTS
Z-Score Normalization:
Rather than displaying raw width values (which vary by asset and timeframe),
this indicator normalizes the ribbon width using Z-Score calculation:
Z-Score = (Current Width - Average Width) / Standard Deviation
Z-Score Interpretation:
• 0 = Average width (mean)
• +1 to +2 = Expanding (above average, strong trend)
• -1 to -2 = Contracting (below average, weakening trend)
• Beyond ±2 = Extreme (statistical outlier, potential reversal)
Width Calculation Modes:
• Outer — Distance between fastest and slowest MA: |MA1 - MA8|
• Average Gap — Mean of all adjacent MA gaps
• Total Gap — Sum of all adjacent MA gaps
█ FEATURES
1 — Width Mode Selection
Three methods to calculate ribbon width.
"Outer" recommended for aligned trends.
2 — Z-Score Period
Configurable lookback for mean and standard deviation.
Default 20 bars; increase for smoother, less reactive readings.
3 — Zone Fill Coloring
Cyan fill when expanding (Z > 0).
Orange fill when contracting (Z < 0).
Yellow fill for extreme values (|Z| > 2) as warning.
4 — Alignment Background
Green background during bullish alignment.
Red background during bearish alignment.
Synced with Rainbow MA Cloud for consistency.
5 — Reference Lines
Horizontal lines at 0 (mean), ±1σ, and ±2σ levels.
Provides clear visual boundaries for interpretation.
6 — Raw Width Display
Optional secondary line showing original width percentage.
Useful for comparing normalized vs absolute values.
█ HOW TO USE
Trend Confirmation:
• Z-Score rising above 0 confirms trend acceleration
• Z-Score staying above +1 indicates sustained strong momentum
• Use alongside alignment background for confluence
Reversal Warning:
• Z-Score exceeding +2 suggests overextension (yellow warning zone)
• Z-Score dropping below -2 indicates extreme contraction
• Extreme readings often precede trend reversals or consolidation
Entry Timing:
• Enter trends when Z-Score crosses above 0 (expansion beginning)
• Avoid entries when Z-Score is at extreme highs (potential exhaustion)
• Consider exits when Z-Score peaks and begins declining
█ LIMITATIONS
• Z-Score is relative to lookback period; different periods give different readings
• Extreme zones (±2) are statistical guides, not guarantees
• Best used in conjunction with Rainbow MA Cloud for full context
█ ALERTS
Four built-in alert conditions:
• Z-Score crosses above/below zero
• Z-Score enters extreme high/low zones (±2)

Rainbow MA Cloud█ OVERVIEW
Rainbow MA Cloud displays 8 Moving Averages as a gradient-colored cloud to visualize trend direction and strength. The "rainbow" effect shows momentum through ribbon width, while perfect MA alignment signals strong trending conditions.
█ CONCEPTS
The indicator uses 8 MAs with Fibonacci-based default lengths (8, 13, 21, 34, 55, 89, 144, 233) to create a layered view of price momentum across multiple timeframes.
Perfect Alignment Detection:
• Bullish Alignment — All 8 MAs in ascending order (MA1 > MA2 > ... > MA8)
Indicates strong uptrend with momentum across all timeframes
• Bearish Alignment — All 8 MAs in descending order (MA1 < MA2 < ... < MA8)
Indicates strong downtrend with aligned selling pressure
• Mixed — MAs are not in sequential order, suggesting consolidation or transition
Ribbon Width:
• Widening ribbon = Trend acceleration, increasing momentum
• Narrowing ribbon = Trend weakening, potential reversal or consolidation
█ FEATURES
1 — MA Configuration
Choose from EMA, SMA, WMA, VWMA, or HMA calculation methods.
All 8 MA lengths are fully customizable.
2 — Color Themes
Five built-in themes: Rainbow, Warm, Cool, Neon, Mono.
Creates visually distinct gradient from fast to slow MAs.
3 — Alignment Background
Green background during bullish alignment.
Red background during bearish alignment.
Helps quickly identify strong trending periods.
4 — Trend Signals
Labels appear when perfect alignment forms.
"BULL ALIGN" for bullish, "BEAR ALIGN" for bearish.
5 — Information Panel
Real-time display of alignment status, trend strength percentage,
ribbon width, price position relative to cloud, and MA values.
█ HOW TO USE
Entry Signals:
• Look for alignment signals (BULL/BEAR ALIGN) as trend confirmation
• Enter long when bullish alignment forms with price above cloud
• Enter short when bearish alignment forms with price below cloud
Trend Following:
• Stay in position while alignment background color persists
• Widening ribbon confirms trend continuation
• Exit or reduce when alignment breaks (background disappears)
Support/Resistance:
• Cloud edges act as dynamic support (bullish) or resistance (bearish)
• Price entering cloud suggests consolidation or potential reversal
█ LIMITATIONS
• Alignment signals are lagging by nature (based on MA crossovers)
• Works best on trending markets; generates mixed signals during ranging periods
• Ribbon width measurement uses outer MAs only (MA1 vs MA8)
█ COMPANION INDICATOR
Use "Rainbow MA Width" indicator for detailed Z-Score analysis of ribbon expansion/contraction patterns.
