HydraBot v1.2 publicenglish description english description english description english description english description english description english description english description english description
אינדיקטורים ואסטרטגיות

Sustained 200 SMA Cross (Locked to Daily)For individuals looking to track trend changes against the 200 day simple moving average. We are measuring 5 consecutive days changing from the above or below the 200 day SMA as a flag for a potential shift in trend.

SigmaFlowSigmaFlow is a professional signal management connector designed to work with the SigmaFlow app. This indicator allows traders to structure trade setups (Entry, Stop Loss, TP1, TP2) on TradingView and send them into the SigmaFlow platform, where signals are managed, tracked, and delivered to Telegram.
Professional signal management — from TradingView to Telegram.
How SigmaFlow Works:
Sends trade data from TradingView to Telegram via the SigmaFlow platform.
SigmaFlow handles signal management, organization, history tracking, performance metrics, and Telegram delivery.
What It Does NOT Do:
Does not generate trading signals
Does not provide investment advice
Does not execute trades
Requirements:
TradingView plan with webhook alerts*
Active SigmaFlow account*
Disclaimer
SigmaFlow is a signal management and delivery tool only. All trade ideas are created manually by users. Trading involves risk and past performance does not guarantee future results.

Liquidity Vacuum DetectorThis indicator identifies liquidity vacuum zones—price areas where the market previously moved quickly with little resistance. These zones often allow price to travel faster once re-entered, which is favorable for intraday options trading.
Vacuum zones are created during strong, clean impulse moves (large range, low overlap, thin participation). When price later enters a stored vacuum zone with volume expansion, the indicator prints a directional triangle to highlight a potential high-speed move.
Optional filters include VWAP directional bias and regular trading hours (RTH).
Designed as a trade filter and acceleration tool, not a predictive signal.
Best used in combination with key levels (PMH/PML, ORH/ORL, VWAP) and volume confirmation.

Session HeatmapIntraday Seasonality
Overview
Analyzes historical patterns by time of day. Identifies when volatility, volume, and open interest changes tend to be highest or lowest.
Features
Multiple Metrics: TR (volatility), Volume, and Open Interest changes
Flexible Grouping: View patterns by weekday or month to spot day-of-week or seasonal effects
Heatmap Visualization: Blue (low) to Red (high) color scale for quick pattern recognition
Percentile Mode: Reduces outlier impact by using 5th-95th percentile range
Timezone Support: Display in UTC alongside your local time
Metrics Explained
TR: Volatility - when markets move most
Volume: Liquidity - when participation is highest
OI Increase: When new positions are opened
OI Decrease: When positions are closed
OI Net: Net open interest change
Usage
Set your timezone and preferred slot size (30min/1H)
Choose a date range (relative or custom)
Select a metric to analyze
Use "Group By" to see weekday or monthly patterns
Switch to Percentile color scale if outliers dominate
Notes
Chart timeframe should be equal to or smaller than Slot Size
OI metrics require Binance Perpetual symbols
DST is not automatically adjusted; consider seasonal shifts for US/EU sessions

Momentum Burst Pullback System v66* Detects **momentum “bursts”** using:
* **Keltner breakout** (high above upper band for long, low below lower band for short), and/or
* **MACD histogram extreme** (highest/lowest in a lookback window, with correct sign).
* Optional **burst-zone extension** keeps the burst “active” for N extra bars after the burst.
* Marks bursts with **K** (Keltner) and **M** (MACD) labels:
* Core burst labels use one color, extension labels use a different color.
* Tracks the most recent burst as the **dominant side** (long or short), and stores burst “leg” anchors (high/low context).
* Adds **structure-based invalidation**:
* On a new **core burst**, it locks the most recent **confirmed swing** level (pivot):
* Long: locks the last confirmed **swing low**.
* Short: locks the last confirmed **swing high**.
* After the burst, if price **breaks that locked level**, the burst regime is **cancelled** (and any pending setup on that side is dropped).
* Finds **pullback setups** after a dominant burst (and not inside the active burst zone), within min/max bars:
* Long pullback requires a sequence of **lower highs** and price still below the burst high.
* Short pullback requires **higher lows** and price still above the burst low.
* Optional background shading highlights pullback bars.
* On pullback bars, plots **static TP/SL crosses** using ATR:
* Anchor is the pullback bar’s high (long) or low (short).
* TP/SL are ± ATR * multiple.
* TP plots are visually classified (bright vs faded) based on whether TP would exceed the prior burst extreme.
* Maintains a **state-machine entry + trailing stop**:
* Sets a “waiting” trigger on pullback.
* Enters when price breaks the trigger (high break for long, low break for short).
* Trails a stop using **R-multiples**, with different behavior pre-break-even, post-break-even, and near-TP.
* Optionally draws the trailing stop as horizontal line segments.
* Optionally shows a **last-bar label** with the most recent pullback’s TP and SL values.

BTC - Bitcoin Strategic Dashboard by RM Title: BTC - Bitcoin Strategic Dashboard | RM
Overview & Philosophy
The Bitcoin Strategic Dashboard is a comprehensive analytics tool designed to provide deeper market context beyond simple price action.
While a standard chart displays price history, this dashboard focuses on the structural health of the market. It aims to answer clearer questions: Is the asset statistically overextended? Is the current volatility compressed or expanding? How is Bitcoin currently correlating with traditional equity markets?
This script aggregates key data points—Performance, Risk, Valuation, and Macro Correlations—into a single, organized table. It is designed to be a quiet, high-density reference tool that sits unobtrusively in the corner of your screen, helping to contextualize daily price movements without cluttering your workspace.
Methodology & Module Breakdown
The dashboard is divided into 5 strategic modules. Here is exactly how to read them, how they are calculated, and how to interpret the data.
1. PERFORMANCE
This section answers: "Is Bitcoin actually beating the traditional market, and by how much?"
BTC Return : The raw percentage growth of Bitcoin.
Timeframes: 1-Year (Tactical Trend) and 4-Year (The Halving Cycle).
Alpha (vs SPX / Gold):
Meaning : "Alpha" measures true outperformance. It tells you how much better your capital worked in Bitcoin compared to the S&P 500 (Stocks) or Gold.
Calculation : We use a Relative Growth Ratio. Instead of simple subtraction, we calculate the growth factor of BTC divided by the growth factor of the Benchmark.
Interpretation :
Green: Bitcoin is outperforming. It is the superior vehicle for capital.
Red: Bitcoin is underperforming traditional assets (Opportunity Cost is high).
2. RISK PROFILE
This section answers: "How dangerous is the market right now?"
Drawdown (DD):
Meaning : The percentage loss from the 1-Year High.
Interpretation : Deep Drawdowns (e.g., > -50%) historically signal generational buying opportunities (Deep Red). Small Drawdowns (< -5%) signal we are near "Discovery Mode" (Blue/Green).
Sharpe Ratio:
Meaning : The industry standard for "Risk-Adjusted Return." It asks: "Is the profit worth the stress?"
Timeframe : Annualized over 365 Days.
Interpretation :
> 1.0: Good. The return justifies the risk.
> 2.0: Excellent. (Dark Green).
< 0.0: Bad. You are taking risk for negative returns.
Sortino Ratio:
Meaning : Similar to Sharpe, but it only counts downside volatility as "risk." Bitcoin often rallies aggressively (Good Volatility); Sortino ignores the upside "risk" and focuses only on minimizing losses.
Volatility (Vol) & Rank:
Meaning : How violently the price is moving.
Calculation : We compare the current 30-Day Volatility against the last 4 Years of volatility history (Rank 0-100).
Interpretation (The Squeeze Strategy) :
BLUE (Cold / <25%): Volatility is historically low. The market is "compressed." Big moves often follow these periods.
RED (Hot / >75%): Volatility is extreme. High risk of mean reversion or panic.
3. VALUATION & MOMENTUM
This section answers: "Is Bitcoin cheap or expensive?"
Mayer Multiple (MM):
Meaning: A "Godfather" of Bitcoin ratios.
Calculation : Current Price divided by the 200-Day Moving Average.
Interpretation :
< 0.8 (Blue): Historically "Cheap."
1.0: Fair Value (Price = Trend).
> 2.4 (Red): Speculative Bubble territory.
RSI (Relative Strength Index):
Timeframe : 14 Days.
Interpretation : >70 suggests the market is overheated (Red). <30 suggests oversold conditions (Blue).
Trend (ADX) :
Meaning : The Average Directional Index measures the strength of a trend, not the direction.
Interpretation : Values >25 (Green) indicate a strong trend is present. Values <20 (Gray) indicate a choppy/sideways market (no trend).
vs 200W (Macro):
Meaning : The distance to the 200-Week Moving Average.
Interpretation : This line is historically the "Cycle Bottom" or "Absolute Support" for Bitcoin. Being close to it (or below it) is rare and often marks cycle lows.
4. MACRO CORRELATIONS
This section answers: "Is Bitcoin moving on its own, or just following the Stock Market?"
vs TradFi (SPX):
Timeframe : 90-Day Correlation Coefficient.
Interpretation :
High Positive (Red): BTC is just acting like a tech stock. No "Safe Haven" status.
Negative/Zero (Green): BTC is "decoupled." It is moving independently of Wall Street.
vs DXY (US Dollar):
Interpretation : Bitcoin usually moves inverse to the Dollar.
Negative (Green): Normal healthy behavior.
Positive (Red): Warning signal. If both DXY and BTC rise, something is breaking in the system.
5. HISTORICAL LEDGER
A Year-by-Year breakdown of returns.
Feature : You can toggle the comparison column in the settings to compare Bitcoin against either S&P 500 or Gold.
Usage : Helps visualize the cyclical nature of returns (e.g., the 4-year cycle pattern of Green-Green-Green-Red).
How to Read the Visuals (Heatmap)
The dashboard uses a standardized Bloomberg-style heatmap to let you assess the market state in milliseconds:
🟢 Green: Profit / Good Performance / Positive Alpha.
🔴 Red: Loss / Overheating / High Risk.
🔵 Blue: "Cold" / Cheap / Low Volatility (Potential Buy Zones).
🟠 Orange: Warning / High Drawdown.
⚫ Gray/Black: Neutral or Fair Value.
Settings & Customization
Visuals: Change the text size (Tiny, Small, Normal) to fit your screen resolution.
Modules: You can toggle individual sections on/off to save screen space.
Calculation: Switch the Historical Benchmark between "S&P 500" and "Gold" depending on your thesis.
Disclaimer
This script is for research and educational purposes only. The metrics provided (Sharpe, Sortino, Mayer Multiple) are derived from historical data and do not guarantee future performance. "Cheap" (Low Mayer Multiple) does not mean the price cannot go lower. Always manage your own risk.
Tags
bitcoin, btc, bloomberg, terminal, dashboard, onchain, mayer multiple, sharpe ratio, volatility, alpha, risk management, Rob Maths

Rainbow MA Cloud█ OVERVIEW
Rainbow MA Cloud displays 8 Moving Averages as a gradient-colored cloud to visualize trend direction and strength. The "rainbow" effect shows momentum through ribbon width, while perfect MA alignment signals strong trending conditions.
█ CONCEPTS
The indicator uses 8 MAs with Fibonacci-based default lengths (8, 13, 21, 34, 55, 89, 144, 233) to create a layered view of price momentum across multiple timeframes.
Perfect Alignment Detection:
• Bullish Alignment — All 8 MAs in ascending order (MA1 > MA2 > ... > MA8)
Indicates strong uptrend with momentum across all timeframes
• Bearish Alignment — All 8 MAs in descending order (MA1 < MA2 < ... < MA8)
Indicates strong downtrend with aligned selling pressure
• Mixed — MAs are not in sequential order, suggesting consolidation or transition
Ribbon Width:
• Widening ribbon = Trend acceleration, increasing momentum
• Narrowing ribbon = Trend weakening, potential reversal or consolidation
█ FEATURES
1 — MA Configuration
Choose from EMA, SMA, WMA, VWMA, or HMA calculation methods.
All 8 MA lengths are fully customizable.
2 — Color Themes
Five built-in themes: Rainbow, Warm, Cool, Neon, Mono.
Creates visually distinct gradient from fast to slow MAs.
3 — Alignment Background
Green background during bullish alignment.
Red background during bearish alignment.
Helps quickly identify strong trending periods.
4 — Trend Signals
Labels appear when perfect alignment forms.
"BULL ALIGN" for bullish, "BEAR ALIGN" for bearish.
5 — Information Panel
Real-time display of alignment status, trend strength percentage,
ribbon width, price position relative to cloud, and MA values.
█ HOW TO USE
Entry Signals:
• Look for alignment signals (BULL/BEAR ALIGN) as trend confirmation
• Enter long when bullish alignment forms with price above cloud
• Enter short when bearish alignment forms with price below cloud
Trend Following:
• Stay in position while alignment background color persists
• Widening ribbon confirms trend continuation
• Exit or reduce when alignment breaks (background disappears)
Support/Resistance:
• Cloud edges act as dynamic support (bullish) or resistance (bearish)
• Price entering cloud suggests consolidation or potential reversal
█ LIMITATIONS
• Alignment signals are lagging by nature (based on MA crossovers)
• Works best on trending markets; generates mixed signals during ranging periods
• Ribbon width measurement uses outer MAs only (MA1 vs MA8)
█ COMPANION INDICATOR
Use "Rainbow MA Width" indicator for detailed Z-Score analysis of ribbon expansion/contraction patterns.

Expectativa de Juros (Fed)An indicator that measures future expectations for US interest rates, measured by the difference between the Fed's interest rate and pricing on the CME.

MA20 ATR Trend Failure FilterA volatility-adaptive filter designed to identify early trend invalidation.
This indicator combines a 20-period Moving Average (MA20) with Average True Range (ATR) to dynamically define a lower volatility boundary.
When price closes below this boundary, it signals that the current trend is no longer valid and risk is increasing.
Core Concept(核心思想)
MA defines the trend baseline
ATR measures current market volatility
MA − k × ATR forms a dynamic risk threshold
A close below this threshold = trend failure
👉 中文补充:
这不是反转指标,而是趋势失效过滤器,用于避免在趋势已经被破坏后继续持仓或加仓。
How It Works
Calculate MA20 as the trend reference
Calculate ATR(14) as volatility proxy
Build adaptive bands:
Upper Band = MA20 + k × ATR
Lower Band = MA20 − k × ATR
If close < Lower Band, trend is considered failed
The ATR multiplier k automatically adjusts the tolerance based on volatility, avoiding rigid fixed-percentage rules.
Visual Elements
Yellow line: MA20
Green band: MA20 + k × ATR
Red band: MA20 − k × ATR (key risk boundary)
Red triangle + “FAIL” label: Trend failure signal
Optional background shading to highlight risk zones
Typical Use Cases
Trend-following strategies (exit / reduce exposure)
Breakout strategies (filter false continuation)
Risk management overlay (non-intrusive, no repaint)
Combine with HMA, SuperTrend, structure-based entries
👉 中文补充:
非常适合作为**“不该再拿”的客观判断条件**,而不是频繁交易信号。
Why This Indicator
Volatility-adaptive (ATR-based)
No future data, no repaint
Simple logic, strong risk control
Works across stocks, crypto, futures, indices
This tool is designed to answer one question only:
Is the current trend still valid?
Parameters
MA Length (default: 20)
ATR Length (default: 14)
ATR Multiplier k (default: 0.8)
Lower k → stricter risk control
Higher k → more tolerance, fewer false signals SSE:600595

BTC - ALSI: Altcoin Season Index (Dynamic Eras)Title: BTC - ALSI: Altcoin Season Index (Dynamic Eras)
Overview & Philosophy
The Altcoin Season Index (ALSI) is a quantitative tool designed to answer the most critical question in crypto capital rotation: "Is it time to hold Bitcoin, or is it time to take risks on Altcoins?"
Most "Altseason" indicators suffer from Survivor Bias or Obsolescence. They either track a static list of coins that includes "dead" assets from previous cycles (ghosts of 2017), or they break completely when major tokens collapse (like LUNA or FTT).
This indicator solves this by using a Time-Varying Basket. The indicator automatically adjusts its reference list of Top 20 coins based on historical eras. This ensures the index tracks the winners of the moment—capturing the DeFi summer of 2020, the NFT craze of 2021, and the AI/Meme narratives of 2024/2025.
Methodology
The indicator calculates the percentage of the Top 20 Altcoins that are outperforming Bitcoin over a rolling window (Default: 90 Days).
The "Win" Count: For every major Altcoin performing better than BTC, the index adds a point.
Dynamic Eras: The basket of coins changes depending on the date:
2020 Era (DeFi Summer): Tracks the "Blue Chips" of the DeFi revolution like UNI, LINK, DOT, and early movers like VET and FIL.
2021 Era (Layer 1 Wars): Tracks the explosion of alternative smart contract platforms, adding winners like SOL, AVAX, MATIC, and ALGO.
2022 Era (The Survivors): Filters for resilience during the Bear Market, solidifying the status of established assets like SHIB and ATOM.
2023 Era (Infrastructure & Scale): Captures the rise of "Next-Gen" tech leading into the pre-halving year, introducing TON, APT (Aptos), and ARB (Arbitrum).
2024/25 Era (AI & Speed): Tracks the current Super-Cycle leaders, focusing on the AI narrative (TAO, RNDR), High-Performance L1s (SUI), and modern Memes (PEPE).
Chart Analysis & Strategy ( The "Alpha" )
As seen in the chart above, there is a strong correlation between ALSI Peaks and local tops in TOTAL3 (The Crypto Market Cap excluding BTC & ETH).
The Entry (Rotation): When the indicator rises above the neutral 50 line, it signals that capital is beginning to rotate out of Bitcoin and into Altcoins. This has historically been a strong confirmation signal to increase exposure to high-beta assets.
The Exit (Saturation): When the indicator hits 100 (or sustains in the Red Zone > 75), it means every single Altcoin is beating Bitcoin. Historically, this extreme exuberance often marks a local top in the TOTAL3 chart. This is the zone where smart money typically sells into strength, rather than opening new positions.
How to Read the Visuals
🚀 Altcoin Season (Red Zone > 75): Strong Altcoin dominance. The market is "Risk On."
🛡️ Bitcoin Season (Blue Zone < 25): Bitcoin dominance. Alts are bleeding against BTC. Historically, this is a defensive zone to hold BTC or Stablecoins.
Data Dashboard: A status table in the bottom-right corner displays the live Index Value, current Regime, and a System Check to ensure all 20 data feeds are active.
Settings
Lookback Period: Default 90 Days. Lowering this (e.g., to 30) makes the index faster but noisier.
Thresholds: Adjustable zones for Altcoin Season (Default: 75) and Bitcoin Season (Default: 25).
Credits & Attribution
This open-source indicator is built on the shoulders of giants. I acknowledge the original creators of the concept and the pioneers of its implementation on TradingView:
Original Concept: BlockchainCenter.net. - They established the industry standard definition: 75% of the Top 50 coins outperforming Bitcoin over 90 days = Altseason..
TradingView Implementation: Adam_Nguyen - He implemented the "Dynamic Era" logic (updating the coin list annually) on TradingView. Our code structure for the time-based switching is inspired by his methodology. See also his implementation in the chart. ( Altcoin Season Index - Adam) .
Comparison: Why use ALSI | RM?
While inspired by the above, ALSI introduces three key improvements:
Open Source: Unlike other popular TradingView versions (which are closed-source), this script is fully transparent. You can see exactly which coins are triggering the signal.
Sanitized History (Anti-Fragile): Historical Top 20 snapshots are not blindly used. "Dead" coins (like LUNA and FTT) from previous eras are manually filtered out. A raw index would crash during the Terra/FTX collapses, giving a false "Bitcoin Season" signal purely due to bad actors. The curated list preserves the integrity of the market structure signal.
Narrative Relevance: The 2024/25 basket was updated to include TAO (Bittensor) and RNDR, ensuring the index captures the dominant AI narrative, rather than tracking fading assets from the previous cycle.
You can compare the ALSI indicator with other available tradingview indicators in the chart: Different indicators for the same idea are shown in the 3 Pane window below the BTC and Total3 chart, whereas ALSI is the top pane indicator.
Important Note on Coin Selection Baskets are highly curated: Dead/irrelevant coins (FTT, LUNA, BSV) are excluded for clean signals. This prevents historical breaks and ensures Era T5 captures current narratives (AI, Memes) via TAO/RNDR. See above. Users are free to adjust the source code to test their own baskets.
Disclaimer
This script is for research and educational purposes only. Past correlations between ALSI and TOTAL3 do not guarantee future results. Market regimes can change, and "Altseasons" can be cut short by macro events.
Tags
bitcoin, btc, altseason, dominance, total3, rotation, cycle, index, alsi, Rob Maths

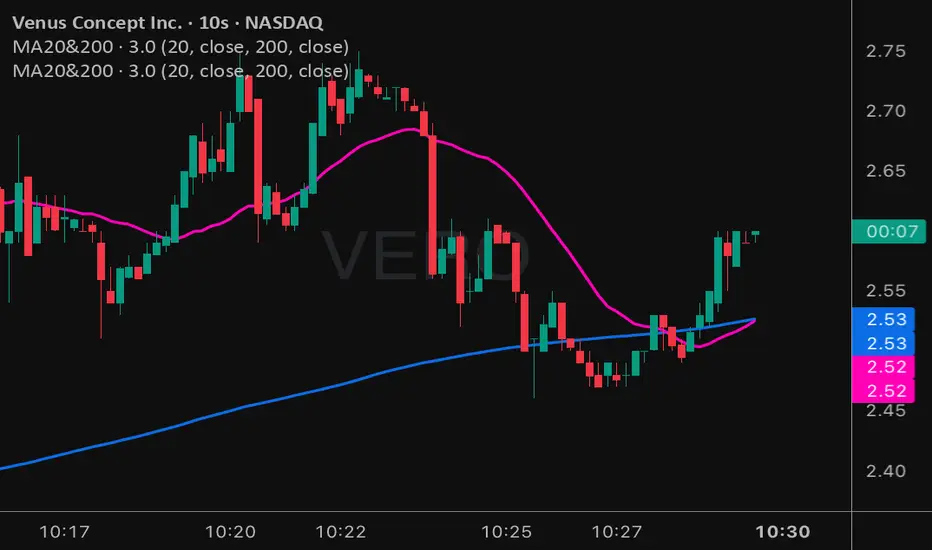
Moving Averages 20 & 200Moving Averages 20&200. Help you decide buy signal to find bullish or bearish.
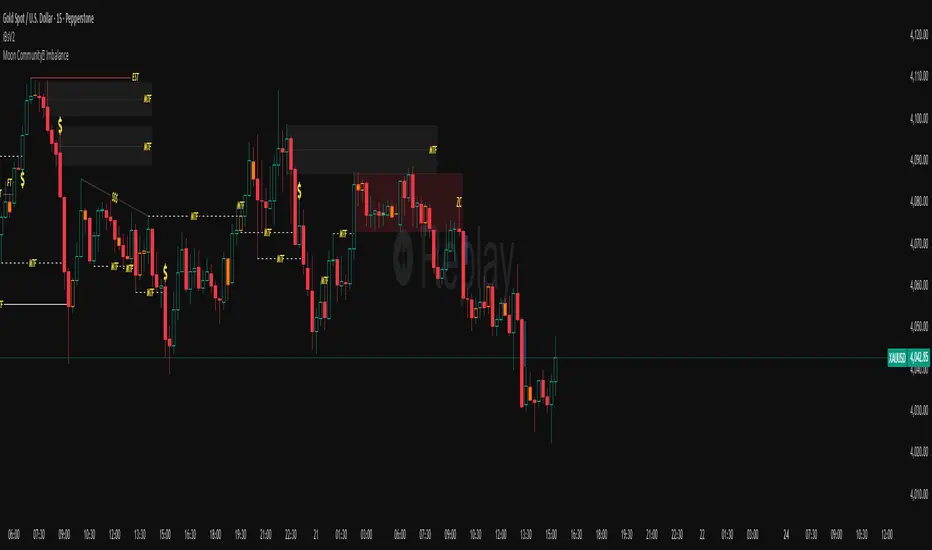
UNDETECTED FX - 250 Pip LevelsIndicator Description – UNDETECTED FX: 250-Pip Psychological Levels
This indicator automatically plots major 250-pip psychological levels on XAUUSD and highlights the price zones around them. These levels act as strong reaction points where liquidity, reversals, and institutional activity commonly occur.
What the Indicator Does
✔ Plots every 250-pip level starting from a user-defined base (e.g., 4050 → 4075 → 4100 → 4125 → …)
✔ Each level is represented by a thick black horizontal line for maximum visual clarity
✔ Around every 250-pip level, the indicator draws a liquidity zone
Top of zone: +200 pips
Bottom of zone: –200 pips
(configured as ± zoneHalf in settings)
✔ Uses extend: both, so levels stretch across the entire chart and stay fixed, no matter how far you scroll
✔ Zones are filled with a customizable color for clear premium/discount visualization
✔ The indicator never repaints and requires no updates after drawing — all levels are fixed on their price coordinates
Why It’s Useful
🔹 Helps quickly identify institutional levels where gold often reacts
🔹 Acts as a framework for scalping, intraday trading, and swing bias
🔹 Makes it easy to spot liquidity sweeps, rejections, and premium/discount areas
🔹 Clearly shows market structure breaks around key psychological levels
🔹 Forces discipline by creating predefined, fixed levels for trading decisions
Best Use Case
XAUUSD scalpers
Intraday traders who rely on precision entries
Traders who use psychological levels, liquidity grabs, or smart-money concepts
Anyone wanting a clean, non-cluttered chart with high-impact levels only

Colby Cheese VWAP Setup [v2.0]🔧 Core Refactors
• Imbalance function fixed:
• Removed invalid usage.
• Now uses for past bar references.
• Bias checks are handled outside the function with proper series indexing.
• Bias alignment:
• Added and so CHoCH signals only fire when price change agrees with EMA bias.
• Swing reset:
• After a valid CHoCH, and reset to so stale levels don’t keep firing.
• Line/label management:
• CHoCH lines and labels now reuse persistent IDs (, ) instead of spamming new objects every trigger.
✨ New Features
• Anticipation mode:
• Blue “Anticipate” lines/labels drawn when delta + bias align before CHoCH confirmation.
• Helps you see potential setups earlier.
• Entry zone lines:
• Solid green/red lines drawn at entry levels when is enabled.
• Separate from FRVP dashed zones.
• Stop‑loss lines:
• Orange dotted lines drawn opposite the entry zone when is enabled.
• Gives a visual risk marker.
🎨 Visual Consistency
• Candle coloring simplified: white candles only when CHoCH triggers.
• FRVP zones remain dashed lines with “Enter” labels.
• Anticipation zones are blue solid lines.
• Entry zones are solid green/red.
• Stop‑loss lines are orange dotted.

ETIQUETAS DE ANCLAJE.INTERVALO 9:00 AM/4.15PMThis indicator displays labels on the candlestick that range from 9:00 am to 4:15 pm, with 5-minute intervals, indicating the 5M periods on the chart.

Multi-TF EMA Alignment with Curvature (Buy & Sell) 2when you pick 3 times frames as a Context, Validation, and Entry, when all EMA's stack on all three time frame with curvature up or down it signals a long or short

Confluence Levels + Vol Triangles + No-Trade GrayWhen two levels cross: Premarket High (PMH), Premarket Low (PML), Yesterday High (YH), Yesterday Low (YL), Opening Range High (ORH), Opening Range Low (ORL),VWAP, you get a confluence trigger (line cross) that is green for a bull signal and red for a bear signal. Orange line cross signals confluence, but it is unclear what direction. Additional confluence is signaled by a triangle once volume

Timeframe Overlay 24HrDaily High–Low Box (00:00–23:59)
This indicator highlights each trading day with a shaded box spanning from 00:00 to 23:59 (based on the selected timezone) and covering the day’s highest and lowest price.
• Green box when the day closes above its open
• Red box when the day closes below its open
• Historical days are fully drawn for easy comparison
• Current day box builds dynamically as new candles form
Useful for visualising daily range, market bias, and intraday structure across all timeframes.

Rainbow MA Width█ OVERVIEW
Rainbow MA Width is a companion indicator for Rainbow MA Cloud. It displays ribbon width as a normalized Z-Score, allowing traders to visualize trend momentum expansion and contraction relative to recent history.
█ CONCEPTS
Z-Score Normalization:
Rather than displaying raw width values (which vary by asset and timeframe),
this indicator normalizes the ribbon width using Z-Score calculation:
Z-Score = (Current Width - Average Width) / Standard Deviation
Z-Score Interpretation:
• 0 = Average width (mean)
• +1 to +2 = Expanding (above average, strong trend)
• -1 to -2 = Contracting (below average, weakening trend)
• Beyond ±2 = Extreme (statistical outlier, potential reversal)
Width Calculation Modes:
• Outer — Distance between fastest and slowest MA: |MA1 - MA8|
• Average Gap — Mean of all adjacent MA gaps
• Total Gap — Sum of all adjacent MA gaps
█ FEATURES
1 — Width Mode Selection
Three methods to calculate ribbon width.
"Outer" recommended for aligned trends.
2 — Z-Score Period
Configurable lookback for mean and standard deviation.
Default 20 bars; increase for smoother, less reactive readings.
3 — Zone Fill Coloring
Cyan fill when expanding (Z > 0).
Orange fill when contracting (Z < 0).
Yellow fill for extreme values (|Z| > 2) as warning.
4 — Alignment Background
Green background during bullish alignment.
Red background during bearish alignment.
Synced with Rainbow MA Cloud for consistency.
5 — Reference Lines
Horizontal lines at 0 (mean), ±1σ, and ±2σ levels.
Provides clear visual boundaries for interpretation.
6 — Raw Width Display
Optional secondary line showing original width percentage.
Useful for comparing normalized vs absolute values.
█ HOW TO USE
Trend Confirmation:
• Z-Score rising above 0 confirms trend acceleration
• Z-Score staying above +1 indicates sustained strong momentum
• Use alongside alignment background for confluence
Reversal Warning:
• Z-Score exceeding +2 suggests overextension (yellow warning zone)
• Z-Score dropping below -2 indicates extreme contraction
• Extreme readings often precede trend reversals or consolidation
Entry Timing:
• Enter trends when Z-Score crosses above 0 (expansion beginning)
• Avoid entries when Z-Score is at extreme highs (potential exhaustion)
• Consider exits when Z-Score peaks and begins declining
█ LIMITATIONS
• Z-Score is relative to lookback period; different periods give different readings
• Extreme zones (±2) are statistical guides, not guarantees
• Best used in conjunction with Rainbow MA Cloud for full context
█ ALERTS
Four built-in alert conditions:
• Z-Score crosses above/below zero
• Z-Score enters extreme high/low zones (±2)

Fish vs Shark Vote Dashboard (6 Signals)very simple dashboard align with fish and shark market votes 1/5 2/4 etc

Momentum Burst Pullback System v66 * Detects **momentum “bursts”** using:
* **Keltner breakout** (high above upper band for long, low below lower band for short), and/or
* **MACD histogram extreme** (highest/lowest in a lookback window, with correct sign).
* Optional **burst-zone extension** keeps the burst “active” for N extra bars after the burst.
* Marks bursts with **K** (Keltner) and **M** (MACD) labels:
* Core burst labels use one color, extension labels use a different color.
* Tracks the most recent burst as the **dominant side** (long or short), and stores burst “leg” anchors (high/low context).
* Adds **structure-based invalidation**:
* On a new **core burst**, it locks the most recent **confirmed swing** level (pivot):
* Long: locks the last confirmed **swing low**.
* Short: locks the last confirmed **swing high**.
* After the burst, if price **breaks that locked level**, the burst regime is **cancelled** (and any pending setup on that side is dropped).
* Finds **pullback setups** after a dominant burst (and not inside the active burst zone), within min/max bars:
* Long pullback requires a sequence of **lower highs** and price still below the burst high.
* Short pullback requires **higher lows** and price still above the burst low.
* Optional background shading highlights pullback bars.
* On pullback bars, plots **static TP/SL crosses** using ATR:
* Anchor is the pullback bar’s high (long) or low (short).
* TP/SL are ± ATR * multiple.
* TP plots are visually classified (bright vs faded) based on whether TP would exceed the prior burst extreme.
* Maintains a **state-machine entry + trailing stop**:
* Sets a “waiting” trigger on pullback.
* Enters when price breaks the trigger (high break for long, low break for short).
* Trails a stop using **R-multiples**, with different behavior pre-break-even, post-break-even, and near-TP.
* Optionally draws the trailing stop as horizontal line segments.
* Optionally shows a **last-bar label** with the most recent pullback’s TP and SL values.

Demi's + EMAs + VWAP + Key SR Lines + RSI SignalsBasic buy sell script for 5 min chart updated daily
