Flexible timezone-aware session rangeAllows you to define session range with local time and its timezone, also can toggle session visibility any day of week.
Range


Tradelivio's Ranging vs Trending Indicator ADXThis indicator is based on ADX and helps identify if a market is ranging/consolidating or trending.
Default setting are as follows:
0-15 Absent Trend
15-25 Weak Trend
25+ Strong Trend
FYI:
50-75 Very Strong Trend
75-100 Extremely Strong Trend
You can configure 3 levels of strength (Absent, Weak & Strong)
Please keep in mind that a falling ADX line only means that the trend strength is weakening, and it usually does not mean the trend is reversing, unless there has been a price climax.

PnD [Intromoto]This scripts forms a range based on time, then looks for the levels of premium (the difference between spot and perpetual price) and plots a signal depending on breakout or breakout.
The indicator only works properly on Binance perpetual futures charts. If you're not on a Binance perp chart, the metrics will default to a Biannce:BTCUSDT vs Binance:BTCUSDTPERP premium comparison.
This indicator automatically calls the appropriate spot vs future comparison. i.e if you're on the Binance:MATICUSDTPERP chart it knows to check the Binance:MATICUSDT chart for contrast.
"Super Pumps" are range breakouts with extreme levels of backwardation - set in user inputs
"Pumps" are range breakouts with less extreme backwardation - no user input
"Push" occurs where there are irregularities in the premium vs price sequence, indicating a potential bottom
"Pull" occurs where there are irregularities in the premium vs price sequence, indicating a potential top
"Dumps" are range breakdowns with extreme levels of premium - set in user inputs by %, indicating a potential top
Users can set the base range period, i.e the duration (length) of the range, as well as the range height, established by the first candle of the new range.
User inputs a resolution of candle close required to trigger the signal. i.e "15" would mean price needs to close a 15 minute candle outside of the established range for the signal to appear.
Example: Base period 240, Range Period 15. This would create an invisible range every 4 hours from its first fifteen minute candle. Any price closing (based on resolution in the inputs) would alert a breakout or breakdown.
DM for access.
Thanks

Average Trading Range Percentage
Average high/low trading range for the current timeframe.
Daily high/low trading range.

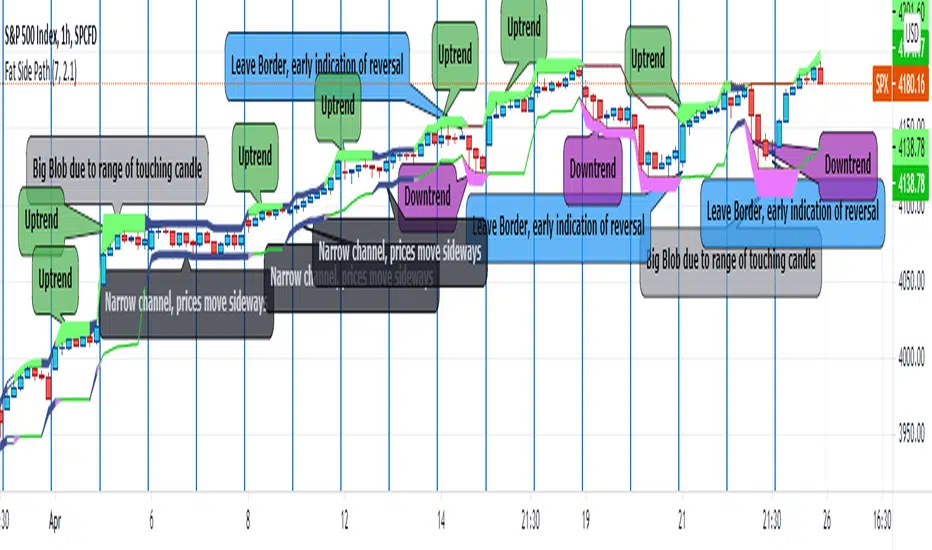
Fat Side PathI got the idea for a narrow Donchian Channel with a short lookback period which closely follows the price fluctuation in which the sides of the channel have a thickness according to the range of the last touching candle.
Any channel, be it Donchian, Keltner, Bollinger Bands or Parallel, has an upside and a downside, touching the upside is a buy signal as this may initiate an uptrend, the downside a sell signal because a down trend may come.
This gave me the idea to make only the last touched side fat, thus creating visible switching between uptrend and downtrend. However this is ‘too digital’, as in practice also periods of no trend occur in which signaling a trend would give a false signal. In a Donchian channel (and also Bollinger Bands) such periods are marked by narrowing the channel. So I gave a no trend signal to the sides when the channel is narrower than a minimum width to call a trend. I gave the thing nice colours and proper default settings.
Use of the channel in trading.
I think this thing can be useful for swing trading. In channels two typical things may happen that should be noted by the trader, these are LB, Leaving the Border, which signals a trend reversal and FTT, Failure To Traverse, i.e. the price doesn’t manage to cross the channel to the other side. This affirms the trend. FTT’s are not expected in short lookback channels like this path (Sidenote: Fibonacci levels can be regarded as predictions where FTT’s may occur). The fat side indicates direction. Because somehow trends seem to end with a notable range extension, this channel sometimes produces a “Big Blob” where the trend reverses.
I intend to use this thing together with my Keltner Fibzones channel, where the zones serve as a ‘landscape’ in which the Fat Side Path meanders providing ‘comments’ on the short term price movements.
Rosebud Trend [DepthHouse]Rosebud Trend Indicator uses complex range calculations to easily detect trend changes, critical support and resistance levels, and even aid in spotting reversals. The Critical Support & Resistance Zones are plotted via the red and green cloud. This cloud not only visually displays the expected trend direction but often acts as major support and resistance zones. The outer band measures the expected range in which the assets trades within over longer periods of time.
Users can switch the ‘Trend Sensitivity’ between ‘Low’ and ‘High’ to increase or decrease the rate at which the cloud changes.
By altering the S/R Band Thickness users can furthermore increase or decrease the rate at which a trend changes by altering the thickness of the cloud. I prefer to keep these settings at 0.55 , 0.382, or 0.236.
The bar colors are generated by a combination of Rosebuds primary function and our ATR AUTO Oscillator base functions. Users have 3 bar color options to select from: Simple, Complex, and Off .
Simple: Bars colors alternate between shades of red and green based on the trend direction and the ATR Auto strength. Stronger the shade, the stronger the trend.
Complex: This adds a few extra variables to the script which generates a more complex bar color display. Using this option, Rosebud will generate light red bars in a bull trend if downward movement is strong and vice versa in a bear trend. It also will generate a purple bar if the candle successfully closes above or below the Top & Bottom Range Bands; We call this a range break , and it could be an early sign of strong upward or downward movement.
Off: In case you like to keep things even simpler, this option hides all overlay bar colors.
Sample of Complex Bar Colors:
Bull, Bear signals along with Up and Down arrows are too based on a combination of our trend direction and ATR Auto Oscillator calculations.
Users have the option to adjust both bar color, and shape generation settings via:
Smoothed Signal Option: Turns advance smoothing on or off. On will reduce signal noise, while Off could land you that perfect bottom signal with a lower success rate.
Candlestick Length: Default factor for bar color and shape generation, higher the number the fewer signals that will generate.
Candlestick Smoothing: Default smoothing for the Candlestick Length
Signal Lookback: Adjust the factor at which Bull, Bear, Up, and Down. Lower this to 2 for more signals.
Cross Thresholds: The lower this number the easier it is for ‘Bull’, ‘Bear’, and over extended signals to generate; see image below:
*Users also have the option to hide all signal visuals via the 'Shapes' On/Off option.
Users have multiple built in Alerts to choose from:
Bullish Trend Change: When the critical cloud switches to Bullish
Bearish Trend Change: When the critical cloud switches to Bearish
Upper Range Break: When the price action closes above the Range Top
Lower Range Break: When the price action closes below the Range Bottom
Light Bullish Cross: Early bullish signal; also displayed by up arrows by default
Light Bearish Cross: Early bear signal: also displayed by down arrows by default
Verified Bullish Cross: Occurs when a Bull signal is generated.
Verified Bearish Cross: Occurs when a Bear signal is generated.
*Past performance is no guarantee of future results*

Price Cross Range StrengthPurpose:
This script shows when price is in a range or trending. When the green line rises above the threshold the price is trending. When the green line falls below the threshold it's ranging. You may try adjusting the lookback way far back to find more areas of resistance.
Logic:
It shows how many instances the current price has been crossed in the past measured bars. The logic is that any price area that has been crossed many times is a strong area where ranging occurs.
Ideas:
1. Can be used as a dynamic length to other moving averages.

QMWD RangerThis script will display the previouse Highs, Lows and Mid of the last:
- Quarter
- Month
- Week
- Day
Ranges
Its pretty good in finding potential pivot areas.

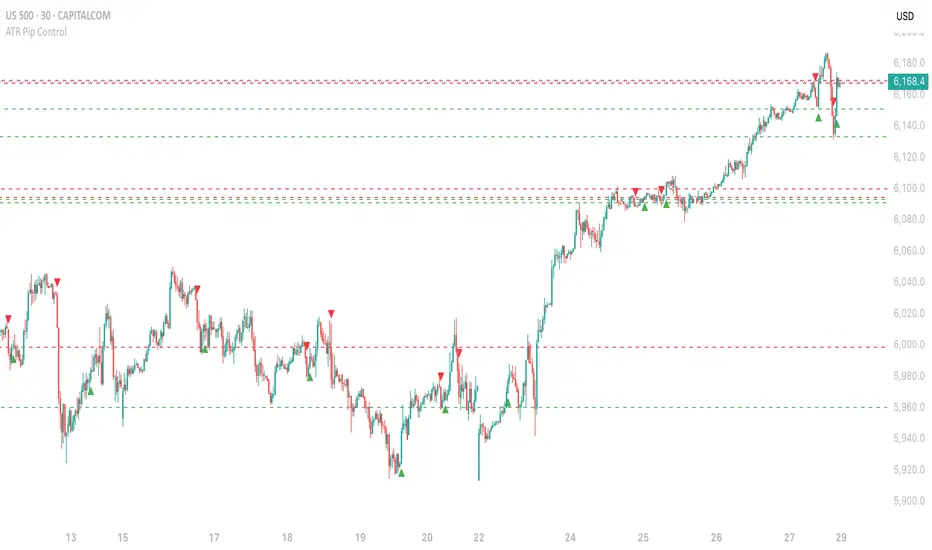
ATR Pip Control█ OVERVIEW
Here is a script based on the ATR but which unlike the traditional ATR using a Multiplier, here we use a signal filter by the Exchange of Prices
between Ticks. The more you increase the value, the more the parasitic signals will be filtered.
█ HOW TO INTERPRET?
• The signals are represented on the chart by "Buy" (Green) and "Sell" (Red) Labels.
• Pip Channel Control : Filters ATR Signals by the Exchange of Prices between Ticks. 0 = Disabled.
• Pip Length : Length of the Pip Channel. Depending on the Markets, the value can differ from 2 to 20 for Futures, Forex, CFD...
(But can go up to 5000 or more for Cryptos.) 0 = Disabled.
• Local High/Low : Local High/Low lines can be used as Stop Loss/Take Profit Zone.
• you have the option to display or not the Unconfirmed Signals on the Chart.
(They will also be displayed with "Buy" and "Sell" Labels but being transparent).
• The indicator works on all Timeframes and all types of markets.
• NO THE INDICATOR DOESN'T REPAINT.
█ ALERTS
Here is the list of Alerts available :
•ATR Buy (Unconfirmed)
•ATR Buy Condition!
•ATR Sell (Unconfirmed)
•ATR Sell Condition!
Please note that it is essential to always choose "Once per bar" (and NOT the "Once per bar close"!) option
whenever you want to place an Alert.
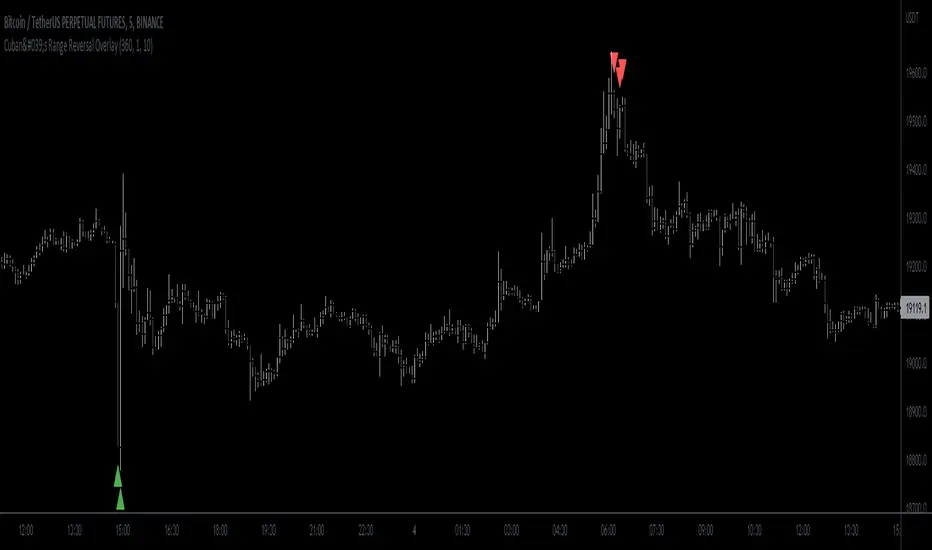
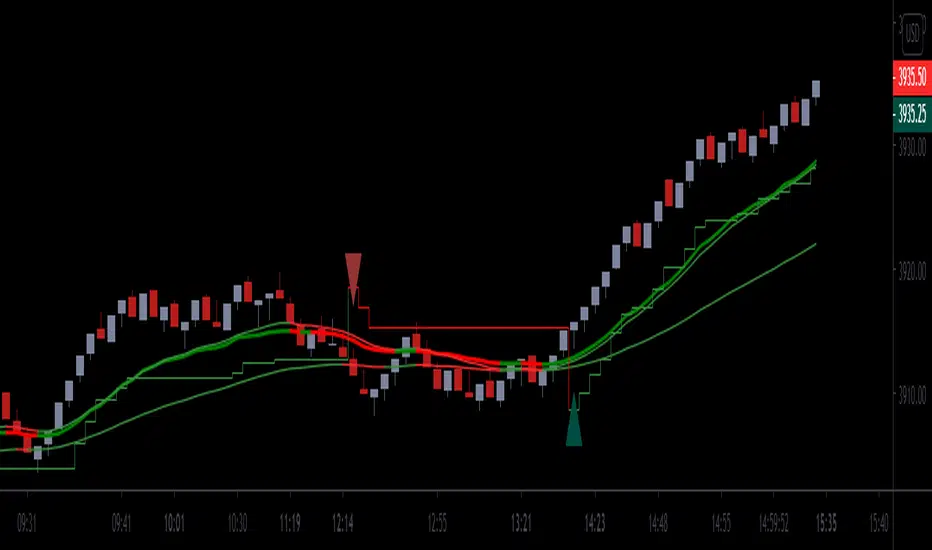
Cuban's Range Reversal OverlayBeen a minute since a public script!
This one looks at the range and recommends potential reversal depending on degree of overextension.
Originally intended for low timeframe short time horizon reversals but works well on higher timeframes as well.
Oscillator included in the image so you can see under the skirt and check what's happening.
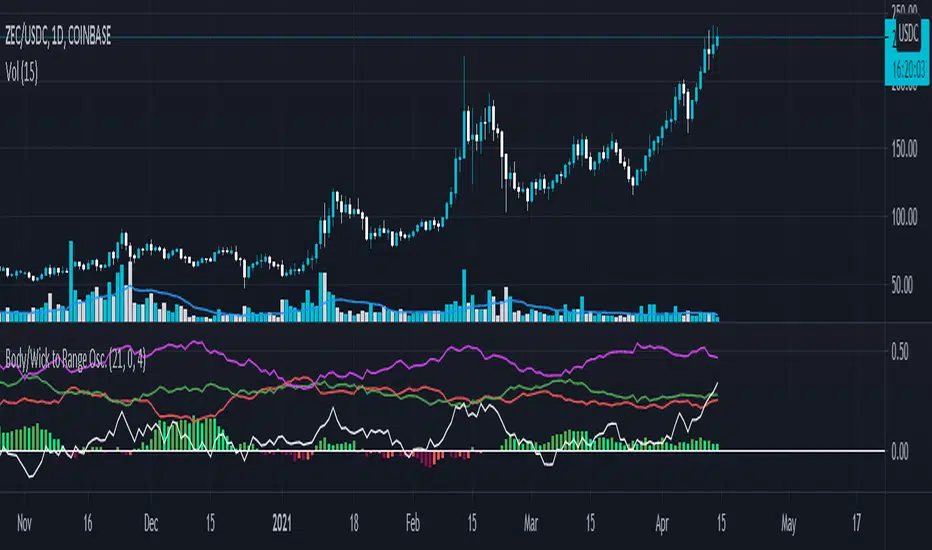
Body/Wick to Range Osc.This script is meant to be a form of pure candlestick analysis.
Terminology in the description used below is as follows:
- numcands = Number of candles specified by the user to be used for sampling in each moving average.
This script plots moving average (SMA/EMA specified by the user ) of the percentage of the high-low range that the previous {numcands} candles the upper wicks, lower wicks, and the body take up.
The user may specify if the absolute value of the body percentage is to be used (true by default). To account for this, a horizontal line is also plotted at 0 to show when the body percentage moves above or below 0.
The values that all of these moving averages plotted will oscillate between 0 and 1 (-1 and 1 for the body percentage if the absolute value of candles is not used).
Other notes: The user may select the colors used (colorblind support, as the defaults are red and green). Cross overs and cross unders are accounted for in alertconditions (as is if the body % moves above and below 0% if absolute values are not used).
An interpretation of the use of this script may be: If the upper wicks begin to take up a larger portion of the high-low range, it may signal downward selling pressure (and vise-versa for lower wicks). However, this may be open to interpretation based upon the specified {numcands} used.

Up-Down RangeHere is an attempt to segregate ATR into ATR of up days and down days.
While setting trailing stops based on ATR, you probably need to consider more on how an instrument can drop during red days. Hence, ATR of only red days makes more compelling case than overall ATR. Another use case for this kind of indicator may be in options if you are selling puts and calls with the intent of pocketing premiums on expiry.
Parameters are as explained below:
Range Type : Different range types are tr (True Range) , close (difference between close prices), highlow (difference between high and low of candle)
Period : ATR Period
Moving Average Type : Moving Average Type for calculating ATR. Two additional types - min and max are added which calculates lowest and highest range in last n bars
HideFullAtr : Hides combined ATR if checked.
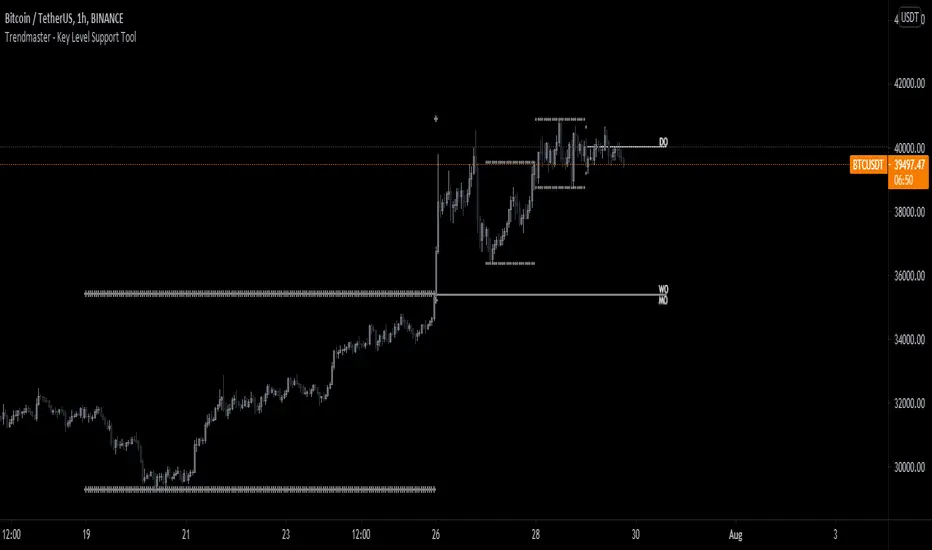
RSI, Range, and Key Level Support Tool v2.1This indicator is actually 3 different indicators combined to be able to watch key levels such as daily/weekly/monthly opens, previous days and week range highs and lows, as well as see Oversold and Overbought conditions relating to the Relative Strength Index (RSI).
- RSI DOTS SYSTEM
The first part is a custom Relative Strength Index indicator that shows RSI dots above in Red and Below in Green of the bars.
As the RSI Dots go from dark and barely visible to bright and Red For Oversold or Green for Overbought it gives a direct representation above the bar chart of Overbought or Oversold conditions. The brighter the color, the closer to 100 (Overbought and Red) or 0 (Oversold and Green) the current RSI is.
As the Overbought and Oversold conditions reverse this will show a bright Yellow Dot over the bar if it crosses a value from Overbought conditions to not Overbought conditions and the same if it crosses from Oversold conditions to not oversold conditions. To put it simply, it shows RSI reversal.
- KEY LEVELS OPENS - Daily, Weekly, Monthly Opens
This is a simple line indicator that shows 3 key levels: Daily Open, Weekly Open, and Monthly Open.
These higher time frame key levels show precisely at what price that time frame opened based on 0 UTC.
- PREVIOUS HIGHS/LOWS
This part of the indicator will show the previous day and even week highs and lows. This will help the user establish a functional range of the previous days and weeks.
The highs and lows for the daily are rows of circles above and below the high and low for that specific day and the previous weekly range are rows of crosses above and below the high and low for the past week.
How to Best use the indicator:
The RSI dots will help the user find the tops and bottoms where the Key Levels Opens and Previous Highs and Lows will help the user establish the range.
Knowing where the local top/bottom is in correlation to the potential range tops and bottoms allows the user to effectively time trend reversals and potential tops/bottoms.
ATR - ATR from Low, ATR from High LabelsChecks what the average true range is for the X amount of trading days. Then will also label the ATR from the low, and the ATR from the high of the current day.
A second label can be created dependent on current days RVOL %. If RVOL is not 0 or 1, then it will create the second label. Otherwise it will just leave it as the standard label.
The calculation for second label is RVOL * ATR.

Viper Futures Range Bar CandlesThe Range Bars used in more Professional trading platforms to keep smoothness on the charts and help make custom range price candles based on the range size chosen for the market being traded. Example an 8 Range bar on the ES or MES Futures is 8 ticks = 2 points. Another Example on NQ a 22 Range bar popularly traded by trading professionals is a total of 22 ticks = 5 1/2 points on the Nasdaq or Micro NQ futures. Simple add to charge, set the range bar setting with a particular range setting in mind and then for clarity uncheck the original price chart on top left corner, same way you would disable an indicator temporarily. Works very clear and nice. A good accommodation for trading View as trading view does not offer historical tick data to use Renko bars very well at the moment.
Basically plots a candle rather then a OHLC bar for Range Bars on TV!
Default color was set to my Viper Futures Chart, you can change back to green/red, etc.
Enjoy!
Vortex Range Breakout SystemThis is a Vortex Based Visual System,
Which can help you identify the Vortex Crosses based Range Breakouts/ Breakdown, over the price Scale,
How its made ?
The vortex Crosses are projected over the Price
on Same Time frame {Green and Red Filled area}
-> green Area means : Vortex Crossover Range
-> red Area means : Vortex Crossunder Range
and on Higher Timeframe
Vortex Cross Levels are Plotted, which you see as :
Blue and Orange Lines
Default Configs
Vortex Period is 14
Higher Timeframe Option is set to 60 mins
You can change the Higher timeframe to any minutes which suits your need
Also If you want to change the Higher Timeframe in Days
just know
1D = 24*60 min, = 1140mins
Enjoy!

PVA Range High & LowFINALLY LEFT. the RANGE DAILY at the top RDH and the RANGE DAILY at the bottom RDL, is a PVSRA indicator used to calculate the daily ATR (Average True Range), with the help of my friend @ferhro, I was the one that managed to get closer to the original indicator for the metatrader 4.
Let's the features.
This indicator works as a support and natural resistance of the price, as it has a similarity with the pz supertrend, only on the daily chart.
Range daily High is the gray color and Range daily Low is the red color.
To extract the greatest potential from this indicator, I recommend using forex.
The indicator will be open source for suggestions for improvements.

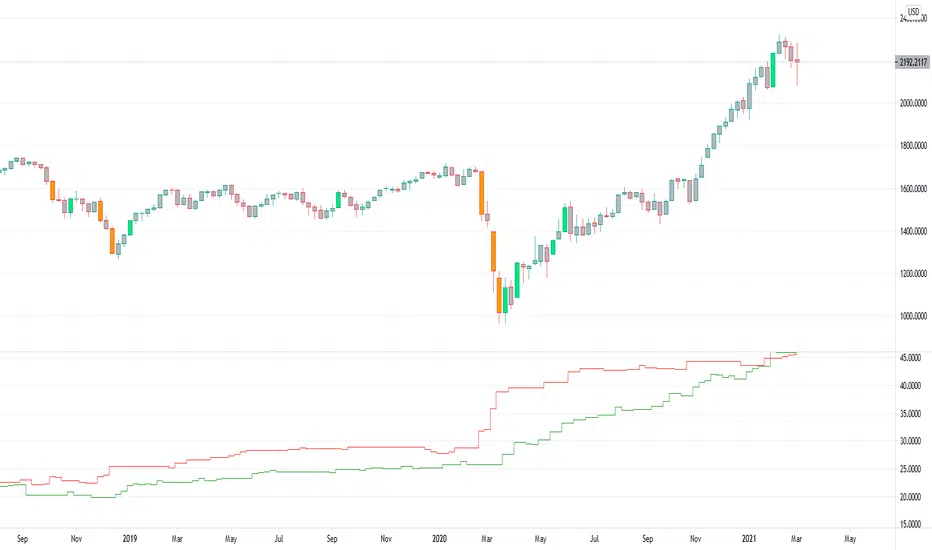
Mandelbrot's RangeThis uses a Rescaled Range from Benoit Mandelbrot's Misbehavior of Markets to devise a Risk Range on stocks. A trading position can be managed by selling portions at the top of the risk range and selling at the bottom of the risk range.
The Length parameter defines how wide the range is and how frequently the price will reach the range bands.
The Vol Length Parameter defines how far back to weight volatility, and how responsive the bands will be in response to volatility

Range Box (Nephew_Sam_)Version 1
Creates a box around a specified time range with the ability to extend the lines to a later time.
Next update:
- Background in box
- Remove historical boxes
- Extend lines in future instead of only till current price
There's similar but complex indicators out there, I'll leave this code as open source and you have permission to reuse and not credit me.


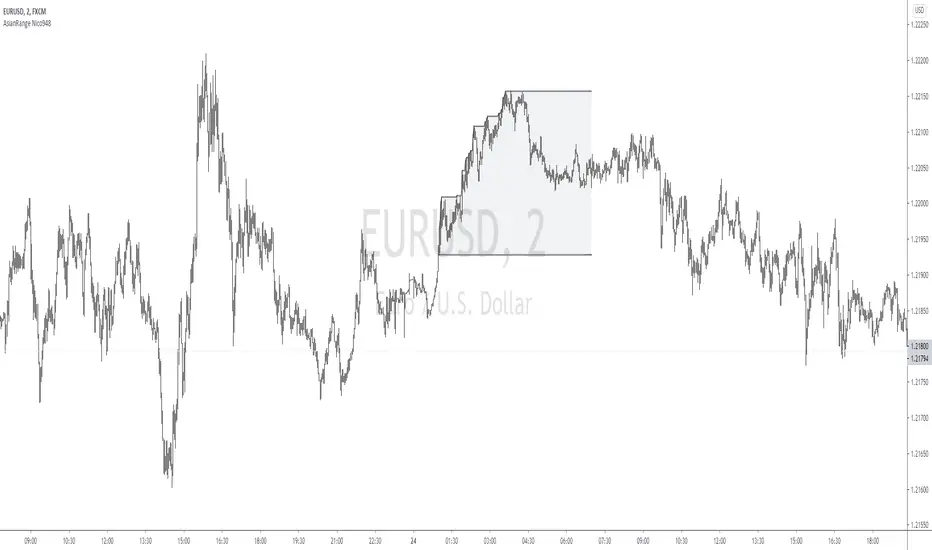
Asian Range by Nico948Displays the Asian session range on your graph.
Masked for timeframes higher than 15 minutes.
However, it can be displayed on 1 hour timeframe by filling in the relevant box in the parameters.