Multi-Asset Cross Timeframe Divergence Ind. (MACDI) // AlgoFyreThe Multi-Asset Cross Timeframe Divergence Indicator (MACDI) identifies divergences in momentum like RSI across multiple assets and timeframes. It visually highlights lagging correlated asset momentum divergences, helping traders spot inefficiencies and potential trade opportunities in the following asset.
🔶 KEY FEATURES
🔸Average Momentum Trendline for Each Timeframe
The Average Momentum Trendline feature calculates the average momentum of multiple assets over specified timeframes. It uses smoothed values to determine the momentum trend for each timeframe on the average aggregated momentum of both assets. This trendline helps traders identify the overall direction of the market momentum, providing a clearer picture of potential price movements.
🔸Real-time Divergence Indication and Alert Table
The Real-time Divergence Indications and Alert Table feature visualizes detected divergences between the momentum values of the two assets across different timeframes. It identifies both bullish and bearish divergences, signaling lagging reversals in the the following asset and potential trading opportunities. When a divergence is detected, the system generates real-time visual indications on the chart and in an overview table for traders to act promptly. The alert table provides a comprehensive overview of all detected divergences, making it easier for traders to monitor and respond to market changes.
🔸Color and Size Based Labels on Price Chart based on Divergence Type
The Color and Size Based Labels feature visually represents divergences directly on the price chart. Bullish and bearish divergences are marked with distinct colors and sizes, making them easily identifiable at a glance. Larger labels indicate higher timeframes and thus generally more significance.
🔶 INSTRUCTION GUIDELINES
🔸Identify Divergence Clusters
The more divergences align, the higher the probability of a potential trend reversal in the asset. When multiple multi-timeframe divergences occur in both lower and higher timeframes within a local cluster, the probability of a reversal increases. This is valid for both for bullish and bearish divergences.
🔸Spot Low Probability Divergences
To further increase the probability, analyze the current state of the average momentum trendline. For a bullish reversal, a relatively low level of the average momentum trendline is preferred, whereas for a bearish reversal, a relatively high level is preferred.
🔶 INDIVIDUAL CONFIGURATION
🔸Leading Asset
This input allows the user to select the leading asset for the divergence analysis.
🔸Following Asset
This input allows the user to select the following asset for the divergence analysis.
🔸Higher Timeframe
This input sets the higher timeframe for the analysis.
🔸Lower Timeframe
This input sets the lower timeframe for the analysis.
🔸Show RSI Divergence
This input enables or disables the display of RSI divergence signals.
🔸RSI Length
This input sets the length of the RSI calculation.
🔸RSI Source
This input sets the source data for the RSI calculation (e.g., close price).
🔸RSI Smoothing Length
This input sets the length of the smoothing applied to the RSI values.
🔸Smoothing Method
This input sets the method used for smoothing the RSI values.
🔶 CONCLUSION
The Multi-Asset Cross Timeframe Divergence Indicator (MACDI) is a powerful tool for identifying momentum divergences across multiple assets and timeframes. Its visual cues and customizable table make it easy to use and interpret, providing valuable insights for trading decisions.
Rsi_divergence

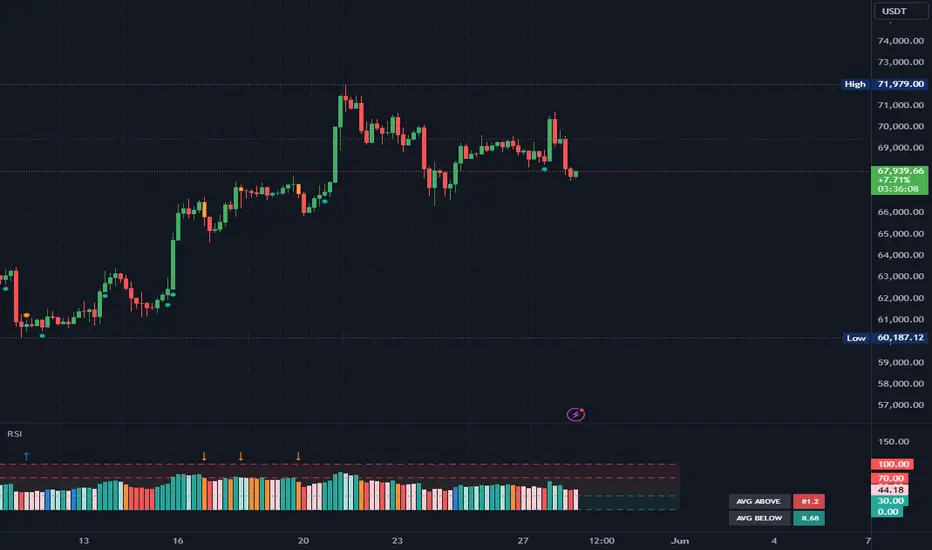
RSI Divergence and GradientThe RSI Divergence and Gradient Indicator simplifies the process of identifying the relationship between price action and the Relative Strength Index (RSI). By integrating RSI data directly into the price chart, traders no longer need to open a separate pane to monitor RSI or manually compare price action and RSI.
This indicator allows traders to easily spot overbought or oversold conditions and detect divergences between price and RSI. These signals can help identify potential reversal points and more effectively assess trend strength.
Features
RSI Divergences: The script identifies and plots bullish and bearish RSI divergences, which can signal potential reversals. Bullish divergences are indicated by an upward triangle below the price bars, while bearish divergences are indicated by a downward triangle above the price bars.
Overbought/Oversold Gradient: The script uses a color gradient to highlight overbought and oversold conditions on the chart, helping traders visualize momentum and trend strength. The gradient dynamically adjusts based on RSI values, transitioning through different colors to represent the intensity of overbought or oversold conditions.
Customizable Gradient: The gradient is customizable, allowing traders to set their own thresholds for overbought and oversold levels, and to choose the colors that best suit their trading style. This flexibility ensures the indicator can be tailored to individual preferences.
How It Works
RSI Calculation: The indicator calculates RSI using the standard 14-period length by default, but this can be adjusted to suit the trader's needs.
Divergence Detection: The script identifies divergences by comparing the highest and lowest points of the RSI with the corresponding price levels over the RSI period length. When a divergence is detected, it is plotted on the chart to indicate a potential reversal.
Gradient Coloring: The gradient coloring system changes the bar colors based on RSI levels. The color transitions from a neutral tone to specified start and end colors as RSI approaches overbought or oversold thresholds, providing a visual cue for potential overextended market conditions.
Intended Use
This indicator is particularly useful for traders who want to combine momentum analysis with divergence signals to identify potential reversal points or confirm trend strength. The visual gradient aids in quickly assessing market conditions, making it easier to spot high-probability trading opportunities.

Super RSI: Multi-Timeframe, Multi-RSI-MA, Multi Symbol [DucTri]█ Overview
RSI is a very popular indicator that almost every trader knows about. I created this indicator with the goal of helping you use RSI more conveniently and effectively.
█ Uses
Monitor the RSI of 10 currency pairs simultaneously.
The first column shows the RSI of the current currency pair.
RSI below 30 will have a Red background, and above 70 will have a Green background.
Display multiple RSI lines with different lengths (or timeframes).
Displays 3 RSI with 3 different lengths 7, 14 and 21
Displays two RSI lines with two different timeframes. The purple line shows RSI (14) for the 1H timeframe, and the blue line shows RSI (14) for the 4H timeframe.
Display MA and Bollinger Band lines for RSI.
Shows the RSI line along with two MA lines of the RSI: EMA (9) in blue and WMA (45) in red.
Identify RSI Divergence with custom settings
█ Input
- You can have up to three RSI lines, with customizable lengths and timeframes.
- You also have up to three RSI-MA lines, where you can customize the MA type and length.
- You can track RSI for up to 10 currency pairs at the same time.
- Additionally, you can change how the top (or bottom) is determined when identifying divergence.
█ Alerts
Send alerts when two RSI lines cross. For example, when the RSI 14 crosses above the RSI 21, or the RSI on the 1H timeframe crosses above the RSI on the 4H timeframe.*
Send alerts when RSI crosses above or below the RSI-MA line.
Send alerts when two RSI-MA lines cross. For example, when the RSI-EMA (9) crosses above the RSI-WMA (45).*
Send alerts when Divergence (Convergence) appears.
Send alerts when any currency pair in the monitored list shows an Overbought or Oversold signal.

Supply and Demand Zones with Enhanced SignalsThis Pine Script indicator combines supply and demand zone analysis with dynamic buy/sell signals to enhance trading strategies. It provides a robust framework for identifying optimal trading opportunities and managing existing trades.
Key Features:
Supply and Demand Zones: The indicator identifies significant supply and demand zones based on recent price action. These zones are plotted as horizontal lines to help traders visualize potential reversal points.
Exponential Moving Average (EMA): A 21-period EMA is used to determine the prevailing trend and generate buy and sell signals.
Relative Strength Index (RSI): The 14-period RSI is utilized to filter buy and sell signals, providing additional context on overbought and oversold conditions.
Signal Generation:
Buy Signal: Triggered when the price crosses above the EMA and RSI indicates that the market is not overbought.
Sell Signal: Triggered when the price crosses below the EMA and RSI indicates that the market is not oversold.
Enhanced Exit Signals:
Exit Buy Signal: Generated if an opposite sell signal occurs or the higher timeframe RSI indicates overbought conditions.
Exit Sell Signal: Generated if an opposite buy signal occurs or the higher timeframe RSI indicates oversold conditions.
Trade Management:
Tracks active trades and provides exit signals based on the occurrence of opposite trading signals. This helps in managing positions more effectively and reducing potential losses.
Usage:
Supply and Demand Zones: Look for price action around these zones to identify potential trading opportunities.
EMA and RSI: Use buy and sell signals in conjunction with EMA and RSI to validate trading decisions.
Higher Timeframe RSI: Utilize this for additional confirmation and exit signals.
Plotting:
Supply Zone: Plotted as a red horizontal line.
Demand Zone: Plotted as a green horizontal line.
EMA: Plotted as a blue line.
Buy and Sell Signals: Indicated by green and red triangle shapes, respectively.
Exit Signals: Indicated by blue and orange X shapes.
This indicator is designed to help traders make informed decisions by combining technical analysis with strategic trade management.

VWAP with RSIVWAP with RSI Indicator
Overview
The VWAP with RSI Indicator is a powerful tool that combines the Volume Weighted Average Price (VWAP) with the Relative Strength Index (RSI) to provide traders with comprehensive insights into price trends, volume-weighted price levels, and market momentum. This dual-indicator setup enhances your trading strategy by offering a clearer understanding of the market conditions, potential entry and exit points, and trend reversals.
Key Features
VWAP (Volume Weighted Average Price):
Calculation: The VWAP is calculated using the high, low, and close prices, weighted by trading volume over a specified period.
Purpose: VWAP provides an average price that reflects the trading volume at different price levels, helping traders identify the true average price over a given period.
Visualization: The VWAP line is plotted in blue on the price chart, indicating the volume-weighted average price.
RSI (Relative Strength Index):
Calculation: RSI is based on the average gains and losses over a specified period (default is 14 periods) and ranges from 0 to 100.
Purpose: RSI measures the speed and change of price movements, identifying overbought or oversold conditions in the market.
Overbought/Oversold Levels:
Overbought: RSI above 70 (red line).
Oversold: RSI below 30 (green line).
Midline: RSI at 50 (gray dashed line).
Visualization: The RSI line changes color based on its value (purple for normal, red for overbought, green for oversold) and is plotted below the price chart.
Background Fill for RSI:
Overbought Area: Shaded red when RSI is above 70.
Oversold Area: Shaded green when RSI is below 30.
Bullish and Bearish Divergence Detection:
Bullish Divergence: Occurs when price forms a lower low, but RSI forms a higher low, indicating potential upward reversal.
Visualization: Bullish divergence points are marked with a green line and labeled "Bull."
Bearish Divergence: Occurs when price forms a higher high, but RSI forms a lower high, indicating potential downward reversal.
Visualization: Bearish divergence points are marked with a red line and labeled "Bear."
Alerts: Conditions for bullish and bearish divergences trigger alerts.
Settings
VWAP Settings:
hideonDWM: Option to hide VWAP on daily or higher timeframes.
src: Source for VWAP calculation (default is hlc3 - (high + low + close)/3).
offset: Offset for plotting the VWAP.
RSI Settings:
rsiLengthInput: Period length for RSI calculation (default is 14).
rsiSourceInput: Source for RSI calculation (default is close price).
maTypeInput: Type of moving average applied to RSI (options: SMA, EMA).
maLengthInput: Length of the moving average applied to RSI.
How to Use
Trend Identification: Use VWAP to identify the average price level and market trend. If the price is above VWAP, it suggests an uptrend, and if below, it suggests a downtrend.
Overbought/Oversold Conditions: Use RSI to identify potential reversal points. RSI above 70 indicates overbought conditions, and below 30 indicates oversold conditions.
Divergence: Look for bullish or bearish divergences between price and RSI to anticipate potential trend reversals.
Conclusion
By combining VWAP and RSI, this indicator provides a robust framework for analyzing market conditions, identifying trends, and making more informed trading decisions. Enhance your trading strategy today with the VWAP with RSI Indicator!

Advanced Gold Scalping Strategy with RSI Divergence# Advanced Gold Scalping Strategy with RSI Divergence
## Overview
This Pine Script implements an advanced scalping strategy for gold (XAUUSD) trading, primarily designed for the 1-minute timeframe. The strategy utilizes the Relative Strength Index (RSI) indicator along with its moving average to identify potential trade setups based on divergences between price action and RSI movements.
## Key Components
### 1. RSI Calculation
- Uses a customizable RSI length (default: 60)
- Allows selection of the source for RSI calculation (default: close price)
### 2. Moving Average of RSI
- Supports multiple MA types: SMA, EMA, SMMA (RMA), WMA, VWMA, and Bollinger Bands
- Customizable MA length (default: 3)
- Option to display Bollinger Bands with adjustable standard deviation multiplier
### 3. Divergence Detection
- Implements both bullish and bearish divergence identification
- Uses pivot high and pivot low points to detect divergences
- Allows for customization of lookback periods and range for divergence detection
### 4. Entry Conditions
- Long Entry: Bullish divergence when RSI is below 40
- Short Entry: Bearish divergence when RSI is above 60
### 5. Trade Management
- Stop Loss: Customizable, default set to 11 pips
- Take Profit: Customizable, default set to 33 pips
### 6. Visualization
- Plots RSI line and its moving average
- Displays horizontal lines at 30, 50, and 70 RSI levels
- Shows Bollinger Bands when selected
- Highlights divergences with "Bull" and "Bear" labels on the chart
## Input Parameters
- RSI Length: Adjusts the period for RSI calculation
- RSI Source: Selects the price source for RSI (close, open, high, low, hl2, hlc3, ohlc4)
- MA Type: Chooses the type of moving average applied to RSI
- MA Length: Sets the period for the moving average
- BB StdDev: Adjusts the standard deviation multiplier for Bollinger Bands
- Show Divergence: Toggles the display of divergence labels
- Stop Loss: Sets the stop loss distance in pips
- Take Profit: Sets the take profit distance in pips
## Strategy Logic
1. **RSI Calculation**:
- Computes RSI using the specified length and source
- Calculates the chosen type of moving average on the RSI
2. **Divergence Detection**:
- Identifies pivot points in both price and RSI
- Checks for higher lows in RSI with lower lows in price (bullish divergence)
- Checks for lower highs in RSI with higher highs in price (bearish divergence)
3. **Trade Entry**:
- Enters a long position when a bullish divergence is detected and RSI is below 40
- Enters a short position when a bearish divergence is detected and RSI is above 60
4. **Position Management**:
- Places a stop loss order at the entry price ± stop loss pips (depending on the direction)
- Sets a take profit order at the entry price ± take profit pips (depending on the direction)
5. **Visualization**:
- Plots the RSI and its moving average
- Draws horizontal lines for overbought/oversold levels
- Displays Bollinger Bands if selected
- Shows divergence labels on the chart for identified setups
## Usage Instructions
1. Apply the script to a 1-minute XAUUSD (Gold) chart in TradingView
2. Adjust the input parameters as needed:
- Increase RSI Length for less frequent but potentially more reliable signals
- Modify MA Type and Length to change the sensitivity of the RSI moving average
- Adjust Stop Loss and Take Profit levels based on current market volatility
3. Monitor the chart for Bull (long) and Bear (short) labels indicating potential trade setups
4. Use in conjunction with other analysis and risk management techniques
## Considerations
- This strategy is designed for short-term scalping and may not be suitable for all market conditions
- Always backtest and forward test the strategy before using it with real capital
- The effectiveness of divergence-based strategies can vary depending on market trends and volatility
- Consider using additional confirmation signals or filters to improve the strategy's performance
Remember to adapt the strategy parameters to your risk tolerance and trading style, and always practice proper risk management.

RSI - Made EasyThis indicator is a visually improved version of RSI. It makes it much easier to see what's happening by simplifying those confusing, intersecting lines. With this, you can detect the RSI direction more clearly. All the features are also explained in the tooltips of the input fields. Some extra features are included, such as average top and bottom calculation, standard deviation and divergences.
Color legend:
Green: RSI Above MA and Rising
Light Green: RSI Above MA and Falling
Red: RSI Below MA and Falling
Light Red: RSI Below MA and Rising
Blue: RSI Crossover MA
Orange: RSI Crossunder MA
Blue Arrow: Bullish Divergence
Orange Arrow: Bearish Divergence
Divergence Scaner 3D Dynamic_tHello MY friend
divergence scanner 3D dynamic
It is a dynamic 3D scanner for identifying positive and negative divergences in 10 indicators.
This indicator can identify the types of Regular_Hidden_Exaggerated divergences for bullish and bearish states in the following indicators.
(MACD_L, MACD_H, RSI, Stochastic, Volume, CCI, MFI, Momentum, OBV, ADX)
This indicator is able to identify the mentioned divergences in the desired price source and in the desired settings for each indicator.
This can be done in up to 3 scans with different sensitivities at the same time. Therefore, the chances of identifying different price points are increased.
Also, the price point for each scan is determined and drawn separately.
This is a dynamic indicator.
That is, the divergence is not misdiagnosed at any moment, and it expresses the presence or absence of divergence for each indicator, and at the first moment of divergence in each sweep, it informs the user of its existence. And if the divergence disappears at the first instant, the label text is corrected.
That is why we say it is dynamic.
This indicator can calculate and identify the divergence with the percentage of allowed deviation both in the price and in the indicator if the user needs.
This indicator has an alert function to inform about the formation of divergence in one scan with desired settings for all divergence modes and for all 10 indicators.
This indicator can label the last 5 divergences for positive and negative divergences and for all three scans. Also display the Fibonacci level for the last divergence.
According to your needs, you can activate only a number of scans that you want or activate only a number of indicators that you want.
The logic of calculation and identification of divergence in the indicator:
As you know, divergences are more valid if they occur between two consecutive peaks and valleys.
In this indicator, three scans are considered, and the user can identify tiny and small pivots according to his needs and strategy by entering different degrees of sensitivity for each scan.
The indicator identifies the desired divergences for 2 consecutive valleys and 2 consecutive peaks in each scan separately and displays them to the user.
Important note:
This indicator is not limited to identifying the indicator points only in line with the price points, that is, the price points and the indicator may not be in the same line.
The higher the sensitivity of your scan, the smaller waves will be detected, and the lower the selection number, the larger waves will be detected.
By enabling pints you can see detected pivots and also by enabling Fibonacci you can see the value of the Fibonacci number for the last detected divergence.
You can see the deviations with the allowed deviation rate if needed and You can also get midpoint error and midline error.(More details are given in the clip.)
This indicator can be customized according to your needs and will identify the divergences of your choice for active scans.
For better display in label printing, the indicator tries to print the output of all active scans in one label, provided that the label printing location is the same.
Note that divergence label printing is done only with the lowest and highest price.
However, drawing the divergence line and printing the point labels depends on the price source you select in each scan.
You can see the scan number written in front of the marker name on the printed label to identify which scan this divergence is for.
Also, before the name of the indicator, an abbreviation related to the type of divergence is also written so that you can understand the type of divergence. For example, H stands for HD divergence.
It is better to consider a color for each scan so that it remains easily in your mind and you can easily recognize the points of each scan.
It is better to adjust the detection sensitivity in scans so that small and large spots are detected simultaneously to increase the performance of the marker.
last word :
Due to the capability of three simultaneous scans as well as dynamics at any moment, we think that the error in detecting the divergence in this indicator is below 1% and also the error in finding the divergence is below 3%. Also, the chances of identifying different price points are increased.
This can be said. It is a very good implementation. You can experience it in back test and forward test.
I tried to show you the full explanation with details in the form of a few clips. You can refer to my YouTube channel for a better introduction of the indicator and to know how to set the settings correctly.
Be careful to experience better execution speed ,Run the indicator when the market is open.
thank you

RSI AcceleratorThe Relative Strength Index (RSI) is like a fitness tracker for the underlying time series. It measures how overbought or oversold an asset is, which is kinda like saying how tired or energized it is.
When the RSI goes too high, it suggests the asset might be tired and due for a rest, so it could be a sign it's gonna drop. On the flip side, when the RSI goes too low, it's like the asset is pumped up and ready to go, so it might be a sign it's gonna bounce back up. Basically, it helps traders figure out if a stock is worn out or revved up, which can be handy for making decisions about buying or selling.
The RSI Accelerator takes the difference between a short-term RSI(5) and a longer-term RSI(14) to detect short-term movements. When the short-term RSI rises more than the long-term RSI, it typically refers to a short-term upside acceleration.
The conditions of the signals through the RSI Accelerator are as follows:
* A bullish signal is generated whenever the Accelerator surpasses -20 after having been below it.
* A bearish signal is generated whenever the Accelerator breaks 20 after having been above it.

Divergence Detector [TradingFinder] RSI + MACD + AO Oscillator 🔵 Introduction
🟣 Understanding Divergence
As mentioned, divergence occurs in technical analysis when a stock's price behaves contrary to indicators on the price chart. Divergence can signify either a reversal of the stock's trend or a continuation of the previous trend correction.
Divergences can act as reversal patterns or continuation patterns. Moreover, divergences can be utilized to identify potential support and resistance levels.
For instance, when an indicator is trending upwards and positive, but the price is declining and trending downwards, divergence occurs. Divergence in a stock indicates trader indecision in buying and selling and warns traders to reconsider their decisions regarding buying or holding the stock.
Divergence aids analysts in identifying critical price points. In indicator divergences, it serves as a potent signal in the realm of technical analysis.
🟣 Types of Divergence
1.Regular Divergence
o Positive Regular Divergence (RD+)
o Negative Regular Divergence (RD-)
2.Hidden Divergence
o Positive Hidden Divergence (HD+)
o Negative Hidden Divergence (HD-)
3.Time Divergence
Key Note : This indicator is specifically designed to identify "Regular Divergence" only. Therefore, the following explanation pertains to this type of divergence.
🔵 Regular Divergence/Convergence
Regular Divergence(Convergence) occurs due to conflicting behavior between the indicator and the price chart, typically at the end of a trend. Recognizing Regular Divergence suggests an anticipation of a trend reversal or a pattern resembling a reversal.
🟣 Positive Regular Divergence (RD+)
In contrast to negative divergence, positive Regular Divergence occurs at the end of a downtrend and between two price lows. It manifests when the price forms a new low on the price chart, but the indicator fails to recognize it.
Positive Regular Divergence indicates strong buying pressure and weak selling pressure. Following the identification of positive divergence on the chart, one can anticipate a price increase for the examined stock.
🟣 Negative Regular Divergence (RD-)
This type of Regular Divergence emerges between two price highs during an uptrend. A new high is formed on the price chart, but the indicator fails to acknowledge it. This scenario indicates negative Regular Divergence.
The likelihood of a subsequent market downturn is high. Negative divergence signifies strong selling pressure and weak buying pressure, suggesting an unfavorable future for the stock.
🔵 How to use
By utilizing the "Fractal Period" input, you can specify your desired periods for identifying divergences.
Additionally, through the "Divergence Detect Method" feature, you can choose which oscillators (MACD, RSI, or AO) to base divergence identification on.
Divergence in MACD Oscillator :
Divergence in the MACD indicator occurs when the price chart and the MACD line form a noticeable opposing pattern, meaning the price moves contrary to the MACD line. In this scenario, one expects a reversal in price direction.
Divergence in RSI Oscillator :
If divergence occurs during a downtrend on the price chart (two consecutive lows, with the second low being lower) and on the corresponding RSI point (two consecutive lows, with the second low being higher), it signifies positive Regular Divergence and implies a buying signal.
Conversely, if divergence occurs during an uptrend on the price chart (two consecutive highs, with the second high being higher) and on the corresponding RSI point (two consecutive highs, with the second high being lower), it indicates negative Regular Divergence, signaling a selling opportunity.
Divergence in AO Oscillator :
The AO indicator calculates histograms similar to the AO base. It calculates the difference between the simple moving averages of 5 and 34 periods based on the median of each bar. Then, it plots the bars based on the difference.
It then compares the histograms to detect peaks and troughs in the AO histograms and compares the identified peaks and troughs to the price. Whenever divergence is detected, it plots lines and arrows.
🔵 Table
The table contains information on the functional features of this oscillator that you can utilize. Four categories of information are presented in the table: "Exist," "Consecutive," "Divergence Quality," and "Change Phase Indicator."
Exist :
If divergence exists, you'll see "+" in this row.
Consecutive :
Divergences may occur consecutively. If same-type divergences form within short intervals, you can observe the count in this row.
Divergence Quality : Based on the number of consecutive divergences, their quality can be evaluated. If one divergence exists, its quality is considered "Normal." If two divergences exist, the quality is "Good," and if three or more divergences exist, the quality is considered "Strong."
Change Phase Indicator : If a phase change occurs between two oscillation peaks formed based on divergence, this change is identified and displayed in this row.

Multi-Spectral RSI Deviations [AlgoAlpha]🌌 Multi-Spectral RSI Deviations by AlgoAlpha - Dive into Market Dynamics! 🌠
Dive deep into the essence of market trends with our 🚀 Multi-Spectral RSI Deviations indicator, a comprehensive tool designed by AlgoAlpha to enhance your trading strategy. By harnessing the power of multiple RSI lengths and innovative smoothing techniques, this indicator offers a unique perspective on market momentum and potential reversals.
🔍 Key Features:
🎨 Customizable up and down colors for immediate trend recognition.
🔢 Three RSI lengths for multi-layered market analysis.
🔄 Various Moving Average (MA) types including SMA, EMA, and more for tailored smoothing.
✅ Bullish and Bearish divergence plotting for spotting potential reversals.
🕵️♂️ Adjustable divergence sensitivity settings to fine-tune signal detection.
🔔 Built-in alerts for trend shifts and reversal conditions, ensuring you never miss a trading opportunity.
🚀 Quick Guide to Using the Multi-Spectral RSI Deviations Indicator
🛠 Add the Indicator: Search for "Multi-Spectral RSI Deviations" in TradingView's Indicators & Strategies. Adjust the RSI lengths and MA settings to suit your trading strategy.
🔍 Market Analysis: Keep an eye on the color changes for trend direction and use divergence plots to anticipate potential market reversals.
🔔 Alerts Setup: Activate the built-in alerts for trend shifts and reversals to stay ahead of the game without having to constantly monitor the charts.
🧠 How It Works:
At the core of the Multi-Spectral RSI Deviations indicator is its ability to analyze the market through various RSI lengths, providing a comprehensive view of momentum. The indicator calculates the Relative Strength Index (RSI) over three different periods, creating a spectrum of momentum insights. These RSI values are then compared to each other to identify the momentum shifts within the market.
To refine these insights, the differences between these RSI values are smoothed using a selected Moving Average type, such as SMA, EMA, etc., based on user preference. This smoothing process helps in highlighting the overall trend direction and potential reversal points with greater clarity.
Furthermore, the indicator employs a color-coding system, where the plotted line changes color based on the momentum's direction—shifting to an up color for positive momentum and a down color for negative momentum. This visual cue enables traders to quickly discern the market trend at a glance.
Divergences between the price action and the indicator's values are another cornerstone of this tool. By plotting potential bullish and bearish divergences, the indicator provides early signals of possible trend reversals, offering traders a strategic advantage.
Embrace the power of our 🌌 Multi-Spectral RSI Deviations and elevate your trading to stellar heights! 🌠✨

Wiseball RSI Super Advanced Divergences | EssentialThis indicator is a cutting-edge tool designed to elevate your trading strategy by identifying both regular and hidden RSI divergences with unparalleled precision. Moreover, this indicator uniquely offers the capability to visualize divergences as they are forming ("anticipated"), a feature that stands out for its originality and innovation.
Unique Features and How They Work:
This tool distinguishes itself by leveraging its Divergences Detection System (DDS), which incorporates advanced algorithms to analyze market movements and oscillator behavior beyond the capabilities of existing open-source scripts. Here's a brief overview of what makes DDS uniquely effective:
Anticipated and Projected Divergences: DDS goes beyond mere detection of existing divergences. It offers insights into divergences that are currently forming and even projects potential future divergences by analyzing current trends and oscillator levels. This forward-looking feature empowers traders to anticipate market movements, offering a strategic advantage.
Comprehensive Pivot Analysis: Unlike typical divergence indicators, such as the "RSI Divergence Indicator," which only identifies divergences between two consecutive pivots, DDS is engineered to analyze as many previous pivots as the user's configuration allows (duration min/max). This capability ensures that no potential trend or extended divergence is overlooked, providing a more thorough market analysis.
Multiple Divergences Detection: Our system is capable of detecting multiple divergences within the same timeframe. For instance, it can identify a significant bearish divergence alongside a minor bullish divergence, offering a nuanced view of market dynamics that other indicators might miss.
Extensive Customization Options: DDS provides an array of configuration settings, allowing traders to tailor the detection system to their specific needs. Whether adjusting for sensitivity, timeframes, or specific divergence types, these customization options ensure that the tool can adapt to various trading strategies and preferences.
Our commitment to continuous development means that we regularly update the script based on user feedback, ensuring that it remains at the forefront of trading technology.
How to Use This Script:
Setup: Search for "Wiseball RSI Super Advanced Divergences" in the TradingView indicator library. Easily add the script to your TradingView chart and adjust the settings according to your trading preferences.
Analysis: The script automatically identifies divergences and highlights them on your chart, using color-coded lines and patterns for easy interpretation.
Action: Customize alerts to notify you of new divergences, enabling timely trading decisions based on the script's analysis.
Note: This indicator is best used on a dark background, as it has been optimized for this.
Divergence Style Coding:
Bullish Regular Divergence: Green
Bullish Hidden Divergence: Blue
Bearish Regular Divergence: Red
Bearish Hidden Divergence: Orange
Confirmed Divergence: Solid opaque line
Anticipated Divergence: Dotted line in the type's color
Projected Divergence: Dashed line in the type's color
Understand Technical and practical limitations:
This indicator is designed to facilitate ease of use, correspond to standard practices, and cover your essential needs. DDS options are limited to the essentials for simplicity and ease of use. Moreover, these limitations allow for reduced calculation time and a smooth display.
It is limited to displaying 100 divergences, and the number of bars analyzed is fixed at 960. Use the replay mode to view past divergences.
Divergences sharing the same endpoint are limited to the divergence with the longest duration.
Divergences of the same type that cross or share the same time space are filtered to display only one.
The maximum duration of divergences is set to 120 bars.
Anticipated divergences but not projected ones.
Note: As with all trading tools, it's crucial to use this indicator in conjunction with other indicators and fundamental analysis to validate your trading decisions. Our tools are designed to provide you with valuable insights, not to predict the future. Always conduct your research and trade responsibly.

Divergence Signal [TradingFinder] RSI & MACD Reversal On Swing🔵 Introduction
Sometimes in analyzing price charts using indicators, you may observe a discrepancy. For instance, while the price of stocks, currencies, or commodities is increasing, the indicator shows a decrease. Such a phenomenon in technical analysis is termed "divergence." Divergences are categorized into three types based on their formation and the prediction they make about the continuation of the price trend: "Regular Divergence," "Hidden Divergence," and "Time Divergence."
🟣 Important :
• This indicator exclusively identifies regular divergences since its primary function is to detect reversal points.
• This indicator identifies divergences using three indicators: "Moving Average Convergence Divergence" (MACD), "Relative Strength Index" (RSI), and "Awesome Oscillator" (AO). The user can choose each of these indicators in the settings using the "Divergence Detection Method" dropdown menu for identifying divergences. These settings are by default set to the MACD mode.
🔵Types of Divergence
Divergences, as mentioned, offer different predictions about the continuation of price trends. Hence, they have various types. We will focus on explaining regular divergences based on this indicator.
🟣 Regular Divergence(RD) :
Regular divergence is a situation arising from contradictory behavior between the indicator and the price chart at the end of a trend. By identifying regular divergences, we anticipate a change in trend direction resembling a reversal pattern.
Regular divergence has two types based on the trend and prediction:
Negative Regular Divergence (RD-) :
This type occurs between two price peaks at the end of an uptrend. Despite forming a new high, the indicator fails to recognize it, indicating a negative regular divergence. The likelihood of a subsequent downtrend is high. Negative divergence suggests strong selling pressure and weak buying power, portraying an unfavorable future for the stock.
Positive Regular Divergence (RD+) :
In contrast, positive regular divergence happens at the end of a downtrend and between two price troughs. As depicted in the chart, although the price forms a new low, the indicator doesn't acknowledge it. Positive regular divergence indicates robust buying pressure and weak selling power. Upon identifying positive divergence in the chart, we expect a price increase for the stock under review
🔵 How to Use
Information from the indicator is displayed in two ways: Table and Label.
🟣 Table : The table displays information about the latest divergence. This includes the type of divergence, existence or absence of divergence, consecutive divergences, divergence quality, and change in indicator phase.
Type Divergence : Indicates the type of divergence, which can be either "Bullish Divergence" or "Bearish Divergence."
Exist : Indicates the presence of divergence with a "+" sign and absence with a "-" sign. A green color is used for bullish divergence and red for bearish divergence.
Consecutive : Shows the number of consecutive divergences. For example, if there are 3 consecutive divergences, the number 3 is displayed.
Divergence Quality : Displays the quality of the divergence based on the number of consecutive divergences. If there is 1 divergence, the quality is "Normal"; for 2 divergences, it's "Good"; and for 3 or more divergences, it's "Strong."
Change Phase Indicator : Indicates whether a phase change in the indicator has occurred with "+" for yes and "-" for no.
🟣 Label : Unlike the table, which only shows information about the latest divergence, labels display information about each divergence at the point where it occurs. The information includes the type of divergence, detection method, divergence quality, consecutive divergences, and change in phase indicator. The selected method of detection is also displayed. For example, if the chosen method is the "AO" indicator, the label will show "Method: AO."
🔵 Settings
Fractal Period : Determines the period of swings. The minimum and default value is 2.
Divergence Detect Method : Selects the indicator (MACD, RSI, or AO) used for detecting divergences. The default indicator is MACD.
Show Fractal : Chooses whether to display fractals or not. The default is "No."
Show Table : Determines whether to display the table or not. The default is "Yes."
Show Label : Chooses whether to display labels or not. The default is "Yes."
Label Size : Adjusts the size of the labels from "Tiny" to "Large."

Economic Growth Index (XLY/XLP)Keeping an eye on the macroeconomic environment is an essential part of a successful investing and trading strategy. Piecing together and analysing its complex patterns are important to detect probable changing trends. This may seem complicated, or even better left to experts and gurus, but it’s made a whole lot easier by this indicator, the Economic Growth Index (EGI).
Common sense shows that in an expanding economy, consumers have access to cash and credit in the form of disposable income, and spend it on all sorts of goods, but mainly crap they don’t need (consumer discretionary items). Companies making these goods do well in this phase of the economy, and can charge well for their products.
Conversely, in a contracting economy, disposable income and credit dry up, so demand for consumer discretionary products slows, because people have no choice but to spend what they have on essential goods. Now, companies making staple goods do well, and keep their pricing power.
These dynamics are represented in EGI, which plots the Rate of Change of the Consumer Discretionary ETF (XLY) in relation to the Consumer Staples ETF (XLP). Put simply, green is an expanding phase of the economy, and red shrinking. The signal line is the market, a smoothed RSI of the S&P500. Run this on a Daily timeframe or higher. Check it occasionally to see where the smart money is heading.

The Flash-Strategy with Minervini Stage Analysis QualifierThe Flash-Strategy (Momentum-RSI, EMA-crossover, ATR) with Minervini Stage Analysis Qualifier
Introduction
Welcome to a comprehensive guide on a cutting-edge trading strategy I've developed, designed for the modern trader seeking an edge in today's dynamic markets. This strategy, which I've honed through my years of experience in the trading arena, stands out for its unique blend of technical analysis and market intuition, tailored specifically for use on the TradingView platform.
As a trader with a deep passion for the financial markets, my journey began several years ago, driven by a relentless pursuit of a trading methodology that is both effective and adaptable. My background in trading spans various market conditions and asset classes, providing me with a rich tapestry of experiences from which to draw. This strategy is the culmination of that journey, embodying the lessons learned and insights gained along the way.
The cornerstone of this strategy lies in its ability to generate precise long signals in a Stage 2 uptrend and equally accurate short signals in a Stage 4 downtrend. This approach is rooted in the principles of trend following and momentum trading, harnessing the power of key indicators such as the Momentum-RSI, EMA Crossover, and Average True Range (ATR). What sets this strategy apart is its meticulous design, which allows it to adapt to the ever-changing market conditions, providing traders with a robust tool for navigating both bullish and bearish scenarios.
This strategy was born out of a desire to create a trading system that is not only highly effective in identifying potential trade setups but also straightforward enough to be implemented by traders of varying skill levels. It's a reflection of my belief that successful trading hinges on clarity, precision, and disciplined execution. Whether you are a seasoned trader or just beginning your journey, this guide aims to provide you with a comprehensive understanding of how to harness the full potential of this strategy in your trading endeavors.
In the following sections, we will delve deeper into the mechanics of the strategy, its implementation, and how to make the most out of its features. Join me as we explore the nuances of a strategy that is designed to elevate your trading to the next level.
Stage-Specific Signal Generation
A distinctive feature of this trading strategy is its focus on generating long signals exclusively during Stage 2 uptrends and short signals during Stage 4 downtrends. This approach is based on the widely recognized market cycle theory, which divides the market into four stages: Stage 1 (accumulation), Stage 2 (uptrend), Stage 3 (distribution), and Stage 4 (downtrend). By aligning the signal generation with these specific stages, the strategy aims to capitalize on the most dynamic and clear-cut market movements, thereby enhancing the potential for profitable trades.
1. Long Signals in Stage 2 Uptrends
• Characteristics of Stage 2: Stage 2 is characterized by a strong uptrend, where prices are consistently rising. This stage typically follows a period of accumulation (Stage 1) and is marked by increased investor interest and bullish sentiment in the market.
• Criteria for Long Signal Generation: Long signals are generated during this stage when the technical indicators align with the characteristics of a Stage 2 uptrend.
• Rationale for Stage-Specific Signals: By focusing on Stage 2 for long trades, the strategy seeks to enter positions during the phase of strong upward momentum, thus riding the wave of rising prices and investor optimism. This stage-specific approach minimizes exposure to less predictable market phases, like the consolidation in Stage 1 or the indecision in Stage 3.
2. Short Signals in Stage 4 Downtrends
• Characteristics of Stage 4: Stage 4 is identified by a pronounced downtrend, with declining prices indicating prevailing bearish sentiment. This stage typically follows the distribution phase (Stage 3) and is characterized by increasing selling pressure.
• Criteria for Short Signal Generation: Short signals are generated in this stage when the indicators reflect a strong bearish trend.
• Rationale for Stage-Specific Signals: Targeting Stage 4 for shorting capitalizes on the market's downward momentum. This tactic aligns with the natural market cycle, allowing traders to exploit the downward price movements effectively. By doing so, the strategy avoids the potential pitfalls of shorting during the early or late stages of the market cycle, where trends are less defined and more susceptible to reversals.
In conclusion, the strategy’s emphasis on stage-specific signal generation is a testament to its sophisticated understanding of market dynamics. By tailoring the long and short signals to Stages 2 and 4, respectively, it leverages the most compelling phases of the market cycle, offering traders a clear and structured approach to aligning their trades with dominant market trends.
Strategy Overview
At the heart of this trading strategy is a philosophy centered around capturing market momentum and trend efficiency. The core objective is to identify and capitalize on clear uptrends and downtrends, thereby allowing traders to position themselves in sync with the market's prevailing direction. This approach is grounded in the belief that aligning trades with these dominant market forces can lead to more consistent and profitable outcomes.
The strategy is built on three foundational components, each playing a critical role in the decision-making process:
1. Momentum-RSI (Relative Strength Index): The Momentum-RSI is a pivotal element of this strategy. It's an enhanced version of the traditional RSI, fine-tuned to better capture the strength and velocity of market trends. By measuring the speed and change of price movements, the Momentum-RSI provides invaluable insights into whether a market is potentially overbought or oversold, suggesting possible entry and exit points. This indicator is especially effective in filtering out noise and focusing on substantial market moves.
2. EMA (Exponential Moving Average) Crossover: The EMA Crossover is a crucial component for trend identification. This strategy employs two EMAs with different timeframes to determine the market trend. When the shorter-term EMA crosses above the longer-term EMA, it signals an emerging uptrend, suggesting a potential long entry. Conversely, a crossover below indicates a possible downtrend, hinting at a short entry opportunity. This simple yet powerful tool is key in confirming trend directions and timing market entries.
3. ATR (Average True Range): The ATR is instrumental in assessing market volatility. This indicator helps in understanding the average range of price movements over a given period, thus providing a sense of how much a market might move on a typical day. In this strategy, the ATR is used to adjust stop-loss levels and to gauge the potential risk and reward of trades. It allows for more informed decisions by aligning trade management techniques with the current volatility conditions.
The synergy of these three components – the Momentum-RSI, EMA Crossover, and ATR – creates a robust framework for this trading strategy. By combining momentum analysis, trend identification, and volatility assessment, the strategy offers a comprehensive approach to navigating the markets. Whether it's capturing a strong trend in its early stages or identifying a potential reversal, this strategy aims to provide traders with the tools and insights needed to make well-informed, strategically sound trading decisions.
Detailed Component Analysis
The efficacy of this trading strategy hinges on the synergistic functioning of its three key components: the Momentum-RSI, EMA Crossover, and Average True Range (ATR). Each component brings a unique perspective to the strategy, contributing to a well-rounded approach to market analysis.
1. Momentum-RSI (Relative Strength Index)
• Definition and Function: The Momentum-RSI is a modified version of the classic Relative Strength Index. While the traditional RSI measures the velocity and magnitude of directional price movements, the Momentum-RSI amplifies aspects that reflect trend strength and momentum.
• Significance in Identifying Trend Strength: This indicator excels in identifying the strength behind a market's move. A high Momentum-RSI value typically indicates strong bullish momentum, suggesting the potential continuation of an uptrend. Conversely, a low Momentum-RSI value signals strong bearish momentum, possibly indicative of an ongoing downtrend.
• Application in Strategy: In this strategy, the Momentum-RSI is used to gauge the underlying strength of market trends. It helps in filtering out minor fluctuations and focusing on significant movements, providing a clearer picture of the market's true momentum.
2. EMA (Exponential Moving Average) Crossover
• Definition and Function: The EMA Crossover component utilizes two exponential moving averages of different timeframes. Unlike simple moving averages, EMAs give more weight to recent prices, making them more responsive to new information.
• Contribution to Market Direction: The interaction between the short-term and long-term EMAs is key to determining market direction. A crossover of the shorter EMA above the longer EMA is an indicator of an emerging uptrend, while a crossover below signals a developing downtrend.
• Application in Strategy: The EMA Crossover serves as a trend confirmation tool. It provides a clear, visual representation of the market's direction, aiding in the decision-making process for entering long or short positions. This component ensures that trades are aligned with the prevailing market trend, a crucial factor for the success of the strategy.
3. ATR (Average True Range)
• Definition and Function: The ATR is an indicator that measures market volatility by calculating the average range between the high and low prices over a specified period.
• Role in Assessing Market Volatility: The ATR provides insights into the typical market movement within a given timeframe, offering a measure of the market's volatility. Higher ATR values indicate increased volatility, while lower values suggest a calmer market environment.
• Application in Strategy: Within this strategy, the ATR is instrumental in tailoring risk management techniques, particularly in setting stop-loss levels. By accounting for the market's volatility, the ATR ensures that stop-loss orders are placed at levels that are neither too tight (risking premature exits) nor too loose (exposing to excessive risk).
In summary, the combination of Momentum-RSI, EMA Crossover, and ATR in this trading strategy provides a comprehensive toolkit for market analysis. The Momentum-RSI identifies the strength of market trends, the EMA Crossover confirms the market direction, and the ATR guides in risk management by assessing volatility. Together, these components form the backbone of a strategy designed to navigate the complexities of the financial markets effectively.
1. Signal Generation Process
• Combining Indicators: The strategy operates by synthesizing signals from the Momentum-RSI, EMA Crossover, and ATR indicators. Each indicator serves a specific purpose: the Momentum-RSI gauges trend momentum, the EMA Crossover identifies the trend direction, and the ATR assesses the market’s volatility.
• Criteria for Signal Validation: For a signal to be considered valid, it must meet specific criteria set by each of the three indicators. This multi-layered approach ensures that signals are not only based on one aspect of market behavior but are a result of a comprehensive analysis.
2. Conditions for Long Positions
• Uptrend Confirmation: A long position signal is generated when the shorter-term EMA crosses above the longer-term EMA, indicating an uptrend.
• Momentum-RSI Alignment: Alongside the EMA crossover, the Momentum-RSI should indicate strong bullish momentum. This is typically represented by the Momentum-RSI being at a high level, confirming the strength of the uptrend.
• ATR Consideration: The ATR is used to fine-tune the entry point and set an appropriate stop-loss level. In a low volatility scenario, as indicated by the ATR, the stop-loss can be set tighter, closer to the entry point.
3. Conditions for Short Positions
• Downtrend Confirmation: Conversely, a short position signal is indicated when the shorter-term EMA crosses below the longer-term EMA, signaling a downtrend.
• Momentum-RSI Confirmation: The Momentum-RSI should reflect strong bearish momentum, usually seen when the Momentum-RSI is at a low level. This confirms the bearish strength of the market.
• ATR Application: The ATR again plays a role in determining the stop-loss level for the short position. Higher volatility, as indicated by a higher ATR, would warrant a wider stop-loss to accommodate larger market swings.
By adhering to these mechanics, the strategy aims to ensure that each trade is entered with a high probability of success, aligning with the market’s current momentum and trend. The integration of these indicators allows for a holistic market analysis, providing traders with clear and actionable signals for both entering and exiting trades.
Customizable Parameters in the Strategy
Flexibility and adaptability are key features of this trading strategy, achieved through a range of customizable parameters. These parameters allow traders to tailor the strategy to their individual trading style, risk tolerance, and specific market conditions. By adjusting these parameters, users can fine-tune the strategy to optimize its performance and align it with their unique trading objectives. Below are the primary parameters that can be customized within the strategy:
1. Momentum-RSI Settings
• Period: The lookback period for the Momentum-RSI can be adjusted. A shorter period makes the indicator more sensitive to recent price changes, while a longer period smoothens the RSI line, offering a broader view of the momentum.
• Overbought/Oversold Thresholds: Users can set their own overbought and oversold levels, which can help in identifying extreme market conditions more precisely according to their trading approach.
2. EMA Crossover Settings
• Timeframes for EMAs: The strategy uses two EMAs with different timeframes. Traders can modify these timeframes, choosing shorter periods for a more responsive approach or longer periods for a more conservative one.
• Source Data: The choice of price data (close, open, high, low) used in calculating the EMAs can be varied depending on the trader’s preference.
3. ATR Settings
• Lookback Period: Adjusting the lookback period for the ATR impacts how the indicator measures volatility. A longer period may provide a more stable but less responsive measure, while a shorter period offers quicker but potentially more erratic readings.
• Multiplier for Stop-Loss Calculation: This parameter allows traders to set how aggressively or conservatively they want their stop-loss to be in relation to the ATR value.
Here are the standard settings:

Confluence Buy-Sell Indicator with Fibonacci The script is a "Confluence Indicator with Fibonacci" designed to work on the TradingView platform. This indicator combines multiple technical analysis strategies to generate buy and sell signals based on user-defined confluence criteria. Here's a breakdown of its features:
Confluence Criteria: Users can enable or disable various strategies like MACD, RSI, Bollinger Bands, Divergence, Fibonacci, and Moving Average. The number of strategies that need to align for a signal to be generated can be set by the user.
Strategies Included:
MACD Strategy: Uses the Moving Average Convergence Divergence method to identify buy/sell opportunities.
RSI Strategy: Utilizes the Relative Strength Index to detect overbought or oversold conditions.
Bollinger Bands Strategy: Incorporates Bollinger Bands to identify volatility and potential buy/sell signals.
Divergence Strategy: A basic implementation that detects bullish and bearish divergences using the RSI.
Fibonacci Strategy: Uses Fibonacci retracement levels to determine potential support and resistance levels.
Moving Average Strategy: Employs a crossover system between the 50-period and 200-period simple moving averages.
Additional Features:
Support & Resistance: Identifies major support and resistance levels from the last 50 bars.
Pivot Points: Calculates pivot points to determine potential turning points.
Stop Loss Levels: Automatically calculates and plots stop-loss levels for buy and sell signals.
NYC Midnight Level: Option to display the New York City midnight price level.
Visualization: Plots buy and sell signals on the chart with green and red markers respectively.
Adequate Category:
"Technical Analysis Indicators & Overlays" or "Strategy & Scripting Tools".

RSI Box Strategy (pseudo- Grid Bot)This is a strategy intended primarily for algorithmic traders. It's a pseudo-grid bot that uses a dynamic, volume-weighted grid that only updates when the RSI meets certain conditions. It's also a breakout strategy, whereas normal grid bots are not (typical grid bots sell when a higher grid is reached, whereas this strategy sells when a lower grid is breached under specific conditions). This strategy also sells 100% of pyramiding orders on close.
In a nutshell, the strategy updates its grid to the volume-weighted highest/lowest values of your given source ("src" in the settings) each time that there is a RSI crossunder/crossover. From this range it produces an evenly-spaced grid of five lines, and uses the current source to determine which grid line is closest to the source. Then, if the source crosses over the line directly above the current line, it enters a buy order. If the source crosses under the line directly below the current line, it enters a sell order.
You can configure shorts, source, RSI length, and overbought/oversold levels in the settings.
For the strategy results below: fees are at 0.1% per trade, with order size 1% of equity and a max pyramiding value of 33. For a greater R/R profile, you can increase the order size, which will increase drawdown but potentially yield better results.

Volume-Weighted RSI [wbburgin]The Volume-Weighted RSI takes a new approach to the traditional calculation of the RSI in using a price::volume calculation. As some traders consider volume to be a leading indicator for price, the volume-weighted RSI can come in handy if you want to visualize volume easier.
Usage
This indicator builds the RSI from the square of the volume change and the price. If the volume decreases rapidly with the price, the volume-weighted RSI will fall; if the volume increases rapidly with the price, the volume-weighted RSI will rise.
You may notice crosses and circles appearing above and below the indicator. These indicate abnormal volume or price:
A green cross indicates abnormal upward price
A red cross indicates abnormal downward price
A green circle indicates abnormal positive volume
A red circle indicates abnormal negative volume
A green bar indicates both abnormal price and volume (positive), while a red bar indicates both abnormal price and volume (negative).
The thresholds of what are considered "normal" and "abnormal" are controlled by the "SD Multiple" in your settings (standard deviation). A higher multiple will make less of these signals occur, and you can turn them and the bars off at any time.
I have a built-in Light Style and Dark Style so that your preference of background won't affect seeing the indicator. You can also change the colors and the overbought/oversold lines in your settings.

Bollinger RSI BandsIndicator Description:
The "Bollinger RSI Bands" is an advanced technical analysis tool designed to empower traders with comprehensive insights into market trends, reversals, and overbought/oversold conditions. This multifaceted indicator combines the unique features of candle coloration and Bollinger Bands with the Relative Strength Index (RSI), making it an indispensable tool for traders seeking to optimize their trading strategies.
Purpose:
The primary purpose of the "Bollinger RSI Bands" indicator is to provide traders with a holistic view of market dynamics by offering the following key functionalities:
Candle Coloration: The indicator's signature candle colors - green for bullish and red for bearish - serve as a visual representation of the prevailing market trend, enabling traders to quickly identify and confirm market direction.
RSI-Based Moving Average: A smoothed RSI-based moving average is plotted, facilitating the detection of trend changes and potential reversal points with greater clarity.
RSI Bands: Upper and lower RSI bands, set at 70 and 30, respectively, help traders pinpoint overbought and oversold conditions, aiding in timely entry and exit decisions.
Bollinger Bands: In addition to RSI bands, Bollinger Bands are overlaid on the RSI-based moving average, offering insights into price volatility and highlighting potential breakout opportunities.
How to Use:
To maximize the utility of the "Bollinger RSI Bands" indicator, traders can follow these essential steps:
Candle Color Confirmation: Assess the color of the candles. Green candles signify a bullish trend, while red candles indicate a bearish trend, providing a clear and intuitive visual confirmation of market direction.
Overbought and Oversold Identification: Monitor price levels relative to the upper RSI band (70) for potential overbought signals and below the lower RSI band (30) for potential oversold signals, allowing for timely adjustments to trading positions.
Trend Reversal Recognition: Observe changes in the direction of the RSI-based moving average. A transition from bearish to bullish, or vice versa, can serve as a valuable signal for potential trend reversals.
Volatility and Breakout Opportunities: Keep a watchful eye on the Bollinger Bands. Expanding bands signify increased price volatility, often signaling forthcoming breakout opportunities.
Why Use It:
The "Bollinger RSI Bands" indicator offers traders several compelling reasons to incorporate it into their trading strategies:
Clear Trend Confirmation: The indicator's distinct candle colors provide traders with immediate confirmation of the current trend direction, simplifying trend-following strategies.
Precise Entry and Exit Points: By identifying overbought and oversold conditions, traders can make more precise entries and exits, optimizing their risk-reward ratios.
Timely Trend Reversal Signals: Recognizing shifts in the RSI-based moving average direction allows traders to anticipate potential trend reversals and adapt their strategies accordingly.
Volatility Insights: Bollinger Bands offer valuable insights into price volatility, aiding in the identification of potential breakout opportunities.
User-Friendly and Versatile: Despite its advanced features, the indicator remains user-friendly and versatile, catering to traders of all experience levels.
In summary, the "Bollinger RSI Bands" indicator is an indispensable tool for traders seeking a comprehensive view of market dynamics. With its unique combination of candle coloration and Bollinger Bands, it empowers traders to make more informed and strategic trading decisions, ultimately enhancing their trading outcomes.
Note: Always utilize this indicator in conjunction with other technical and fundamental analysis tools and exercise prudence in your trading decisions. Past performance is not indicative of future results.

Heuristic Bg Color Hodl/swing/scalp [Ox_kali]The "Heuristic BG Color Hodl/Swing/Scalp " is a multi-faceted technical indicator designed to aid traders across varying investment strategies such as long-term holding (Hodl), swing trading, and scalping. Optimized to run on a range of timeframes from seconds to months. Built upon an intricate layering of moving averages, market oscillators. The indicator displays a color range from light green to deep red, based on market conditions. This tool aims to provide an analytical edge by visualizing market conditions in a straightforward manner. Incorporating both trend-following and oscillatory components both trend-following and oscillating components to furnish a more rounded view of the market. Note that this indicator is best used in conjunction with other forms of market analysis and should not be solely relied upon for making trading decisions.
Key Features:
Multiple Moving Averages: Utilizes Fast and Slow MAs to identify trend momentum.
Modified RSI and MFI: Incorporates RSI and MFI to gauge overbought and oversold conditions.
Stoch RSI Indicator: Used to provide additional confirmation for trading signals.
Dynamic Background Color: Highlights potential Buy and Sell zones using background color for easier visual interpretation.
Alert Conditions: Trigger customizable alerts for Buy and Sell zones.
Functionality Analysis:
The script allows you to select the type and period for Fast and Slow moving averages. It uses these MAs to calculate an underlying trend momentum, further refined by a user-defined MA.
The RSI and MFI are used to identify overbought and oversold conditions calculated and smoothed over a user-defined period. The Stoch RSI gives an additional layer of confirmation, allowing traders to identify more reliable trading signals.
The script's main visual feature is the background color, which changes based on potential Buy and Sell zones. It provides two layers for each, enabling traders to understand the strength of the signal. Notably, the indicator is particularly optimized for identifying Buy Zones and is more functional for detecting Sell Zones when applied to larger timeframes.
Trading Application:
The "Heuristic BG Color Hodl/Swing/Scalp" indicator can adapt to various trading styles, from long-term investment to short-term trading. When the background turns green, it signifies a potential Buy Zone, ideal for entering long positions. Conversely, a red background indicates a Sell Zone, suggesting it may be a good time to exit positions or go short.
Traders can also utilize the alert conditions set within the script to receive real-time notifications, making it easier to capitalize on potential market opportunities.
Please note that the "Heuristic BG Color Hodl/Swing/Scalp" by Ox_kali is intended for educational purposes only and does not constitute financial advice. This indicator is not a guarantee of future market performance and should be used alongside proper risk management strategies. Ensure you fully understand the methodology and limitations of this indicator before making any trading decisions. Past performance is not indicative of future results.

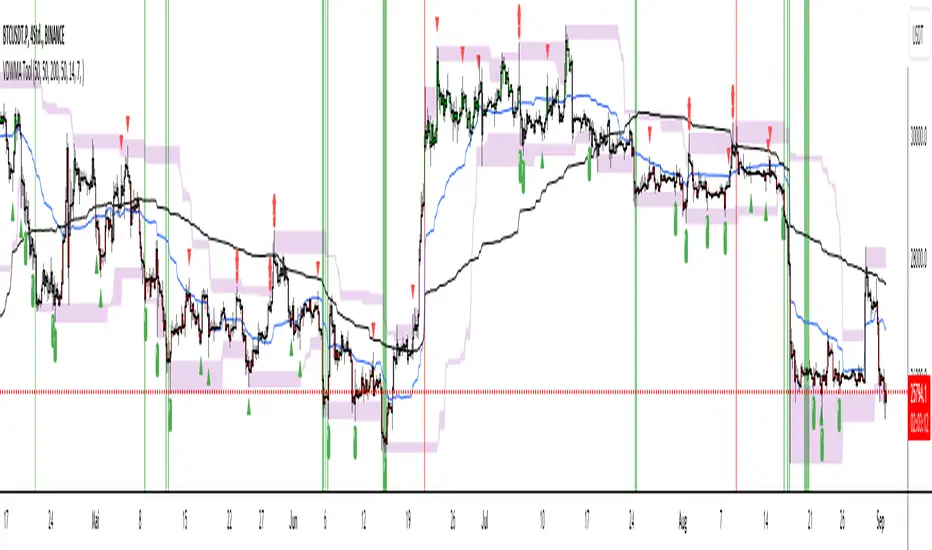
Trade Tool VDWMA + OI RSI BasedThis indicator works only for symbols where open interest data is available.
The idea was to create a combination of Volume Delta, Open Interest, RSI, Moving Average and Support / Resistance as a unified tool.
I created a Weighted Moving Average based on the Volume Delta (VDWMA). The idea behind this was to reflect the moving average on the difference between buy and sell volume.
There are two VDWMA to determine a trend. Fast and Slow. The principle is the same as with conventional moving averages. For visualization, the candles are colored based on the following logic:
up trend = Fast VDWMA is above the Slow VDWMA and the price is above the Fast VWDWMA.
down Trend = Fast VDWMA is below the Slow VDWMA and the Short is below the Fast VDWMA
Further, support and resistance zones were defined based on the close and high prices as well as close and low prices.
A simple logic looks for divergences between RSI and price to generate first signals for possible price reversals.
Another RSI was created based on the open interest.
In combination with the conventional RSI, oversold and overbought zones were defined based on the following logic, which are marked by vertical zones on the chart.
Oversold zone = RSI is below 30 and OI RSI is above 70 or below 30 and OI opening is not greater than OI closing price
Overbought zone = RSI is above 70 and OI RSI is above 70 or below 30 and OI opening is not smaller than OI closing price
Based on this, buy and sell signals were defined.
First, the support or resistance zone must remain the same for two candles, which signals that the zone has not been breached. In addition, a divergence must occur in the RSI and the price must bounce.
newsell = resistance == resistance and high >= resistance and close < resistance and bearishDiv
newbull = support == support and low <= support and close > support and bullishDiv
The OI signaling was deliberately not included as well as the trend function. The tool should be suitable for scalping as well as for swinging. Thus, depending on the tradestyle itself to decide which points you want to trade.
Have fun with it
Ultimate RSI [LuxAlgo]The Ultimate RSI indicator is a new oscillator based on the calculation of the Relative Strength Index that aims to put more emphasis on the trend, thus having a less noisy output. Opposite to the regular RSI, this oscillator is designed for a trend trading approach instead of a contrarian one.
🔶 USAGE
While returning the same information as a regular RSI, the Ultimate RSI puts more emphasis on trends, and as such can reach overbought/oversold levels faster as well as staying longer within these areas. This can avoid the common issue of an RSI regularly crossing an overbought or oversold level while the trend makes new higher highs/lower lows.
The Ultimate RSI crossing above the overbought level can be indicative of a strong uptrend (highlighted as a green area), while an Ultimate RSI crossing under the oversold level can be indicative of a strong downtrend (highlighted as a red area).
The Ultimate RSI crossing the 50 midline can also indicate trends, with the oscillator being above indicating an uptrend, else a downtrend. Unlike a regular RSI, the Ultimate RSI will cross the midline level less often, thus generating fewer whipsaw signals.
For even more timely indications users can observe the Ultimate RSI relative to its signal line. An Ultimate RSI above its signal line can indicate it is increasing, while the opposite would indicate it is decreasing.
🔹 Smoothing Methods
Users can return more reactive or smoother results depending on the selected smoothing method used for the calculation of the Ultimate RSI. Options include:
Exponential Moving Average (EMA)
Simple Moving Average (SMA)
Wilder's Moving Average (RMA)
Triangular Moving Average (TMA)
These are ranked by the degree of reactivity of each method, with higher ones being more reactive (but less smooth).
Users can also select the smoothing method used by the signal line.
🔶 DETAILS
The RSI returns a normalized exponential average of price changes in the range (0, 100), which can be simply calculated as follows:
ema(d) / ema(|d|) × 50 + 50
where d represent the price changes. In order to put more emphasis on trends we can put higher weight on d . We can perform this on the occurrence of new higher highs/lower lows, and by replacing d with the rolling range instead (the rolling period used to detect the higher highs/lower lows is equal to the length setting).
🔶 SETTINGS
Length: Calculation period of the indicator
Method: Smoothing method used for the calculation of the indicator.
Source: Input source of the indicator
🔹 Signal Line
Smooth: Degree of smoothness of the signal line
Method: Smoothing method used to calculation the signal line.

RSI + Divergences + Alerts [MisterMoTA]The indicator RSI + Divergences + Alerts by MisterMoTA is an RSI indicator that fills the RSI and RSI moving average with 4 different colors (growing up, falling up, falling down and rising down colors), users can customize colors from dashboard , also can be disabled the fill if the user want a standard RSI.
The dafault value of RSI is 14 and value of the moving average is 50 ( a dynamic 50 rsi line is better for trend identification than a standard 50 line) and users can change the values from indicator settings.
For detecting the divergences displayed in the indicator, I integrated in our script the default Divergences indicator from Tradingview, users can display, hide and change colors for regular and hidden divergences.
RSI indicator display also trend conditions for RSI and RSI MA, the RSI MA angle is calculated using ATR value, the slope of the RSI Noving Average can help to identify trend conditions too.
The script comes with 12 different alerts, if need different alerts please let me know in the comments and will update the script with your request:
Alert for Regular Bullish Divergence
Alert for Regular Bearish Divergence
Alert for Hidden Bullish Divergence
Alert for Hidden Bearish Divergence
Alert for RSI Overbought
Alert for RSI Extreme Overbought
"Alert for RSI Oversold
Alert for RSI Extreme Oversold
Alert for RSI Crossing Above RSI MA
Alert for RSI Crossing Bellow RSI MA
Alert for RSI Crossing Above 50
Alert for RSI Crossing Bellow 50
Please follow me for other script like this one.
Kind regards,
MisterMoTA
