Deadly Trio V2.0Overview:
This is a fully featured StochRSI, RSI & Bollinger Bands customisable indicator with custom conditions and alerts that can be taken advantage of using automated solutions such as Autoview, 3Commas or using it alongside/testing BUY/SELL conditions against your favourite markets to maximise gains. Finally you can use this a standalone manual general purpose signals indicator to scalp or accumulate your chosen market.
Time Frame:
This Indicator is specially customize for 5min time frame, but you can use it on Higher Time Frames as well, such as 15min, 1hr, 4hr and 1Day.
How to Use:
Long Position:
When the RSI is in Oversold (below 30) in 5min time frame, and Deadly Trio shows BUY Signal, then enter in the trade with long position.
Take Profit for Long Position:
When the candle touches the middle line (White Line) then it will be consider as the Target 1 Hit. When the candle touches the Upper Band then it will be consider as the Target-2 Hit. Always book some profit on Target-1. To play safe, you can close your trade in profit when the Target-1 Hit.
Short Position:
When the RSI is in Overbought (above 70) in 5min time frame and Deadly Trio Indictor shows SELL Signal, then enter in the trade with short position.
Take Profit for Short Position:
When the candle touches the middle line (White Line) then it will be consider as the Target 1 Hit. When the candle touches the Lower Band then it will be consider as the Target-2 Hit. Always book some profit on Target-1. To play safe, you can close your trade in profit when the Target-1 Hit.
How to do DCA (Dollar Cost Averaging):
If you want to maximize your profit, or you want to exit your trade always in profit then DCA (Dollar Cost Averaging) is very necessory. For DCA, always buy in parts. If you are in Long Position and another BUY signals appears on Deadly Trio, then Buy some more as per your financial conditions. Same condition apply for Short Position when SELL signal appears.
When to EXIT the Trade:
If you are in Long Position/Short Position and SELL / BUY Signal appears on the candle then close your Long Position/Short Position. You can also use this condition as a STOP LOSS.
Rsi_divergence

Bogdan Ciocoiu - LitigatorDescription
The Litigator is an indicator that encapsulates the value delivered by the Relative Strength Index, Ultimate Oscillator, Stochastic and Money Flow Index algorithms to produce signals enabling users to enter positions in ideal market conditions. The Litigator integrates the value delivered by the above four algorithms into one script.
This indicator is handy when trading continuation/reversal divergence strategies in conjunction with price action.
Uniqueness
The Litigator's uniqueness stands from integrating the above algorithms into the same visual area and leveraging preconfigured parameters suitable for short term scalping (1-5 minutes).
In addition, the Litigator allows configuring the above four algorithms in such a way to coordinate signals by colour-coding or shape thickness to aid the user with identifying any emerging patterns quicker.
Furthermore, Moonshot's uniqueness is also reflected in the way it has standardised the outputs of each algorithm to look and feel the same, and in doing so, enabling users to plug them in/out as needed. This also includes ensuring the ratios of the shapes are similar (applicable to the same scale).
Open-source
The indicator uses the following open-source scripts/algorithms:
www.tradingview.com
www.tradingview.com
www.tradingview.com
www.tradingview.com

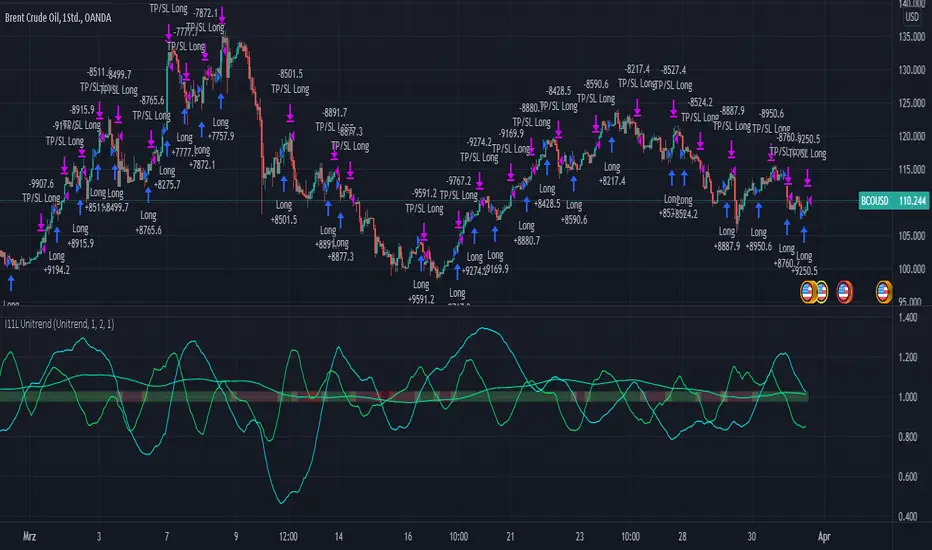
RSI, EMA, SMA Trendtrading - Oil Daytrading 1HThe Unitrend trading System produces trading recommendations on a pure Trend basis.
It is a Score based system.
--- How to use the System --
Simply adjust your capital you want to risk per trade and your TP Factor.
The TP Factor is the multiple of your risked Capital, also known as Risk/Reward ratio.
Furthermore you can toggle between a always Buy mode, to see if the System is better then market.
Compounding mode helps you to get a better understanding of your maximum drawdown with a total equity based approach.
--- How are Signals produced? ---
A score of 2 or 3 is a BUY signal.
You can count the score by looking at the lines above 1, or by reading the color.
Green is 3, yellow 2, orange 1 and red is 0.
The score is calculated by 3 conditions.
Each applying condition yields one point for the score.
The score resets each bar.
The rules are:
RSI > 45: Well known indicator, usually looks for reversal points but seems to produce above average results when above 45.
EMA(RSI) > SMA(RSI): My approach to momentum detection for the RSI movement, I consider a faster growing RSI as a good thing.
EMA(close) > SMA(close): My approach to trend detection for the market movement. Common Wisdom would be a fast SMA > slow SMA which I found to be too slow for the modern market.
RSI Swing v2 [Premium]The RSI signal is displayed with different color zones to reflect the value on the chart. This makes field evaluation more efficient.
RSI values of different time frames are displayed in the table, helping to evaluate the market more objectively.
A Retest Buy signal is given when the RSI value decreases from the area of more than 80 to 50.
Retest Sell signal is given when the RSI value increases from less than 20 to 50.
Retest Validation results are highlighted in bold for easy detection.
Settings:
* Length, source RSI
* Text size
* Type + Length MA
* RSI ADVANCE SETTINGS:
- Value RSI Range retest for Long trend
- Value RSI Range retest for Sell trend
This Indicator alert was created for the RSI Retest.
Recommendation: Should be used in combination with other Indicators to observe the market more effectively
Parabolic RSIThe Parabolic RSI is a fusion between two of Welles Wilder Jr.'s indicators:
* The parabolic stop-and-reverse: A trend following overlay indicator.
* The relative strength index: A contrarian indicator bounded between 0 and 100.
The parabolic RSI applies the RSI formula on the parabolic stop-and-reverse which in turn is applied on the market price. The main aim is to find an oscillator similar to the RSI but with a touch of a trend following indicator. In other words, the parabolic RSI is to be used in tandem with the regular RSI to get a confirmatory signal. Generally the parabolic RSI is more stable than the RSI due to the formula used (a type of smoothing from the parabolic stop-and-reverse) which is why it may have a diversification factor with the signals from the RSI.
The best way to use the parabolic RSI is as follows:
* A long signal is generated whenever the parabolic RSI exits the oversold level.
* A short signal is generated whenever the parabolic RSI exits the overbought level.

KINSKI Multi RSI DivergenceThis extremely useful indicator combines several RSI variants (can be displayed simultaneously or alone) with many setting options. The RSI variants can also be displayed as an extra histogram, which provides additional valuable information. Furthermore, it is possible to set smoothing types, volume and stochastic based calculations for each variant.
Relative Strength Index (RSI)
The Relative Strength Index ( RSI ) is a momentum indicator that measures the extent of recent price changes to analyse overbought or oversold conditions. RSI values range from 0 to 100. In general, RSI divergence means that the RSI indicator is moving in the opposite direction compared to the price. So while the price is moving, the RSI is telling us in advance that we can expect a change in direction.
RSX Indicator
The RSX is the noise-free version of the more familiar RSI oscillator. Normally, any indicator can be smoothed by applying a moving average. However, a major disadvantage of such a method is that there is a time lag between the indicator and the price. The RSX indicator tries to do this without signal delay.
Money Flow Indicator (MFI)
The MFI is essentially the RSI with the added aspect of volume . Because of its close similarity to the RSI , the MFI can be used in very similar ways.
RSI Laguerre
The RSI Laguerre works in the same way as the classic RSI , but is more sensitive to recent prices. When it crosses the signal line at the value of 0.15 from the bottom to the top, a buy signal is created, while overbought markets have values of 0.75 or higher
Detection of divergences
The detection of divergences in the RSI is one of the most important functions of this indicator. The reason is that an divergence is a more reliable signal than the overbought and oversold indicators themselves. You get overbought and oversold signals all the time. However, the divergence is a rare event.
In general, divergence means that the RSI indicator is moving in the opposite direction compared to the price. So while the price is moving, the RSI is telling us in advance that we can expect a change in direction.
Positive divergence
A positive divergence is when the price trend has lower lows and lower highs, while the indicator does the opposite - higher highs and higher lows. The price continues to fall while the RSI indicator begins to rise.
Negative divergence
Negative divergence is the opposite of positive divergence. It applies to uptrends where the price reaches higher highs and higher lows. However, the RSI shows lower highs and lower lows - the price goes up but the RSI goes down. The price closes with higher highs and higher lows, while the indicator shows the opposite - lower lows and lower highs, confirming a negative divergence. As a result, there is a sharp decline in the price.
Have fun using and trying out this flexible indicator!

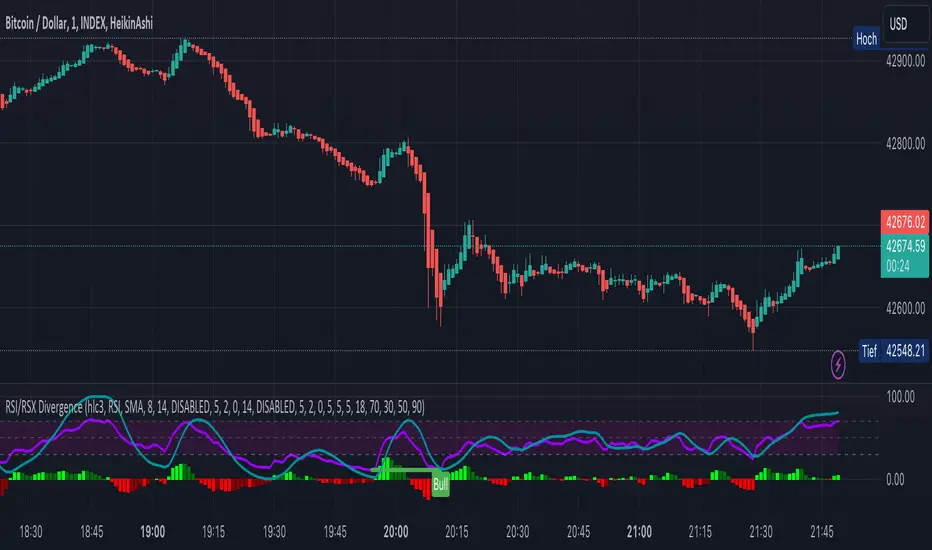
KINSKI RSI/RSX DivergenceThe Relative Strength Index (RSI) is a momentum indicator that measures the magnitude of recent price changes to analyse overbought or oversold conditions. RSI values range from 0 to 100.
The Relative Strength Index (RSI) is calculated using the following formula: RSI = 100 - 100 / (1 + RS) Where RS = average gain of upward phases during the specified time frame / average loss of downward phases during the specified time frame.
An asset price is considered overbought (due for a correction) if the RSI is above 70 and oversold (due for a recovery) if it is below 30. More extreme values (80/20) are also used to avoid false readings.
In a strong uptrend, the RSI often reaches 70 and above for long periods, and downtrends can remain at 30 or below for long periods.
Divergence detection in RSI is one of the important functions of this indicator. The reason is that an RSI divergence is a more reliable signal than the overbought and oversold indicators themselves. You will get overbought and oversold signals all the time. However, the divergence is a rare event.
In general, RSI divergence means that the RSI indicator is moving in the opposite direction compared to the price. So while the price is moving, the RSI is telling us in advance to expect a change in direction.
Positive RSI divergence
A positive RSI divergence is when the price trend has lower lows and lower highs, while the RSI indicator does the opposite - higher highs and higher lows. The price continues to fall while the RSI indicator begins to rise.
Negative RSI divergence
Negative RSI divergence is the opposite of positive divergence. It applies to uptrends where the price reaches higher highs and higher lows. However, the RSI shows lower highs and lower lows - the price goes up but the RSI goes down. The price closes with higher highs and higher lows, while the RSI indicator does the opposite - lower lows and lower highs, confirming a negative divergence. As a result, there is a sharp decline in the price.
RSX Indicator - Base script: SharkCIA by Jaggedsoft (Linked in the source code)
The RSX is the noise-free variant of the more popular RSI oscillator. Typically, any indicator can be smoothed by applying a moving average. However, a major disadvantage of such a method is that there is a time lag between the indicator and the price. RSX Indicator attempts to do this without signal delay.
What distinguishes this indicator from others of this type?
Display of RSI indicator together/alone with RSX and RSI smoothed
display of the RSI indicator (option: "RSI: On/Off")
display of the RSX indicator (option: "RSX: On/Off")
display of the RSI indicator as smoothed version (option: "RSI Smoothed: On/Off")
offers the possibility to choose between different view variants
many settings for additional information, layout and divergence identification
enables completely new comparison possibilities and insights with the additional RSI variants
RSI with Divergences, Reverse Formulas, and Bull/Bear ZonesRegular RSI indicator that can underline divergences, turn green or red specifying user specified bull/bear zones, and with a label showing the price needed to turn bull/bear!
Specify the inputs:
+ RSI Length
+ Bull Threshold
+ Bear Threshold
+ Panel Position Offset
Also with toggle-able:
+ Bullish Divergence
+ Bearish Divergence
+ Hidden Bullish Divergence
+ Hidden Bearish Divergence
The zones included in the indicator are default and not meant to be used for all markets. The goal is to alter the bull/bear zones to find good breakout points and selloff points for your chosen security. Does not currently support automatic zone creation, or saving zones for each security (if that is even possible, may just need to create different layouts for each security).
Thanks!

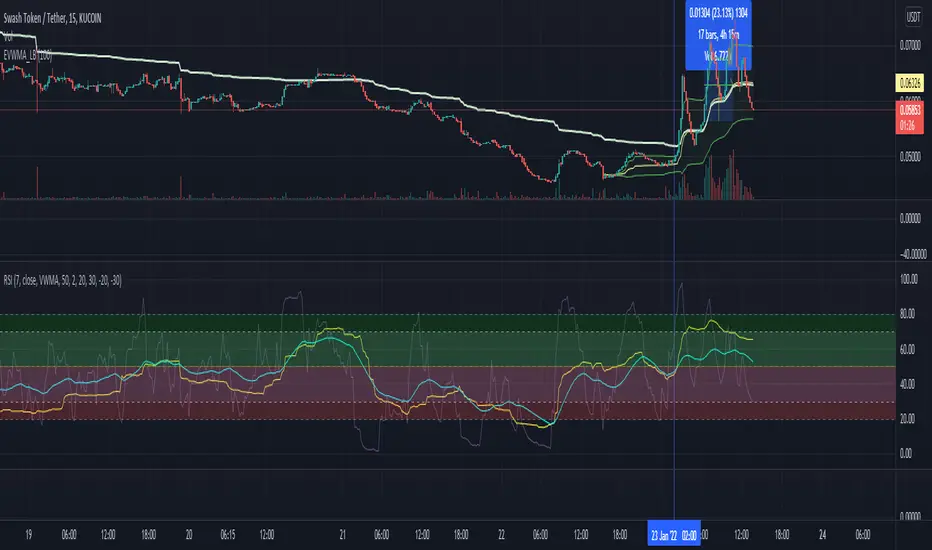
RSI v4 with Bands
Script is extended version of usual RSI script
This script plots VWMA(RSI7) vs EMA(RSI7) under pre-set time frame.
Strategy is to make sure both points remain in the Green zone while entering into BUY position
Use it as indicator not as financial advice.
~ @imbharat
RSI DINGUE - 3³ DivergenceThis is the updated version for PineScript V5
3x RSI indicator into 1. You can turn on or off all of them.
Each RSI has 2 individual Moving Averages that can also be changed to be "Full RSI" in the settings.
This makes 3x3 = 9 indicators on screen at the same time. (you can turn them on or off)
It has Bullish and Bearish divergence and hidden divergence as well.
Several visual options to show crosses between RSIs and or MAs fill in colors, background colors, midline. Overbought and Oversold levels with signals when entry and exit.
---------------------
In closing, no indicator can give perfect signals, you need to use them in conjunction with other information to make better decisions.
I hope you like my indicators and that they help your trading.
If you have any questions please ask.
Thank you.

RSI Trend LineI took a concept similar to the "Adaptive RSI" to get the RSI overlaid on a price chart. The problem I have with the Adaptive RSI is to me it sticks too closely to price. I wanted something much more visually helpful that can provide actual tradable signals and strategies.
The orange line you are seeing is the "RSI Trend Line"
The further the RSI moves away from a value of 50 (the "zero line"), the more you see this orange line move away from price. This helps visualize the strength of price pushing away from a neutral value to a position of strength or weakness-- if orange is below price then relative strength is high; if orange is above price then relative strength is low. When price is equal to the orange RSI line, the RSI is at a value of 50.
In addition to the trend line, you can enable bands which reflect Overbought and Oversold levels . If you leave the responsiveness to a value of 1.0 and removed any smoothing, these should pretty accurately reflect an actual RSI chart topping the OB and OS lines (default 70 and 30, respectively). (They're still very close with different responsiveness and smoothing values)
The conversion or scaling of RSI value onto price comes with a bit of a quirk which I decided to leave to the user to determine how they want it applied. So the setting "Responsiveness" will impact the sort of aggressiveness of the RSI trend line as well as the the size of the bands. You could think of this in some ways as the OPPOSITE of the multiple setting on a Bollinger or Keltner band-- 1.0 will make for the widest band, 2.0 is the default and my preference, and you can move it up to a value of 5.0.
Here are some examples of how you could use the indicator for trade signals--
And here's my thought on the current state (as of 10/06) on indices with regards to this indicator-

RSI Overbought Oversold Divergence Strategy w/ Buy/Sell SignalsThis indicator is a copy of my RSI Overbought/Oversold Divergence Indicator with-Alerts
Only difference is that the alerts are disabled, instead it uses tradingviews strategy tester signals
If you want alerts just use the other indicator

Multi Currency and Time RSI(Almajara)Hi,
It contains a total of 5 rsi. It allows you to compare them in different time periods. Also includes OTT indicator. If the selected pair is on ALTPERP-BTC and BTC, it gives a buy condition and the background turns green. It's a reverse sell. Overbought and oversold also show a white warning. You can customize them according to you. In addition, buy-sell and tp alarms are attached.
- 2 rsi of the selected couple
-BTC Rsi
-ETHBTC Rsi
-ALTPERP-BTC Rsi
Thank you.
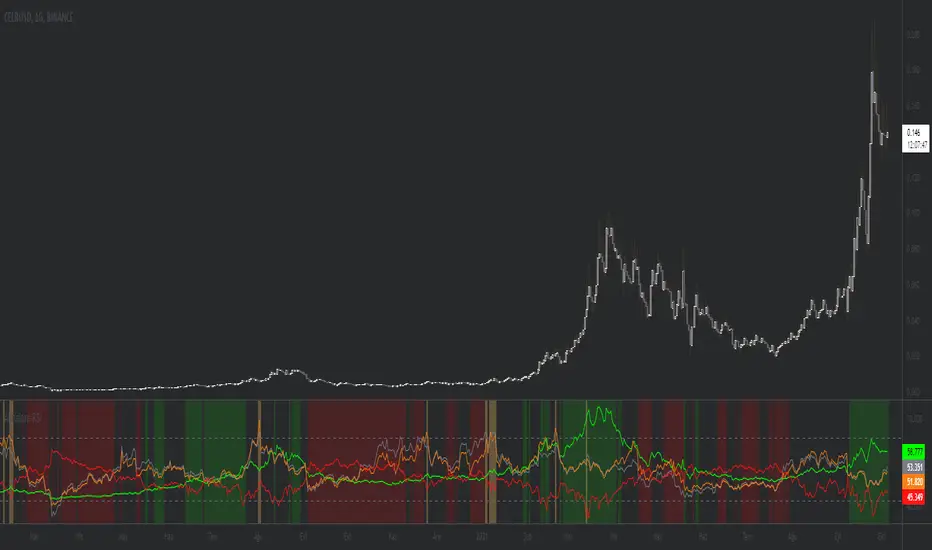
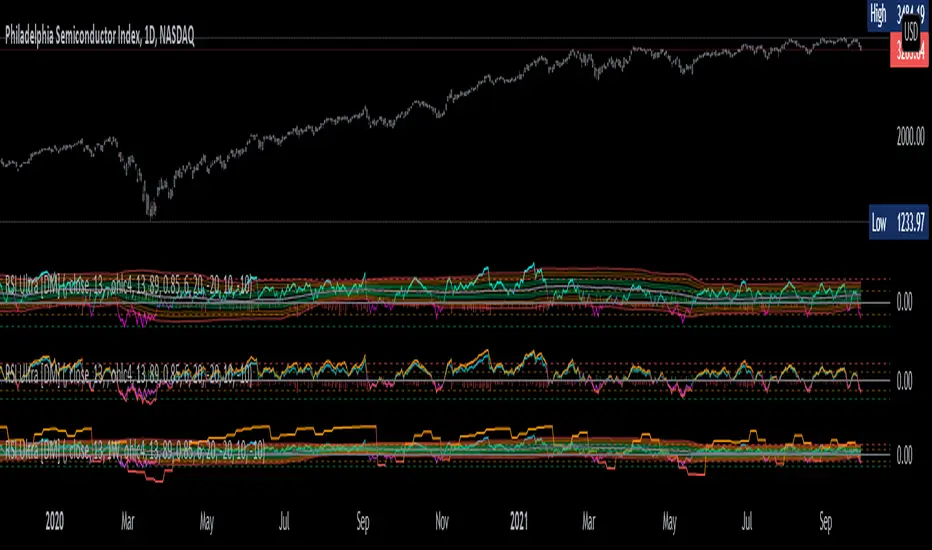
'RSI Ultra' Fully Customizable Relative Strength Index MTF [DM]Greetings Colleagues
Today, I share the classic RSI.
As in the last indicator (moving average oscillator by ) I try to show you how you can take advantage of any indicator to infinity.
For now I let you experiment with the "2" RSIs and their histograms to measure divergence.
The 1st and 2nd RSI are fully customizable together or separately. Length, source, time frame, colors.
Horizontal control levels such as RSIs are fully customizable.
In the next update "tomorrow I will possibly add some details"
I hope their brains don't explode, tomorrow more.
NEXT RSIThis is an amped-up version of the original Relative Strength Index (RSI) oscillator, giving the slope a smoother, sometimes leading edge. Our not-so-secret sauce within the algo is price/volume weighing, completely user configurable. NEXT RSI is intended to be used just like the vanilla RSI within the context of technical analysis: identifying overvalued (above upper limit) and undervalued (below lower limit) price action, as well as establishing a bias baseline (bullish if over 50; bearish if under 50). Higher NEXT RSI bottoms compared to lower price bottoms signify bullish divergence; lower NEXT RSI tops compared to higher price tops signify bearish divergence.
Below is a screenshot comparing NEXT RSI with default settings to vanilla RSI on AAPL M1 chart.
Input parameters:
Length: controls the averaging length of the RSI line.
P/V Weighing: a price/volume smoothing filter, with higher values yielding a smoother RSI line. Values over 10 can introduce lag but also help identify trend. We thought 5 was a pretty good momentum gauge (strengthening, weakening).
P/V Source: this variable is where you can get creative and blend volume with either direct price action (close, H+L/2, etc.) or other indicators such as moving averages, stochastic oscillator, and even the vanilla RSI.

RSI Divergence + EMA @DaviddTechVery simple strategy that will look for Divergence on the RSI.
My Strategy for this was mixed with the 55 EMA which you can activate in the settings.
WARNING:
- For purpose educate only - My mission is to debunk fake strategies with code to find THE ONE.
- Plots EMAs and other values on chart.
- This script to change bars colors.

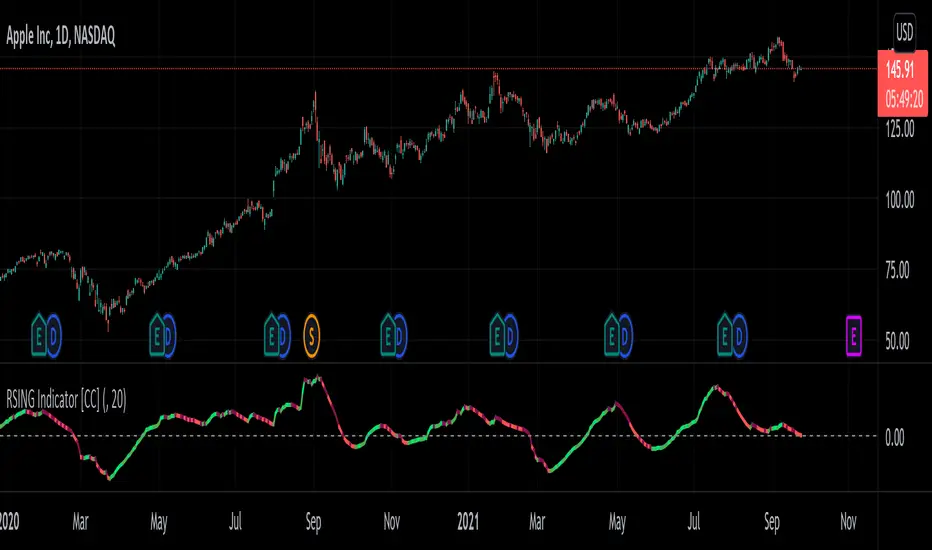
RSING Indicator [CC]The RSING indicator was created by Alon Horesh (Stocks & Commodities March 2021 pg 11) and this aims to be a better version of rsi that adapts to volume as well as a focus on overall strength. This is trying to fix the issues with the traditional RSI with a lack of volume and the issue where you could have the indicator stay in overbought or oversold territory but the upward or downward momentum continues. This indicator takes ratios of the current volume to it's moving average, the overall momentum of the stock, and the current range in comparison to the std deviation of it's past range and multiplies them all together to create this new indicator. I smooth it with a moving average for easier to read buy and sell signals. I have included strong buy and sell signals as darker colors and normal buy and sell signals as lighter colors. Buy when the line turns green and sell when it turns red.
Let me know if there are any other indicators you would like to see me publish!
RSI Hidden Divergence + Stochastic + 200 EMA @DaviddTechHey Traders,
This is my first strategy of many I hope. Inspired by a strategy I found on YouTube I wanted to see if it would work with a BOT strategy.
The idea is :
## LONG ##
* When the price is above 200 EMA take only LONG positions.
* Look for Bullish hidden divergence.
* Stochastic crossover to find our entry.
## SHORTS ##
* When the price is below 200 EMA take only SHORTpositions.
* Look for Bearish hidden divergence.
* Stochastic crossunder to find our entry.
You can used a fixed percentage, ATR, HH/LL or a FIB level to take profit.
Everything is very visual and can be connected easily to a bot.
I will be doing a video on HOW-TO setup in a couple of days.
## MUTLI LEVEL PROFITS ##
This will show you on backtest is you take profits at 3 levels however I have not tested on a BOT strategy.
NOTE : This is for educational purposes and please test on a paper account, as I said this is my first strategy.
I will be working and back testing new strategies every week.
- Made with ♥ @DaviddTech

EWO Breaking Bands & XTLElliott Wave Principle, developed by Ralph Nelson Elliott , proposes that the seemingly chaotic behaviour of the different financial markets isn’t actually chaotic. In fact the markets moves in predictable, repetitive cycles or waves and can be measured and forecast using Fibonacci numbers. These waves are a result of influence on investors from outside sources primarily the current psychology of the masses at that given time. Elliott wave predicts that the prices of the a traded currency pair will evolve in waves: five impulsive waves and three corrective waves. Impulsive waves give the main direction of the market expansion and the corrective waves are in the opposite direction (corrective wave occurrences and combination corrective wave occurrences are much higher comparing to impulsive waves)
The Elliott Wave Oscillator ( EWO ) helps identifying where you are in the 5 / 3 Elliott Waves , mainly the highest/lowest values of the oscillator might indicate a potential bullish / bearish Wave 3. Mathematically expressed, EWO is the difference between a 5 period and 35 period moving average. In this study instead 35-period, Fibonacci number 34 is implemented for the slow moving average and formula becomes ewo = sma (HL2, 5) - sma (HL2, 34)
The Elliott Wave Oscillator enables traders to track Elliott Wave counts and divergences. It allows traders to observe when an existing wave ends and when a new one begins. Included with the EWO are the breakout bands that help identify strong impulses.
The Expert Trend Locator ( XTL ) was developed by Tom Joseph (in his book Applying Technical Analysis) to identify major trends, similar to Elliott Wave 3 type swings.
Blue bars are bullish and indicate a potential upwards impulse.
Red bars are bearish and indicate a potential downwards impulse.
White bars indicate no trend is detected at the moment.
Added "TSI Arrows". The arrows is intended to help the viewer identify potential turning points. The presence of arrows indicates that the TSI indicator is either "curling" up under the signal line, or "curling" down over the signal line. This can help to anticipate reversals, or moves in favor of trend direction.

MTF Wave Stochastic RSI [Cryptoheat]MTF Wave Stochastic RSI is a multiple time frame Stochastic RSI, based on 3 different timeframes, layered on top of each other. This is a very useful tool when used to confirm and identify Elliott Waves and sub-waves at once.
Each of the three curves is based on a different time frame. While the blue (K2) curve is the current time frame, the gray (K1) is of a faster time frame which is roughly around a third of the time and the green (K3) is of a slower time frame, roughly around 3 times the current time frame. The gray and green curves are based on specific settings that were back-tested and proved more efficient.
Reasoning behind this indicator is that although the normal Stochastic RSI can show divergences more sensitively and faster than the normal RSI indicator, it cannot do so while showing a larger duration backwards in an accurate way for comparisons. It can also not show wave structures and substructures, but rather a top or bottom reversal regardless of the wave structure hierarchy and wave strength. However when several time frames are combined in one indicator, they can reveal much more information about the chart as they can show larger durations next to smaller ones. Therefore they can be used as a confirmation and helper tool to identify Waves and Sub-waves.
This can be done, by looking first at the green curve (slowest RSI) and identifying full moves. A full move is a move from being oversold to overbought and back to being oversold again. A move can be the opposite as well. By identifying the beginning and end of a move of the larger time frame stochastic RSI this can help you see the two waves in each move. One wave up and one wave down. The peak of that wave can be seen either at the highest point of the in-between peak of the green curve or by one of the smaller time frame stochastic RSI tops when the green one is diverging. A look at the price action and application of Elliott Wave knowledge is mandatory, as this indicator is mainly a confirmation tool.
By back-testing it you can see that the larger time frame Stochastic RSI can show you full impulse and corrective waves most of the times, while the lower time frame stochastic RSI should be viewed as potential sub-waves of that main wave structure. Also noticeable are the divergences that can be seen often on the larger time frame Stochastic RSI..
Please note that this tool is not recommended to be used alone as like many indicators, this is a confirmation tool that can help in identifying rather than predicting…
Also for best results Elliot Wave knowledge is recommended…
I prefer to use this indicator along with a normal Stochastic RSI on top of it so I can always see which of the three curves is of the current time frame, making it easier to understand the chart. I also prefer using the normal RSI and MACD with it…

RSI Div at Daily VWAP StDevMean Reversion indicator based on RSI Divergences at Overbought/Oversold conditions with Price above/below a Standard Deviation from Daily VWAP. Useful for intra-day trading.
Signal criteria:
1. RSI is at Overbought/Oversold
2. RSI Divergence present (not hidden)
3. RSI has not reached Neutral level (i.e. 50)
4. Price has crossed above/below a Standard Deviation from Daily VWAP
Config Options:
- RSI length (default:14)
- Divergence Lookback Period (default:14)
- RSI Oversold/Overbought tresholds (default: 70/30)
- RSI Reset Level (default: 55/45)
- Use VWAP Std Dev (default: yes)
- Standard Deviation from Daily VWAP (default: 1.51)
Use with discretion.

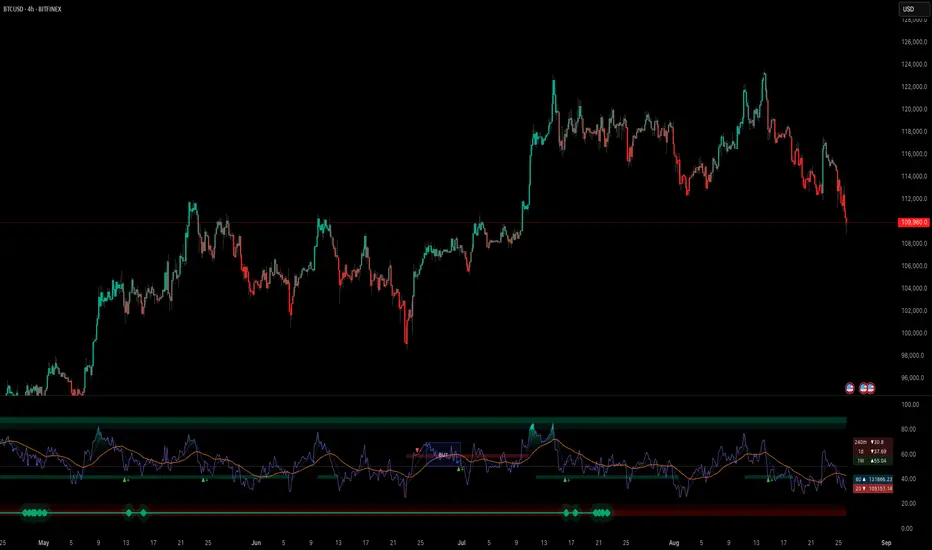
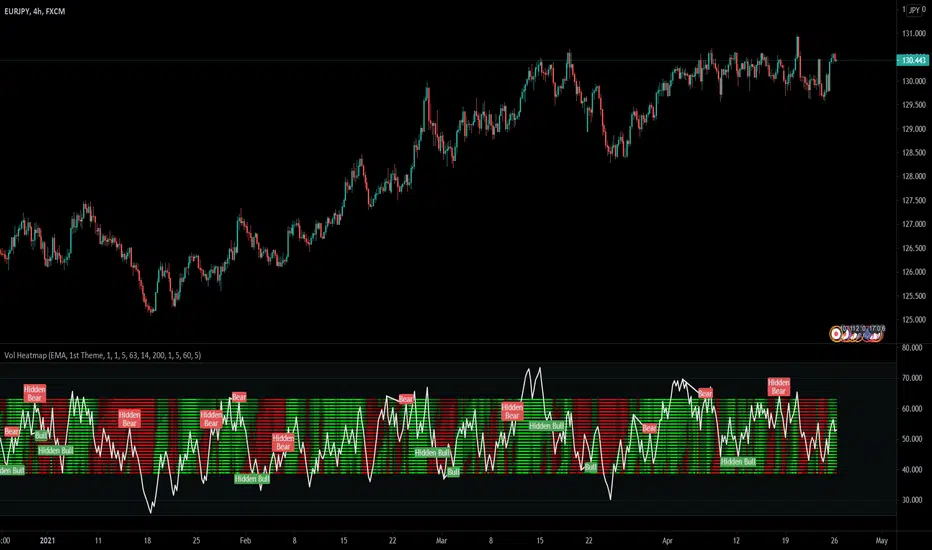
Mayfair Heatmap Volume 1.0This is our most popular indicator. It gives three separate signals and is best used on a 4H timeframe, to alert you to trading opportunities.
The heatmap area represents buying and selling pressure.
The white line works like a volume-driven RSI indicator, indicating overbought/oversold situations.
There is also a divergence indicator, represented by the Bear/Bull Hidden Bear/Hidden Bull markers, which show where the price action and the indicator's direction are moving in different directions.
Like all indicators, it is not perfect, and you should never rely on one indicator in any situation, but this one alerts you to opportunities, which you can then study on lower timeframes to find an entry.
TDI - Traders Dynamic Index + RSI Divergences + Buy/Sell SignalsTraders Dynamic Index + RSI Divergences + Buy/Sell Signals
Credits to LazyBear (original code author) and JustUncleL (modifications)..
I added some new features:
1- RSI Divergences (Original code from 'Divergence Indicator')
2- Buy/Sell Signals with alerts (Green label 'Buy' - Red label 'Sell')
3- Background colouring when RSI (Green line) crosses above MBL (yellow line)
- Buy and Sell Signals are generated using Dean Malone's method (The Author of the TDI indicator) as mentioned in his PDF: (( www.forexfactory.com )), according to:
** Buy (Green Label) = RSI > 50, Red line, & Yellow line
** Sell (Red Label) = RSI < 50, Red line, & Yellow line
- I found that the best quality long trades generated when RSI crosses above red line, yellow line and they are all above 50, and vice versa for sell trades.
-I figured out another way to generate Buy/Sell Signals when RSI crosses above the yellow line, and you can stay with the trade till RSI crosses under the yellow line (I made a background colouring for that to be easily detected)
Hope you all wonderful trades..
مؤلف المؤشر هو (Dean Malone)
وكتب LazyBear كوده في tradingview
وأضاف JustUncleL بعض التعديلات عليه
أضفت إليه بعض المزايا الأخرى المتمثلة في:
1- رصد انحرافات مؤشر القوة النسبية
2- إشارات بيع وشراء بناء على طريقة مؤلف المؤشر
3- تظليل بالأخضر للمنطقة التي يعبر فيها مؤشر القوة النسبية الخط الأوسط (الخط الأصفر)
إشارات البيع والشراء تكون كالتالي:
** الشراء عندما يكون مؤشر القوة النسبية فوق الخط الأحمر وفوق خط الـ 50 وفوق الخط الأصفر
** البيع عندما يكون مؤشر القوة النسبية تحت الخط الأحمر وتحت خط الـ 50 وتحت الخط الأصفر
** أفضل إشارات الشراء حينما يعبر مؤشر القوة النسبية فوق الخط الأحمر والأصفر، ويكونوا جميعا فوق خط الـ 50، والعكس بالنسبة لإشارات البيع
يمكن استخدام المؤشر في دخول صفقات متوسط المدى، وذلك عندما يعبر مؤشر القوة النسبية فوق الخط الأصفر (قمت بتظليل المنطقة بالأخضر لسهولة رصدها) والخروج من الصفقة إذا نزل مؤشر القوة النسبية عن الخط الأصفر،
يرجى التنبه إلى أن الدخول والخروج يكون بأسباب فنية مدروسة، والمؤشر يدعم قراراتك فقط، ولا يمكن الاعتماد عليه منفردا في تحديد نقاط الدخول أوالخروج.
تجارة موفقة لكم جميعا :)
