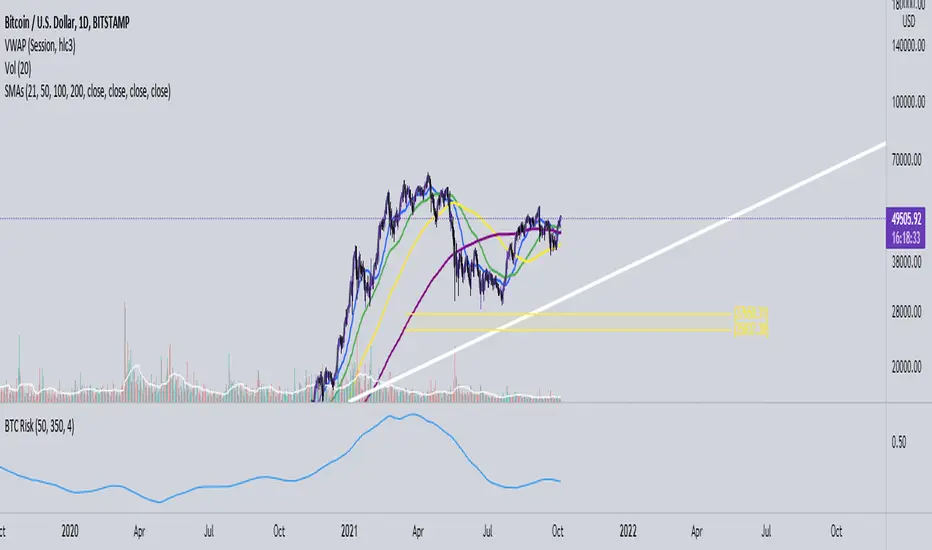
Bitcoin Risk Indicator (Daily)This indicator calculates the risk of buying and selling BTC, if the risk is reaching the upper boundaries of 0.8 to 1 then BTC is either getting close to a market cycle top or is far over extended.
If BTC is below 0.4 then this inidicates the least amount of Risk to buy BTC.
חפש סקריפטים עבור "BTC"
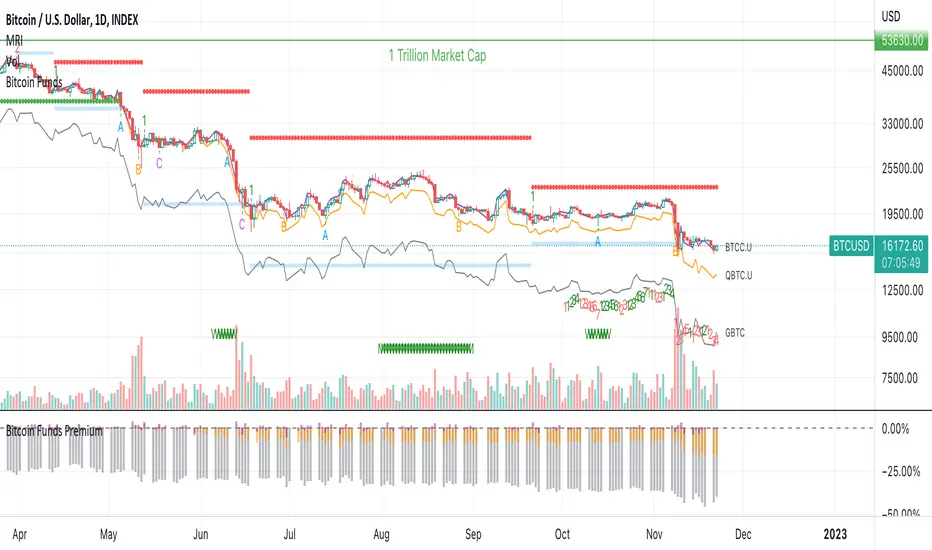
Bitcoin Funds PremiumDisplay the % premium of 4 different Bitcoin Funds relative to the price of Bitcoin in your current chart.
BTCC ETF
QBTC Fund
GBTC Trust
VBTC ETN
This indicator uses the metrics from the fund management websites to calculate the "Net Asset Value per Unit (NAVPU)" to calculate the true underlying value of the fund.
The difference is then compared to the price of Bitcoin in the chart you have open.
Note that the metrics change and therefore the graph is not accurate for long past timeframes.
If TradingView would expand their script language in a way to ingest CSV data from the funds website then this could be improved.
You can update the metrics for each fund in the settings dialogue.
The script will autodetect the currency pairs of your current graph and only display compatible funds:
BTC / USD will show BTCC.U, QBTC.U and GBTC
BTC / CAD will show BTCC and QBTC
BTC / EUR will show VBTC
The script should not show in other currency pairs so it will not mess up other charts you might switch to.
If you find bugs with this logic, please comment below so I can fix them.
Due to TradingViews "no-links in description" policy, you need to google each funds website yourself to find the current metrics. These search terms should help:
BTCC search "Purpose Bitcoin ETF"
QBTC search "3iq The Bitcoin Fund (QBTC)"
GBTC search "Grayscale® Bitcoin Trust"
VBTC search "VanEck Vectors Bitcoin ETN"
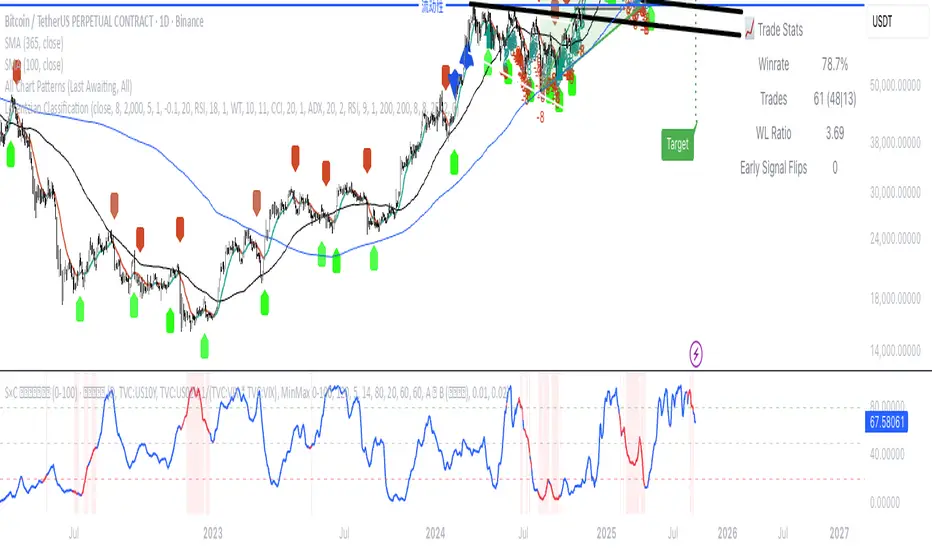
ADX Momentum cross + MacD + HH LL + Buy/Sell Signals and alerts Hello, This is the first indicator I have made and would like to contribute to the community.
This strategy came from trying to replicate a previous ADX Cross Indicator that I loved on MT4 which I used successfully on EUR/USD on high and low time frames. Through the process of trying to replicate it I failed, I decided to take what I had written so far and create my own ADX cross strategy using the combination of 3 ADX's, their lag. Then also using Higher highs and lower lows with the MacD to further filter the signals.
There are two buy and two sell conditions , the difference between these are just the order in which the ADX crossing determines the entry. The MacD and higher highs and lower lows are the same for filtering the signal.
You can change the look back for HH and LL look back range, along with the DI Length & ADX Smoothing for all ADX's. The lag used for either the buy or sell strategy with the Lag_Buy/Lag_Sell inputs. Lag_mid setting will affect all 4 conditions.
From testing and based on the ADX cross logic you should follow this structure when changing the inputs for:
DI Length: Lowest DI value (I.E. 1)
DI Lengtha: Middle DI value (I.E. 2)
DI Lengthb: Highest DI value (I.E. 3)
ADX Smoothing: Lowest Smoothing value (I.E. 1)
ADX Smoothinga: Middle Smoothing value (I.E. 2)
ADX Smoothingb: Highest Smoothing value (I.E. 3)
I tested this on the EUR/USD, but mainly I have been using it on BTC/USDT(binance) and BTC/USDT Perpetual futures(binance) with the 5 minute chart. I suggest playing around with the settings depending on the Symbol and timeframe you use because the default settings are what I last found to be optimal for my self on the 5min BTC/USDT Perpetual futures(binance) chart.
A good starting point I found when using the indicator on other charts is to use the below values:
DI Length: 7
DI Lengtha: 14
DI Lengthb: 21
ADX Smoothing: 7
ADX Smoothinga: 14
ADX Smoothingb: 21
If you have any questions, suggestions, or requests for this indicator feel free contact me. You can either comment on here or Message me
If you like this indicator please like and comment where you found it useful.

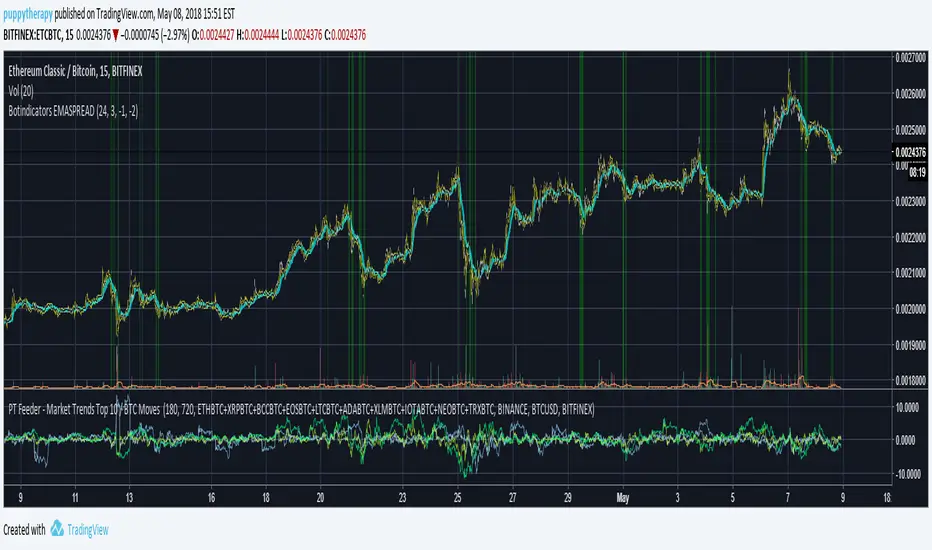
PT Feeder - Market Trends Top 10 / BTC Moves Becasue nobody was kind enough to post some PT Feeder scripts and i knew i could just modify my trends / btc script that i originally created for PT Magic. Well i just did it.
What is this script for ? PT Feeder it allows you to better imagine what kind of values you should be expecting when setting the Market Trends and BTC moves.
Green are top 10 Markets:
"MaxTopCoinLongTermAverageChange": "-3"
"MinBaseCoinPriceChange": "3",
Blue is BTC:
"MinBaseCoinLongTermPriceChange": "-3"
"MaxBaseCoinPriceChange": "3",
Why only 10 markets well becasue tradingview is very limited but it is still better than nothing.
If you like agree and follow !
PT Magic - BTC/ETH Trigger Trend ChangesThis Script shows you how BTC/ETH Percentage change in trends affect coins you trade.
- For ETH market please change BTC in Setting for ETH
What you need it PT Magic:
{
"Name": "BTC1h", // UNIQUE market trend name (to be referenced by your triggers below)
"Platform": "CoinMarketCap", // Platform to grab prices from (Allowed values are: CoinMarketCap, Exchange)
"MaxMarkets": 1, // Number of markets/pairs to analyze sorted by 24h volume
"TrendMinutes": 60 // Number of minutes to build a trend (1440 = 24h, 720 = 12h, 60 = 1h)
},
{
"Name": "ETH1h", // UNIQUE market trend name (to be referenced by your triggers below)
"Platform": "CoinMarketCap", // Platform to grab prices from (Allowed values are: CoinMarketCap, Exchange)
"MaxMarkets": 2, // Number of markets/pairs to analyze sorted by 24h volume
"IgnoredMarkets": "BTC",
"TrendMinutes": 60 // Number of minutes to build a trend (1440 = 24h, 720 = 12h, 60 = 1h)
},

NeuroSwarm BTC — Crowd vs Experts Forecast TrackerEnglish:
NeuroSwarm — Crowd vs Experts Forecast Tracker (BTC)
This indicator visualizes monthly forecasts collected from two independent groups:
Crowd – a large sample of retail traders
Experts – a smaller, curated group of analysts and experienced market participants
For each month, the following values are displayed as horizontal levels on the chart:
Median forecast of the Crowd
Average forecast of the Crowd
Median forecast of Experts
Average forecast of Experts
Shaded zones showing the range between median and mean
The values remain fixed throughout each month. This allows traders to compare sentiment dynamics between groups and see how expectations evolve relative to actual market movement.
Purpose:
This indicator is designed for sentiment analysis — NOT for generating trading signals.
It helps identify divergences between retail expectations and expert forecasts, which can be informative during trend transitions.
Data source:
All values come from monthly surveys conducted within the NeuroSwarm project (1–5 of every month).
Crowd and Expert groups are collected separately to avoid bias and to preserve independent aggregation.
Interface language note:
The indicator’s interface may contain non-English labels for ease of use, but full English documentation is provided here in compliance with TradingView House Rules.
Русская версия (optional, allowed only AFTER English):
NeuroSwarm — Мудрость Толпы vs Эксперты (BTC)
Индикатор показывает ежемесячные прогнозы двух групп:
Толпа: медиана и средняя прогнозов
Эксперты: медиана и средняя прогнозов
Значения фиксируются на весь месяц и отображаются на графике горизонтальными уровнями.
Заливка показывает диапазон между медианой и средней.
Цель индикатора — визуализировать настроение толпы и экспертов и сравнить его с реальным движением цены.
Это аналитический инструмент, а не торговая стратегия.
Данные берутся из ежемесячных опросов (1–5 числа), проводимых в рамках проекта NeuroSwarm.

MARA + IREN / BTC Divergence Monitor (v6, fixed)This indicator tracks the relative performance of two major Bitcoin miners — MARA (Marathon Digital Holdings) and IREN (Irene Energy) against Bitcoin (BTC). It calculates smoothed ratios (Miner Price ÷ BTC Price) for each miner and automatically detects divergences and convergences between them.

Crypto ETFs AUM📘 Description: BTC ETFs AUM Tracker
This indicator tracks the Assets Under Management (AUM) and daily inflows/outflows of the main U.S.-listed Bitcoin ETFs, allowing you to visualize institutional capital movement into Bitcoin products over time. It helps traders correlate institutional capital movement with Bitcoin price behavior.
🧩 Overview
The script adds up the daily AUM changes from selected Bitcoin ETFs to estimate the total net inflow/outflow of capital into spot BTC funds. It also accumulates those flows over time to display the total aggregated AUM balance, giving you a clearer sense of market direction and institutional sentiment. Two display modes are available: Balance view: plots the cumulative sum of net inflows (total ETF AUM). Inflows view: shows daily inflows (green) and outflows (red) as histogram columns, together with a smoothed moving average line.
⚙️ Inputs
Explained Base Settings Base Multiplier (base_multi) – Scaling factor applied to all AUM values. Leave at 1 for USD units, or adjust to display values in millions (1e6) or billions (1e9). Smoothing (c_smoothing) – Period length for the simple moving average used to calculate the smoothed mean inflow/outflow line. Show Balance (showBalance) – When enabled, displays the total cumulative AUM balance (sum of all net inflows over time). Show Inflows (showInflows) – When enabled, displays the daily inflows/outflows as colored columns. ETF Selection You can toggle which ETFs are included in the calculation:
BIT (BlackRock)
GBTC (Grayscale)
FBTC (Fidelity)
ARKB (ARK/21Shares)
BITB (Bitwise)
EZBC (Franklin Templeton)
BTCW (WisdomTree)
BTCO (Invesco Galaxy)
BRRR (Valkyrie)
HODL (VanEck)
Each switch determines whether the ETF’s AUM and daily flow data are included in the total calculation.
📊 Displayed Values Green Columns → Positive daily net inflows (AUM increased). Red Columns → Negative daily net outflows (AUM decreased). Orange Line → Smoothed moving average of net flows, used to identify persistent inflow/outflow trends. Blue Line (if enabled) → Total cumulative AUM balance (sum of all historical flows).
💡 Usage Notes Works best on daily timeframe, since ETF data is typically updated once per trading day. Not all ETFs have identical data history; missing data points are automatically skipped. The indicator doesn’t represent official fund NAV or guarantee data accuracy — it visualizes TradingView’s public financial feed. You can combine this tool with price action or on-chain metrics to analyze institutional Bitcoin flows.
Note: Some ETF data may not be available to all users depending on their TradingView data subscription or market access. Missing values are automatically skipped.
🧠 Disclaimer This script is for educational and analytical purposes only. It is not financial advice, and no investment decisions should be based solely on this indicator. Data accuracy depends on TradingView’s financial data sources and exchange reporting frequency.

Debt Refinance Cycle + Liquidity vs BTC (Wk) — Overlay Part 1Debt Refi Cycle - Overlay script (BTC + Liquidity + DRCI/Z normalized to BTC range)

(VIX Spread-BTC Cycle Timing Strategy)A multi-asset cycle timing strategy that constructs a 0-100 oscillator using the absolute 10Y-2Y U.S. Treasury yield spread multiplied by the inverse of VIX squared. It integrates BTC’s deviation from its 100-day MA and 10Y Treasury’s MA position as dual filters, with clear entry rules: enter bond markets when the oscillator exceeds 80 (hiking cycles) and enter BTC when it drops below 20 (easing cycles).
Mongoose Capital: BTC ETF DriftScope ProMongoose Capital: BTC ETF DriftScope Pro
A proprietary indicator for monitoring drift between Bitcoin Spot (BTCUSD) and Bitcoin Spot ETFs (such as IBIT). Designed to detect ETF premium/discount zones and generate actionable Fade or Long bias signals.
What it Does
Tracks IBIT and BTCUSD spread to highlight ETF price deviations.
Calculates correlation Z-Score for ETF/Spot alignment.
Outputs numeric bias signals: Fade (1), Long (1), Neutral (1).
How to Use
Apply to a BTCUSD chart (4H, 1D, or higher recommended).
Open the Data Window to view:
IBIT Spread %
Correlation Z-Score
Correlation %
Bias Flags (Fade, Long, Neutral)
Configure alerts for Fade and Long Bias conditions.
Confirm all signals with your trade plan and risk management.
Methodology
This tool calculates the percentage spread between IBIT and BTC Spot. A rolling Z-Score of the correlation is used to detect periods of significant divergence.
Fade Bias suggests potential short setups in premium zones with high Z-Scores.
Long Bias suggests potential long setups in discount zones with low Z-Scores.
Disclaimer
This indicator is for educational purposes only. It is not financial advice. Use at your own risk and verify signals independently.

Luma DCA Simulator (BTC only)Luma DCA Simulator – Guide
What is the Luma DCA Simulator?
The Luma DCA Tracker shows how regular Bitcoin investments (Dollar Cost Averaging) would have developed over a freely selectable period – directly in the chart, transparent and easy to follow.
Settings Overview
1. Investment amount per interval
Specifies how much capital is invested at each purchase (e.g. 100).
2. Start date
Defines the point in time from which the simulation begins – e.g. 01.01.2020.
3. Investment interval
Determines how frequently investments are made:
– Daily
– Weekly
– Every 14 days
– Monthly
4. Language
Switches the info box display between English and German.
5. Show investment data (optional)
If activated, the chart will display additional values such as total invested capital, BTC amount, current value, and profit/loss.
What the Chart Displays
Entry points: Each DCA purchase is marked as a point in the price chart.
Average entry price: An orange line visualizes the evolving DCA average.
Info box (bottom left) with a live summary of:
– Total invested capital
– Total BTC acquired
– Average entry price
– Current portfolio value
– Profit/loss in absolute terms and percentage
Note on Accuracy
This simulation is for illustrative purposes only.
Spreads, slippage, fees, and tax effects are not included.
Actual results may vary.
Technical Note
For daily or weekly intervals, the chart timeframe should be set to 1 day or lower to ensure all purchases are accurately included.
Larger timeframes (e.g. weekly or monthly charts) may result in missed investments.
Currency Handling
All calculations are based on the selected chart symbol (e.g. BTCUSD, BTCEUR, BTCUSDT).
The displayed currency is automatically determined by the chart used.

Luma DCA Tracker (BTC)Luma DCA Tracker (BTC) – User Guide
Function
This indicator simulates a regular Bitcoin investment strategy (Dollar Cost Averaging). It calculates and visualizes:
Accumulated BTC amount
Average entry price
Total amount invested
Current portfolio value
Profit/loss in absolute and percentage terms
Settings
Investment per interval
Fixed amount to be invested at each interval (e.g., 100 USD)
Start date
The date when DCA simulation begins
Investment interval
Choose between:
daily, weekly, every 14 days, or monthly
Show investment data
Displays additional chart lines (total invested, value, profit, etc.)
Chart Elements
Orange line: Average DCA entry price
Grey dots: Entry points based on selected interval
Info box (bottom left): Live summary of all key values
Notes
Purchases are simulated at the closing price of each interval
No fees, slippage, or taxes are included
The indicator is a simulation only and not linked to an actual portfolio

Crypto Portfolio vs BTC – Custom Blend TrackerThis tool tracks the performance of a custom-weighted crypto portfolio (SUI, BTC, SOL, DEEP, DOGE, LOFI, and Other) against BTC. Simply input your start date to anchor performance and compare your basket’s relative strength over time. Ideal for portfolio benchmarking, alt-season tracking, or macro trend validation.
Supports all timeframes. Based on BTC-relative returns (not USD). Open-source and customizable.

Aggregation BTC CVDThe script calculates the Cumulative Volume Delta (CVD) for multiple cryptocurrency exchanges, then averages these values and plots them.
Indicator Setup:
The script sets up an indicator called "BTC Cumulative Volume Delta (CVD) for multiple cryptocurrency exchanges", displayed as a separate panel (not overlaid on the price chart) with volume format.
Getting 1-minute data from multiple exchanges:
It retrieves 1-minute data (buy and sell volumes) for Bitcoin (BTC) against USD or USDT from several exchanges: Binance, OKEx, Coinbase (both BTCUSDT and BTCUSD), Bitfinex, Bybit, Huobi, and Kraken.
Calculating total buying and selling volume for each exchange:
For each exchange, it calculates the total buying volume (buy_vol_...), selling volume (sell_vol_...), and the difference between them (delta_vol_...).
It then computes the cumulative delta volume (cum_delta_vol_...), which is a running total of delta_vol_....
Calculating the average CVD:
It calculates the average cumulative delta volume (average_cum_delta_vol) by summing the cumulative delta volumes from all exchanges and dividing by the number of exchanges.
Plotting the average CVD:
Finally, it plots the average CVD with white color, and a line width of 2.
This script essentially provides an averaged Cumulative Volume Delta across multiple exchanges, giving a comprehensive view of buying and selling pressure in the Bitcoin market across these platforms.

COIN/BTC Volume-Weighted DivergenceThe COIN/BTC Volume-Weighted Divergence indicator identifies buy and sell signals by analyzing deviations between Coinbase and Bitcoin prices relative to their respective VWAPs (Volume-Weighted Average Price). This method isolates points of potential trend reversals, overextensions, or relative mispricing based on volume-adjusted price benchmarks.
The indicator leverages Coinbase’s high beta relative to Bitcoin in bull markets. A buy signal occurs when Coinbase is below VWAP (indicating undervaluation) while Bitcoin is above VWAP (signaling strong broader momentum). A sell signal is generated when Coinbase trades above VWAP (indicating overvaluation) while Bitcoin moves below VWAP (indicating weakening momentum).
This divergence logic enables traders to identify misalignment between Bitcoin-driven market trends and Coinbase’s price behavior. The indicator effectively identifies undervalued entry points and signals exits before speculative extensions are correct. It provides a systematic approach to trading during trending conditions, aligning decisions with volume-weighted price dynamics and inter-asset relationships.
How It Works
1. VWAP:
“fair value” benchmark combining price and volume.
• Above VWAP: Bullish momentum.
• Below VWAP: Bearish momentum.
2. Divergence:
• Coinbase Divergence: close - coin_vwap (distance from COIN’s VWAP).
• Bitcoin Divergence: btc_price - btc_vwap (distance from BTC’s VWAP).
3. Signals:
• Buy: Coinbase is below VWAP (potentially oversold), and Bitcoin is above VWAP (broader bullish trend).
• Sell: Coinbase is above VWAP (potentially overbought), and Bitcoin is below VWAP (broader bearish trend).
4. Visualization:
• Green triangle: Buy signal.
• Red triangle: Sell signal.
Strengths
• Combines price and volume for reliable insights.
• Highlights potential trend reversals or overextensions.
• Exploits correlations between Coinbase and Bitcoin.
Limitations
• Struggles in sideways markets.
• Sensitive to volume spikes, which may distort VWAP.
• Ineffective in strong trends where divergence persists.
Improvements
1. Z-Scores: Use statistical thresholds (e.g., ±2 std dev) for stronger signals.
2. Volume Filter: Generate signals only during high-volume periods.
3. Momentum Confirmation: Combine with RSI or MACD for better reliability.
4. Multi-Timeframe VWAP: Use intraday, daily, and weekly VWAPs for deeper analysis.
Complementary Tools
• Momentum Indicators: RSI, MACD for trend validation.
• Volume-Based Metrics: OBV, cumulative delta volume.
• Support/Resistance Levels: Enhance reversal accuracy.

MSTR-BTC PremiumThis custom indicator, “MSTR-BTC Premium with High, Average, and Low Levels,” helps you analyze the premium of MicroStrategy Incorporated’s (MSTR) stock price in relation to its Bitcoin holdings. By comparing the market capitalization of MSTR to the value of its Bitcoin holdings (using BTCUSD from Coinbase), this indicator calculates a premium that reflects how much the stock price deviates from its Bitcoin-related value.
Key Features:
• Premium Line: The primary feature is the “Premium,” which shows the ratio of MSTR’s market cap relative to its Bitcoin holdings and the BTCUSD price.
• High, Average, and Low Levels: The indicator calculates the highest, lowest, and average premium values over a user-defined period (default is 14 bars). These levels help identify overbought and oversold conditions relative to the stock’s Bitcoin valuation.
• Visual Shading: The area between the premium line and the average is shaded, making it easier to see when the premium is above or below its typical level. Optional shading is also available between the high and low levels to visualize the price range.
How to Use:
• Overbought/Undervalued Conditions: When the premium line rises significantly above the average, it may indicate that MSTR stock is overbought compared to its Bitcoin holdings. Conversely, when the premium falls below the average or approaches the low line, it might signal an undervalued opportunity.
• Trend and Mean Reversion: The high and low lines provide insight into extreme levels. Monitoring these alongside the average can assist in identifying potential mean reversion trades.
Customization:
• Calculation Period: The period for calculating the high, low, and average values can be adjusted to suit your trading strategy (default is 14).
• Shading Options: By default, the area between the premium and its average is shaded. You can enable or disable the shading between the high and low as needed.
This indicator is particularly useful for traders and investors following MicroStrategy (MSTR) and its Bitcoin strategy, providing a deeper understanding of the stock’s relationship to its underlying Bitcoin assets. It can assist in identifying key levels for decision-making based on deviations from historical norms.
How to Add the Indicator:
1. Adjust the calculation period (default is 14) to customize the analysis according to your preferred timeframe.
2. Watch for significant deviations of the premium line from its average to identify potential overbought/oversold conditions.
3. Use the high and low levels to help gauge extreme premium values and possible mean reversion opportunities.
Enjoy the analysis and make more informed decisions with the MSTR-BTC Premium Indicator!
This description should be clear and informative for anyone considering using your indicator. It highlights the functionality, purpose, and customization options in a straightforward way. Let me know if you’d like to tweak or adjust any part of it!

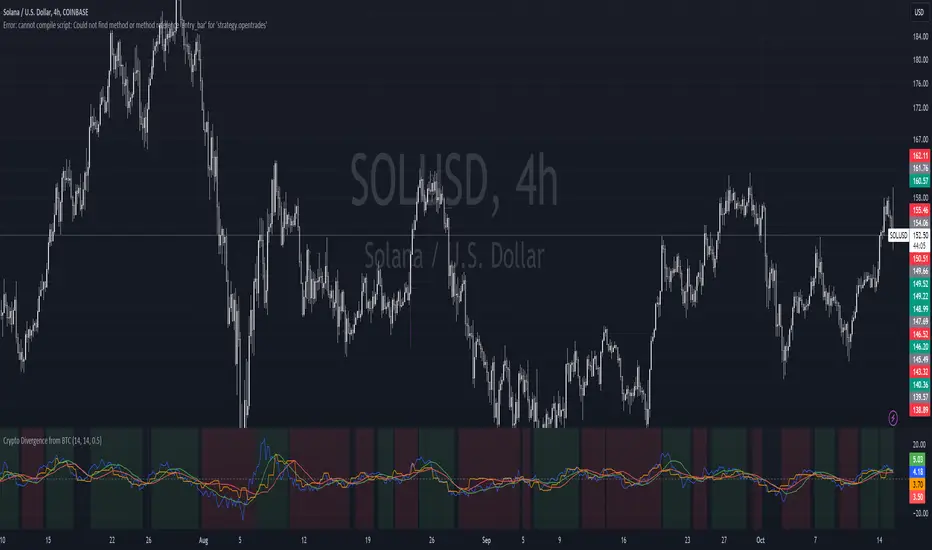
Crypto Divergence from BTCThis script is used to indicate when price action of a crypto coin is diverging significantly from that of BTC.
Explanation of the Script:
Inputs:
roc_length: The period used for calculating the Rate of Change.
ma_length: The period used for the moving average of the ROC.
threshold: The percentage difference that indicates a divergence.
Price Data:
The script retrieves the current asset's price and Bitcoin's price.
ROC Calculation:
The ROC for both the current asset and BTC is calculated based on the defined roc_length.
Moving Averages:
Simple moving averages (SMA) of the ROC values are calculated to smooth out the data.
Divergence Detection:
The indicator checks if the current asset's ROC MA is significantly higher or lower than Bitcoin's ROC MA based on the specified threshold.
Plotting:
The script plots the ROC values and their moving averages.
It also highlights the background in green when a bullish divergence is detected (when the asset is moving up while BTC is lagging) and in red for a bearish divergence.
ALT to BTC EvaluationThis custom TradingView indicator, titled "Price Relative to BTC Index", allows users to visualize the price of any selected asset relative to Bitcoin. It achieves this by comparing the closing price of the current ticker to the closing price of Bitcoin as measured by a prominent BTC index. The resulting relative price is then plotted on the chart, providing a clear and direct visual representation of how the asset is performing in comparison to Bitcoin. The plot is displayed in blue with a line width of 2, ensuring that it stands out on your trading charts. This indicator is especially useful for traders looking to assess market sentiment and relative strength between Bitcoin and other assets in real-time.

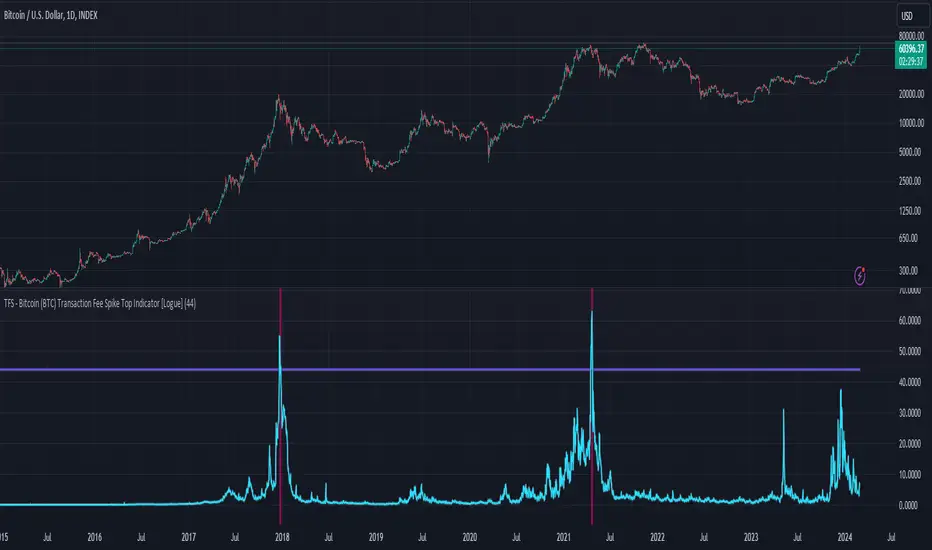
TFS - Bitcoin (BTC) Transaction Fee Spike Top Indicator [Logue]Transaction Fee Spike (TFS) - For bitcoin (BTC), transaction fees on the bitcoin network can signal a mania phase when they increase well above historical values. This mania phase may indicate we are near a top in the BTC price. The transaction fee in USD is directly retrieved from Glassnode. The default trigger for this indicator fires when the transaction fees increase above $44/transaction.
High/Low of week: Stats & Day of Week tendencies// Purpose:
-To show High of Week (HoW) day and Low of week (LoW) day frequencies/percentages for an asset.
-To further analyze Day of Week (DoW) tendencies based on averaged data from all various custom weeks. Giving a more reliable measure of DoW tendencies ('Meta Averages').
-To backtest day-of-week tendencies: across all asset history or across custom user input periods (i.e. consolidation vs trending periods).
-Education: to see how how data from a 'hard-defined-week' may be misleading when seeking statistical evidence of DoW tendencies.
// Notes & Tips:
-Only designed for use on DAILY timeframe.
-Verification table is to make sure HoW / LoW DAY (referencing previous finished week) is printing correctly and therefore the stats table is populating correctly.
-Generally, leaving Timezone input set to "America/New_York" is best, regardless of your asset or your chart timezone. But if misaligned by 1 day =>> tweak this timezone input to correct
-If you want to use manual backtesting period (e.g. for testing consolidation periods vs trending periods): toggle these settings on, then click the indicator display line three dots >> 'Reset Points' to quickly set start & end dates.
// On custom week start days:
-For assets like BTC which trade 7 days a week, this is quite simple. Pick custom start day, use verification table to check all is well. See the start week day & time in said verification table.
-For traditional assets like S&P which trade only 5 days a week and suffer from occasional Holidays, this is a bit more complicated. If the custom start day input is a bank holiday, its custom 'week' will be discounted from the data set. E.g.1: if you choose 'use custom start day' and set it to Monday, then bank holiday Monday weeks will be discounted from the data set. E.g.2: If you choose 'use custom start day' and set it to Thursday, then the Holiday Thursday custom week (e.g Thanksgiving Thursday >> following Weds) would be discounted from the data set.
// On 'Meta Averages':
-The idea is to try and mitigate out the 'continuation bias' that comes from having a fixed week start/end time: i.e. sometimes a market is trending through the week start/end time, so the start/end day stats are over-weighted if one is trying to tease out typical weekly profile tendencies or typical DoW tendencies. You'll notice this if you compare the stats with various custom start days ('bookend' start/end days are always more heavily weighted). I wanted to try to mitigate out this 'bias' by cycling through all the possible new week start/end days and taking an average of the results. i.e. on BTC/USD the 'meta average' for Tuesday would be the average of the Tuesday HoW frequencies from the set of all 7 possible custom weeks(Mon-Sun, Tues-Mon, Weds-Tues, etc etc).
// User Inputs:
~Week Start:
-use custom week start day (default toggled OFF); Choose custom week start day
-show Meta Averages (default toggled ON)
~Verification Table:
-show table, show new week lines, number of new week lines to show
-table formatting options (position, color, size)
-timezone (only for tweaking if printed DoW is misaligned by 1 day)
~Statistics Table:
-show table, table formatting options (position, color, size)
~Manual Backtesting:
-Use start date (default toggled OFF), choose start date, choose vline color
-Use end date (defautl toggled OFF), choose end date, choose vline color
// Demo charts:
NQ1! (Nasdaq), Full History, Traditional week (Mon>>Friday) stats. And Meta Averages. Annotations in purple:
NQ1! (Nasdaq), Full History, Custom week (custom start day = Wednesday). And Meta Averages. Annotations in purple:

GBTC Cost Equivalent per BTCGBTC Cost Equivalent per BTC, dynamically updates BTC holdings per share of GBTC daily
Comparison with BTC (RSI)显示当前品种与BTC汇率对的RSI值
以此判断强势或弱势品种以及超买超卖
——————————
Display the RSI value of the exchange rate between the current variety and BTC
Use this to determine strong or weak varieties, as well as overbought and oversold
