AMD-PO3-Goldbach levels [promuckaj]This script is developed on time & price, algorithmic market theory that is well explained in the book "Demystifying ICT" by Hopiplaka.
Indicators main features:
*PO3 - Goldbach(IPDA) levels which is based on the size of a price range (dealing range) as a factor of power of three (3^n).
There is PO3 numbers starting from 3 to 177147 as predefined, but also there is field for custom one so that users can experiment.
By selecting the PO3 number script calculate range low and range high using PO3 formula based on the current price and represent it on the chart into multiple levels of Goldbach numbers. At each this levels it is expected to see price that form block, fair value gap etc..., as defined in concept by ICT.
Levels:
Ext => External range
Low => Range low
High => Range high
FVG => Fair value gap
RB => Rejection block
OB => Order block
LV => Liquidity void
BR => Breaker
MB => Mitigation block
*AMD (Accumulation, Manipulation, Distribution) cycles, that can be modified by changing timings and colors.
Using PO3-Goldbach levels to identify where at the current time profile price is, there can be done trades in line with AMD cycles.
Default timings are set for Forex pairs.
*FVG, HIPPO, Displacement is well known parts of a market structure, so those three are also implemented here with some possible changes for them (colors, extension, labels...).
FVG => Fair value gap, imbalances in the market, or when buying and selling are not equal, in most cases can become a magnet for the price.
HIPPO => Hidden interbank price point objective, invention by Hopiplaka to demonstrate meaning of this "hidden" order block. It basically take the wicks of 2 consecutive bars that create a fair value gap.
DISPLACEMENT => It is practically similar to FVG but with option to measure length and strength, where in combination it will calculate and mark candle by looking back to the bars to determine the candle range standard deviation.
FEATURES:
-Multiple PO3 numbers, including special option to set your custom one
-Color and style customization
-Main levels mode, only Low, High and Equilibrium levels
-PO3 table with all PO3 calcs from multiple numbers, and mark the same levels from multiple
-Option to shift DR up or down
-Option to show you always upper/lower main DR levels (Low/High/Eq.)
NOTE:
-First of all special thanks to fxdmn that gives me idea from his indicator, how to present this through my own script.
-GB levels requires the correct symbols price calculation to work properly, everything is done by auto calc, tested well on EURUSD,SP500,DXY,Gold and BTC.
חפש סקריפטים עבור "GOLD"

Eagle-CrossingThis is Arcane Bears First Script Which charts your Golden Cross and Death Cross, You can update the settings as you see fit!
If you have any questions please join us at www.arcanebear.com

Williams Fractals / Goldilocks [NPR21]📊 Williams Fractals — Goldilocks
Description
Williams Fractals — Goldilocks highlights confirmed swing highs and lows using a refined Williams Fractals approach that balances signal frequency and clarity. BUY and SELL labels mark structurally important pivot points while avoiding chart clutter. The Periods (n) setting controls how often signals appear—lower values produce more signals, higher values filter noise. Signals are non-repainting and work on any instrument and any timeframe. Best used as a market structure and confirmation tool.
🔧 How to Use (Quick Guide)
BUY labels = confirmed swing lows (potential support / pullback areas)
SELL labels = confirmed swing highs (potential resistance / exhaustion areas)
Use for structure and confirmation, not as a standalone entry system
Combine with trend direction, key levels, VWAP/EMAs, volume, or momentum
⏱️ Recommended Periods by Timeframe
The Periods (n) setting determines how many and how often labels print.
1m–3m (Scalping): n = 2
More frequent signals; captures short-term swings.
5m–15m (Intraday): n = 8-9
Balanced sensitivity; filters minor noise.
30m–1h+ (HTF/Swing): n = 15-21
Fewer, stronger pivots; highlights major structure.
Rule of thumb: Lower timeframe → lower n. Higher timeframe → higher n.
🌍 Markets & Timeframes
Not futures-only. Works well on stocks, ETFs, forex, crypto, indices, and any timeframe. Adjust n to match the market’s pace.

PO3-Goldbach Fractal levels [promuckaj]This script is developed on time & price, algorithmic market theory that is well explained in the book "Demystifying ICT" by Hopiplaka.
What is fractals Goldbach levels and why this indicator is different then the other one based on GB levels to.
Well, the whole idea behind this script was born long time a go, when I write the first, well known, indicator for GB levels. This script allow you to set one master/main PO3 GB number, usually the higher one, and then decide what fractal GB levels you want there within 12 partitions of main(higher one) PO3 dealing range.
That means that you can deal with every single partition level from main one, RB, OB, FV, LV, BR and MB, and look them through prism of GB levels reserved for each of them.
Indicator contain all the options to deal with lines, labels, colors etc, including options for non-goldbach and CE levels. All of them could be modify separately for main and fractal levels.
Here is one example, lets set main PO3 GB number for NQ to be 2187.
We can see that we are at the moment in discount MB partition, so now let’s do the magic and activate some of fractals there, for example for MB and BR in discount zone and zoom in the chart.
I hope it is more then clear how this could be used in your analysis and trading plan.

Luxy Adaptive MA Cloud - Trend Strength & Signal Tracker V2Luxy Adaptive MA Cloud - Professional Trend Strength & Signal Tracker
Next-generation moving average cloud indicator combining ultra-smooth gradient visualization with intelligent momentum detection. Built for traders who demand clarity, precision, and actionable insights.
═══════════════════════════════════════════════
WHAT MAKES THIS INDICATOR SPECIAL?
═══════════════════════════════════════════════
Unlike traditional MA indicators that show static lines, Luxy Adaptive MA Cloud creates a living, breathing visualization of market momentum. Here's what sets it apart:
Exponential Gradient Technology
This isn't just a simple fill between two lines. It's a professionally engineered gradient system with 26 precision layers using exponential density distribution. The result? An organic, cloud-like appearance where the center is dramatically darker (15% transparency - where crossovers and price action occur), while edges fade gracefully (75% transparency). Think of it as a visual "heat map" of trend strength.
Dynamic Momentum Intelligence
Most MA clouds only show structure (which MA is on top). This indicator shows momentum strength in real-time through four intelligent states:
- 🟢 Bright Green = Explosive bullish momentum (both MAs rising strongly)
- 🔵 Blue = Weakening bullish (structure intact, but momentum fading)
- 🟠 Orange = Caution zone (bearish structure forming, weak momentum)
- 🔴 Deep Red = Strong bearish momentum (both MAs falling)
The cloud literally tells you when trends are accelerating or losing steam.
Conditional Performance Architecture
Every calculation is optimized for speed. Disable a feature? It stops calculating entirely—not just hidden, but not computed . The 26-layer gradient only renders when enabled. Toggle signals off? Those crossover checks don't run. This makes it one of the most efficient cloud indicators available, even with its advanced visual system.
Zero Repaint Guarantee
All signals and momentum states are based on confirmed bar data only . What you see in historical data is exactly what you would have seen trading live. No lookahead bias. No repainting tricks. No signals that "magically" appear perfect in hindsight. If a signal shows in history, it would have triggered in real-time at that exact moment.
Educational by Design
Every single input includes comprehensive tooltips with:
- Clear explanations of what each parameter does
- Practical examples of when to use different settings
- Recommended configurations for scalping, day trading, and swing trading
- Real-world trading impact ("This affects entry timing" vs "This is visual only")
You're not just getting an indicator—you're learning how to use it effectively .
═══════════════════════════════════════════════
THE GRADIENT CLOUD - TECHNICAL DETAILS
═══════════════════════════════════════════════
Architecture:
26 precision layers for silk-smooth transitions
Exponential density curve - layers packed tightly near center (where crossovers happen), spread wider at edges
75%-15% transparency range - center is highly opaque (15%), edges fade gracefully (75%)
V-Gradient design - emphasizes the action zone between Fast and Medium MAs
The Four Momentum States:
🟢 GREEN - Strong Bullish
Fast MA above Medium MA
Both MAs rising with momentum > 0.02%
Action: Enter/hold LONG positions, strong uptrend confirmed
🔵 BLUE - Weak Bullish
Fast MA above Medium MA
Weak or flat momentum
Action: Caution - bullish structure but losing strength, consider trailing stops
🟠 ORANGE - Weak Bearish
Medium MA above Fast MA
Weak or flat momentum
Action: Warning - bearish structure developing, consider exits
🔴 RED - Strong Bearish
Medium MA above Fast MA
Both MAs falling with momentum < -0.02%
Action: Enter/hold SHORT positions, strong downtrend confirmed
Smooth Transitions: The momentum score is smoothed using an 8-bar EMA to eliminate noise and prevent whipsaws. You see the true trend , not every minor fluctuation.
═══════════════════════════════════════════════
FLEXIBLE MOVING AVERAGE SYSTEM
═══════════════════════════════════════════════
Three Customizable MAs:
Fast MA (default: EMA 10) - Reacts quickly to price changes, defines short-term momentum
Medium MA (default: EMA 20) - Balances responsiveness with stability, core trend reference
Slow MA (default: SMA 200, optional) - Long-term trend filter, major support/resistance
Six MA Types Available:
EMA - Exponential; faster response, ideal for momentum and day trading
SMA - Simple; smooth and stable, best for swing trading and trend following
WMA - Weighted; middle ground between EMA and SMA
VWMA - Volume-weighted; reflects market participation, useful for liquid markets
RMA - Wilder's smoothing; used in RSI/ADX, excellent for trend filters
HMA - Hull; extremely responsive with minimal lag, aggressive option
Recommended Settings by Trading Style:
Scalping (1m-5m):
Fast: EMA(5-8)
Medium: EMA(10-15)
Slow: Not needed or EMA(50)
Day Trading (5m-1h):
Fast: EMA(10-12)
Medium: EMA(20-21)
Slow: SMA(200) for bias
Swing Trading (4h-1D):
Fast: EMA(10-20)
Medium: EMA(34-50)
Slow: SMA(200)
Pro Tip: Start with Fast < Medium < Slow lengths. The gradient works best when there's clear separation between Fast and Medium MAs.
═══════════════════════════════════════════════
CROSSOVER SIGNALS - CLEAN & RELIABLE
═══════════════════════════════════════════════
Golden Cross ⬆ LONG Signal
Fast MA crosses above Medium MA
Classic bullish reversal or trend continuation signal
Most reliable when accompanied by GREEN cloud (strong momentum)
Death Cross ⬇ SHORT Signal
Fast MA crosses below Medium MA
Classic bearish reversal or trend continuation signal
Most reliable when accompanied by RED cloud (strong momentum)
Signal Intelligence:
Anti-spam filter - Minimum 5 bars between signals prevents noise
Clean labels - Placed precisely at crossover points
Alert-ready - Built-in ALERTS for automated trading systems
No repainting - Signals based on confirmed bars only
Signal Quality Assessment:
High-Quality Entry:
Golden Cross + GREEN cloud + Price above both MAs
= Strong bullish setup ✓
Low-Quality Entry (skip or wait):
Golden Cross + ORANGE cloud + Choppy price action
= Weak bullish setup, likely whipsaw ✗
═══════════════════════════════════════════════
REAL-TIME INFO PANEL
═══════════════════════════════════════════════
An at-a-glance dashboard showing:
Trend Strength Indicator:
Visual display of current momentum state
Color-coded header matching cloud color
Instant recognition of market bias
MA Distance Table:
Shows percentage distance of price from each enabled MA:
Green rows : Price ABOVE MA (bullish)
Red rows : Price BELOW MA (bearish)
Gray rows : Price AT MA (rare, decision point)
Distance Interpretation:
+2% to +5%: Healthy uptrend
+5% to +10%: Getting extended, caution
+10%+: Overextended, expect pullback
-2% to -5%: Testing support
-5% to -10%: Oversold zone
-10%+: Deep correction or downtrend
Customization:
4 corner positions
5 font sizes (Tiny to Huge)
Toggle visibility on/off
═══════════════════════════════════════════════
HOW TO USE - PRACTICAL TRADING GUIDE
═══════════════════════════════════════════════
STRATEGY 1: Trend Following
Identify trend : Wait for GREEN (bullish) or RED (bearish) cloud
Enter on signal : Golden Cross in GREEN cloud = LONG, Death Cross in RED cloud = SHORT
Hold position : While cloud maintains color
Exit signals :
• Cloud turns ORANGE/BLUE = momentum weakening, tighten stops
• Opposite crossover = close position
• Cloud turns opposite color = full reversal
STRATEGY 2: Pullback Entries
Confirm trend : GREEN cloud established (bullish bias)
Wait for pullback : Price touches or crosses below Fast MA
Enter when : Price rebounds back above Fast MA with cloud still GREEN
Stop loss : Below Medium MA or recent swing low
Target : Previous high or when cloud weakens
STRATEGY 3: Momentum Confirmation
Your setup triggers : (e.g., chart pattern, support/resistance)
Check cloud color :
• GREEN = proceed with LONG
• RED = proceed with SHORT
• BLUE/ORANGE = skip or reduce size
Use gradient as confluence : Not as primary signal, but as momentum filter
Risk Management Tips:
Never enter against the cloud color (don't LONG in RED cloud)
Reduce position size during BLUE/ORANGE (transition periods)
Place stops beyond Medium MA for swing trades
Use Slow MA (200) as final trend filter - don't SHORT above it in uptrends
═══════════════════════════════════════════════
PERFORMANCE & OPTIMIZATION
═══════════════════════════════════════════════
Tested On:
Crypto: BTC, ETH, major altcoins
Stocks: SPY, AAPL, TSLA, QQQ
Forex: EUR/USD, GBP/USD, USD/JPY
Indices: S&P 500, NASDAQ, DJI
═══════════════════════════════════════════════
TRANSPARENCY & RELIABILITY
═══════════════════════════════════════════════
Educational Focus:
Detailed tooltips on every input
Clear documentation of methodology
Practical examples in descriptions
Teaches you why , not just what
Open Logic:
Momentum calculation: (Fast slope + Medium slope) / 2
Smoothing: 8-bar EMA to reduce noise
Thresholds: ±0.02% for strong momentum classification
Everything is transparent and explainable
═══════════════════════════════════════════════
COMPLETE FEATURE LIST
═══════════════════════════════════════════════
Visual Components:
26-layer exponential gradient cloud
3 customizable moving average lines
Golden Cross / Death Cross labels
Real-time info panel with trend strength
MA distance table
Calculation Features:
6 MA types (EMA, SMA, WMA, VWMA, RMA, HMA)
Momentum-based cloud coloring
Smoothed trend strength scoring
Conditional performance optimization
Customization Options:
All MA lengths adjustable
All colors customizable (when gradient disabled)
Panel position (4 corners)
Font sizes (5 options)
Toggle any feature on/off
Signal Features:
Anti-spam filter (configurable gap)
Clean, non-overlapping labels
Built-in alert conditions
No repainting guarantee
═══════════════════════════════════════════════
IMPORTANT DISCLAIMERS
═══════════════════════════════════════════════
This indicator is for educational and informational purposes only
Not financial advice - always do your own research
Past performance does not guarantee future results
Use proper risk management - never risk more than you can afford to lose
Test on paper/demo accounts before using with real money
Combine with other analysis methods - no single indicator is perfect
Works best in trending markets; less effective in choppy/sideways conditions
Signals may perform differently in different timeframes and market conditions
The indicator uses historical data for MA calculations - allow sufficient lookback period
═══════════════════════════════════════════════
CREDITS & TECHNICAL INFO
═══════════════════════════════════════════════
Version: 2.0
Release: October 2025
Special Thanks:
TradingView community for feedback and testing
Pine Script documentation for technical reference
═══════════════════════════════════════════════
SUPPORT & UPDATES
═══════════════════════════════════════════════
Found a bug? Comment below with:
Ticker symbol
Timeframe
Screenshot if possible
Steps to reproduce
Feature requests? I'm always looking to improve! Share your ideas in the comments.
Questions? Check the tooltips first (hover over any input) - most answers are there. If still stuck, ask in comments.
═══════════════════════════════════════════════
Happy Trading!
Remember: The best indicator is the one you understand and use consistently. Take time to learn how the cloud behaves in different market conditions. Practice on paper before going live. Trade smart, manage risk, and may the trends be with you! 🚀

Metallic Retracement LevelsThere's something that's always bothered me about how traders use Fibonacci retracements. Everyone treats the golden ratio like it's the only game in town, but mathematically speaking, it's completely arbitrary. The golden ratio is just the first member of an infinite family of metallic means, and there's no particular reason why 1.618 should be special for markets when we have the silver ratio at 2.414, the bronze ratio at 3.303, and literally every other metallic mean extending to infinity. We just picked one and decided it was magical.
The metallic means are a sequence of mathematical constants that generalize the golden ratio. They're defined by the equation x² = kx + 1, where k is any positive integer. When k equals 1, you get the golden ratio. When k equals 2, you get the silver ratio. When k equals 3, you get bronze, and so on forever. Each metallic mean generates its own set of ratios through successive powers, just like how the golden ratio gives you 0.618, 0.382, 0.236 and so forth. The silver ratio produces a completely different set of retracement levels, as does bronze, as does any arbitrary metallic number you want to choose.
This indicator calculates these metallic means using the standard alpha and beta formulas. For any metallic number k, alpha equals (k + sqrt(k² + 4)) / 2, and we generate retracement ratios by raising alpha to various negative powers. The script algorithmically generates these levels instead of hardcoding them, which is how it should have been done from the start. It's genuinely silly that most fib tools just hardcode the ratios when the math to generate them is straightforward. Even worse, traditional fib retracements use 0.5 as a level, which isn't even a fibonacci ratio. It's just thrown in there because it seems like it should be important.
The indicator works by first detecting swing points using the Sylvain Zig-Zag . The zig-zag identifies significant price swings by combining percentage change with ATR adjustments, filtering out noise and connecting major pivot points. This is what drives the retracement levels. Once a new swing is confirmed, the script calculates the range between the last two pivot points and generates metallic retracement levels from the most recent swing low or high.
You can adjust which metallic number to use (golden, silver, bronze, or any positive integer), control how many power ratios to display above and below the 1.0 level, and set how many complete retracement cycles you want drawn. The levels extend from the swing point and show you where price might react based on whichever metallic mean you've selected. The zig-zag settings let you tune the sensitivity of swing detection through ATR period, ATR multiplier, percentage reversal, and additional absolute or tick-based reversal values.
What this really demonstrates is that retracement analysis is more flexible than most traders realize. There's no mathematical law that says markets must respect the golden ratio over any other metallic mean. They're all valid mathematical constructs with the same kind of recursive properties. By making this tool, I wanted to highlight that using fibonacci retracements involves an arbitrary choice, and maybe that choice should be more deliberate or at least tested against alternatives. You can experiment with different metallic numbers and see which ones seem to work better for your particular market or timeframe, or just use this to understand that the standard fib levels everyone uses aren't as fundamental as they appear.

BayesCore AI Golden BarsThis indicator analyzes the market candle by candle, using the overall trend as a reference to highlight entry opportunities (buy or sell) by coloring candles in gold. These golden bars signal probabilistic opportunities for entries and re-entries throughout the trade.
We’ve added three classic moving averages so traders can have a visual reference of zones and trends to decide whether to act on the opportunities suggested by the indicator.
Tip: The best entries usually occur near the regions of the moving averages (blue and green lines). That’s why we included these classic moving averages, to give traders a clear trend reference.
Additionally, the indicator provides alerts such as “Only Buy,” “Only Sell,” or “No Action” to help traders maintain psychological discipline during the trading process and seek the best entries aligned with the market trend.
Giant candles, which can signal the ignition force of a market trend, are also colored gold and marked with an elephant icon, symbolizing the “leader of the herd,” suggesting that the movement may be worth following.
On the chart, the indicator plots two lines above and two lines below the candles near the active candle. These lines suggest possible stop-loss placements based on previous swing highs and lows, ensuring they are not overly costly stops. They serve only as indicative stop-loss positions, leaving it up to the trader to assess—based on their risk management—whether the suggested placement is appropriate.
Always consider whether the golden candle coloring aligns with the overall market trend.
Past results do not guarantee future returns.

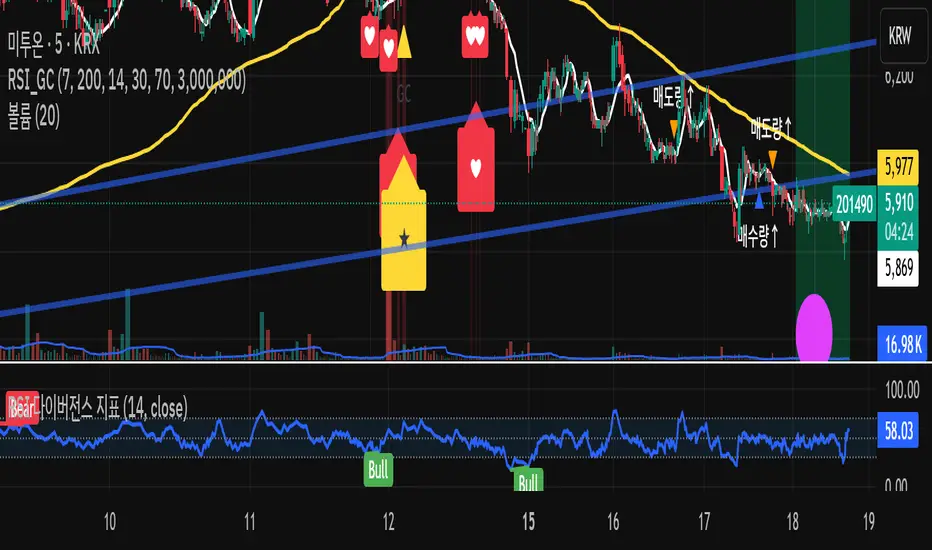
RSI + Volume + GoldenCross + OBV + Inst + HeartRSI + Volume + GoldenCross + OBV + Inst + Heart
“An algorithm for detecting volume patterns following Golden Cross support with rising volume.”
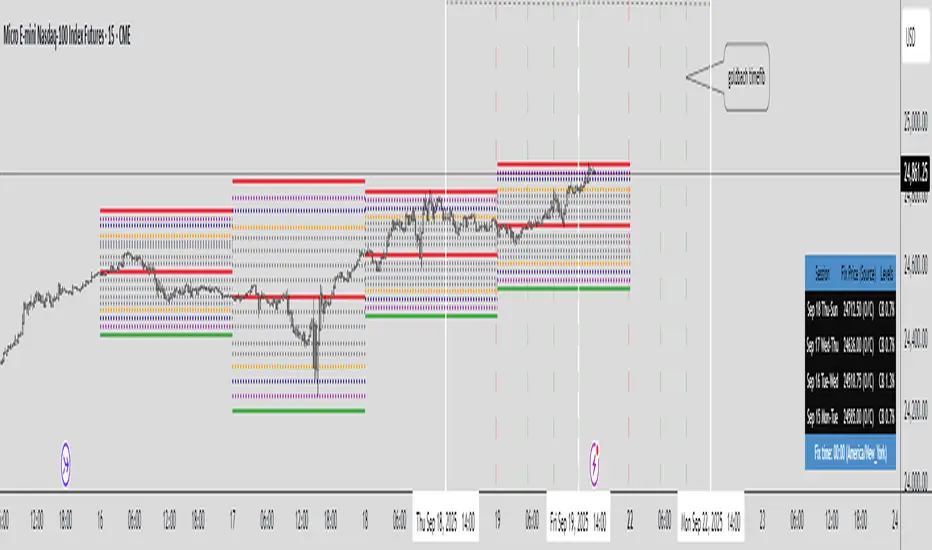
Hopiplaka Twin Tower Levels (Variable Multiplier) [NZA 333]Purpose
Instrument scope: This indicator is for exchange-traded futures only (e.g., CME/ICE). It assumes a regular session with a 16:00 daily fix; use on spot FX, equities/ETFs, CFDs, or crypto is not supported and may produce incorrect windows/levels.
This tool draws structured possible support/resistance price-level frameworks anchored to a daily “Fix” at 16:00 and lets you study intraday expansion/mean-reversion from that anchor. It overlays three families of levels:
CB - Circuit-Breaker style bands: symmetric bands at ±X% of the Fix (user-defined), plus intermediate percentages (14/26/40/50/60/74/86) and three highlighted “impulse” bands.
GB – “Goldbach-type” ratios: fixed ratios applied to a user-selected PO3 dealing range (e.g., 729, 2187, 6561 points). This produces low/eq/high rails and intermediate harmonics, including extended rails at −0.111 and 1.111.
STDV – “Stop-Run” ladders: equidistant steps (user step size) centered on the Fix and bounded by ±PO3/2.
All drawings are time-boxed windows that run from one 16:00 to the next 16:00 so you can compare today vs. prior sessions at a glance, including weekends/market closures.
How it works (high level)
Session windows (16:00→16:00)
For non-crypto symbols, each “day” is a window starting at 16:00 in the user-chosen timezone (default: America/New_York) and ending at the next day’s 15:59. When a new 16:00 occurs, the script immediately rolls the windows forward so Day-0, Day-1, Day-2, Day-3 always reference the latest four 16:00 anchors, even across weekends.
Fix source (per day)
Each day can use one of:
O/C: the open price of the 16:00 bar (acts as an official fix for that session).
VWAP: the VWAP value on the 15:59:30 (last 30 seconds bar before 16:00). You need Trading View Premium to use this source.
Manual: user-entered value. You can visit CME Group's website to see the published fix prices for your chart and enter it manually.
For a current session you want to use the previous session fix price until 4 pm (New York).
Market type handling
Crypto: by default the Fix is 16:00 Europe/London (configurable). Crypto session handling remains continuous; the script keeps the crypto branch behavior separate so nothing changes for 24/7 markets.
Non-crypto: uses the selected timezone (default NY). The script explicitly handles weekends/holidays so Day-0 can be Fri→Mon and Day-1 Thu→Fri, etc.
Ratios & math
Circuit Breakers bands: Fix ± (Fix * percent / 100), with extra mid-points (“CE levels”) and the intermediate percentages listed above.
Goldbach ratios: a fixed array of ratios mapped onto the PO3 distance; on Forex, PO3 is automatically converted to price units using syminfo.mintick.
STDV steps: Fix ± n * step, drawn only within ±PO3/2.
Rendering model
Lines are created with xloc = xloc.bar_time between the window’s start/end timestamps. A housekeeping buffer deletes/redraws on the last bar to keep charts responsive when you toggle features. A compact table shows, per day window, the session label, Fix (and its source), and the active options (CB%, PO3, STDV).
Update behavior
As soon as the 16:00 1-minute bar closes, the Fix for Day-0 updates and older windows roll forward. Historical windows (Day-1/2/3) also move forward afterward, since their Fix times are already stored. On higher timeframes, the script relies on the captured 1-minute Fix so Day-0 levels appear intrabar even if the higher-TF candle hasn’t closed yet.
How to use it
I - Choose the Fix source per day (Manual / VWAP / O/C).
II- Choose levels to show on each day, via toggles:
- Mode 1: Toggle "Show Goldbach Levels" and/or "NG Levels" / "CE Levels" (extra ratio sets) to show these levels for the day. Choose PO3 DR (Dealing Range), note the fix price acts as Equilibrium.
- Mode 2: Toggle "Show Stop Run Levels" to show PO3 distance in handles from Fix Price. Choose a PO3 number from the "STDV" option, this will be your max distance in handles (think Dealing Range).
- Mode 3: Toggle "Show Circuit Breaker Levels" to show ratios derived from the CME Group's official price limits percents from the fix price for a day (7%, 13% or 20%) * 2.
Each mode's toggles are in the same line, one line per mode. Usually you just need one of the 3 modes.
III - Use Day shift to scroll the four windows through past sessions (0 by default).
IV - Use Hour shift to visually nudge the drawings on the time axis without changing calculations.
Timezone: for non-crypto, select America/New_York, Europe/London or UTC for the 16:00 anchor. Crypto can auto-use London 16:00.
Notes & limitations
The tool does not generate buy/sell signals; it’s a visual framework for contextual levels.
O/C fixes (Default) are captured from the 1-minute series at exactly 16:00; if a symbol lacks 1-minute history at that time (rare), a day window may show as missing or could take the fix price incorrectly.
VWAP fixes are captured from the 30-seconds series at exactly 16:00; if a symbol lacks 30 seconds history at that time, a day window may show as missing.
Historical windows are fixed once their 16:00 bar has closed; Day-0 updates only at the moment a new 16:00 occurs.
Be mindful of symbol tick size/PO3 scale on Forex vs. indices/futures.
This indicator does not predict future values and does not access future data beyond the last completed 16:00 bar. See TradingView’s guidance on realistic claims and use of request.security.
(Educational use only. Trading involves risk; past behavior of levels relative to price does not guarantee future outcomes.)
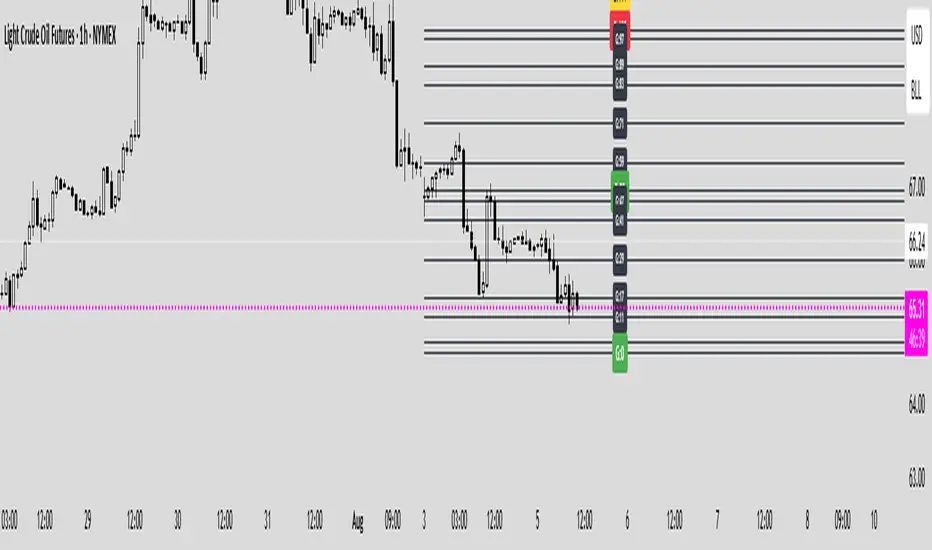
The Quasar Strategy Magic LevelsThis indicator plots key market levels that remain valid from 4:00pm New York close until the next day’s 4:00pm close.
The core logic combines:
A custom Goldbach-inspired range,
Circuit breaker percentages,
And hidden PO3 overlays.
These levels often act as magnets, targets, and later as support or resistance zones.
The central line of the whole range is what I call “the restaurant” — a strong attraction point where prices tend to gravitate, especially after the 9:30 a.m. opening.
Since these levels are based on a certain fixed price in a %, they will change over time. Then I will updated the indicator.
Use these levels as a confluence with your own trading strategy for entries and exits.

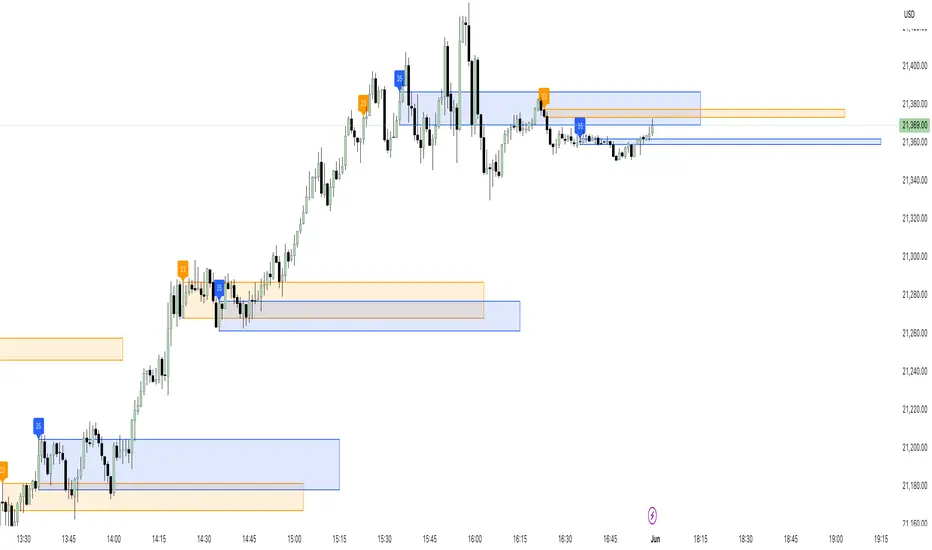
Dynamic Fibonacci MTF Zones v1🔹 Overview
This indicator automatically detects Fibonacci retracement levels across multiple timeframes (MTF) and highlights the most relevant zones around the current price.
Instead of cluttering the chart with too many lines, it only shows the 3 nearest levels above and below the current price, with clear labels and lines.
🔹 Key Features
Multi-Timeframe Support
Up to 7 custom timeframes can be analyzed simultaneously
Example: 5m, 15m, 1H, 4H, 1D, 1W, 1M
Dynamic Fibonacci Levels
Based on recent high/low within N bars
Uses extended set of 25 ratios (0.045 ~ 0.955)
Golden Pocket (0.382–0.618) zones are auto-highlighted
Nearest 3 Levels Display
Picks the 3 closest levels above and below current price
Labels and lines are plotted for clarity
Identical levels across TFs are merged automatically for clean display
Labels with Details
Direction (▲ / ▼)
Timeframe
Fibonacci ratio
Exact price
Visual Customization
Above levels in blue tones, below levels in red tones
Transparency darkens gradually from TF1 → TF7
Line style: solid / dashed / dotted
Zone fills with adjustable colors
🔹 How to Use
Identify strong support/resistance zones where multiple TF Fibonacci levels overlap
Scalpers: Combine short TFs (5m, 15m, 1H)
Swing traders: Use higher TFs (4H, 1D, 1W)
Investors: Track broader zones (1D, 1W, 1M)
🔹 Settings
Recent Range Bars (R): lookback period for Fibonacci highs/lows
Golden Pocket Highlight: toggle 0.382–0.618 shading
Line Style: switch between line/circle visualization
MTF Control: enable/disable TF1~TF7 with custom timeframe selection
✅ Core Idea:
This tool doesn’t just draw Fibonacci lines — it dynamically selects the most relevant MTF levels, merges duplicates, and highlights only the critical zones you need for real trading decisions.

ADVANCED EMA RIBBON SUITE PRO [Multi-Timeframe + Alerts + Dash]🎯 ADVANCED EMA RIBBON SUITE PRO
📊 DESCRIPTION:
The most comprehensive EMA Ribbon indicator on TradingView, featuring 14 customizable
EMAs (5-200), multi-timeframe analysis, gradient ribbon visualization, smart alerts,
and a real-time dashboard. Perfect for trend following, scalping, and swing trading.
🔥 KEY FEATURES:
• 14 EMAs with Fibonacci sequence option (5, 8, 13, 21, 34, 55, 89, 144, 200)
• Multi-Timeframe (MTF) analysis - see higher timeframe trends
• Dynamic gradient ribbon with trend-based coloring
• Golden Cross & Death Cross detection with alerts
• Professional themes (Dark/Light) with 6 visual styles
• Real-time information dashboard
• Customizable transparency and colors
• Trend strength visualization
• Price position analysis
• Smart alert system for all major crossovers
📈 USE CASES:
• Trend Identification: Ribbon expansion/contraction shows trend strength
• Entry/Exit Signals: EMA crossovers provide clear trade signals
• Support/Resistance: EMAs act as dynamic S/R levels
• Multi-Timeframe Confluence: Combine timeframes for higher probability trades
• Scalping: Use faster EMAs (5-20) for quick trades
• Swing Trading: Focus on 50/200 EMAs for position trades
🎯 TRADING STRATEGIES:
1. Ribbon Squeeze: Trade breakouts when ribbon contracts
2. Golden/Death Cross: Major trend reversals at 50/200 crosses
3. Price Above/Below: Long when price above most EMAs, short when below
4. MTF Confluence: Trade when multiple timeframes align
5. Dynamic S/R: Use EMAs as trailing stop levels
⚡ OPTIMAL SETTINGS:
• Scalping: 5, 8, 13, 21 EMAs on 1-5 min charts
• Day Trading: Full ribbon on 15-60 min charts
• Swing Trading: Focus on 50, 100, 200 EMAs on daily charts
• Position Trading: Use weekly timeframe with monthly MTF
📌 KEYWORDS:
EMA, Exponential Moving Average, Ribbon, Multi-Timeframe, MTF, Golden Cross,
Death Cross, Trend Following, Scalping, Swing Trading, Dashboard, Alerts,
Support Resistance, Fibonacci, Professional, Advanced, Suite, Indicator
*Created using PineCraft AI (Link in Bio)

P3 Weekly Goldbach levelsP3 Weekly Session Projections
Originality and Uniqueness:
Novel Time-Based Approach:
This indicator uniquely combines the previous weeks range analysis with mathematical Goldbach number sequences
Unlike standard Fibonacci retracements that use swing highs/lows, this script uses a specific weekly session window for consistent anchor points
The weekly reset mechanism ensures levels are always based on the most recent Sunday session, providing fresh, relevant levels
2. Mathematical Innovation:
First-of-its-kind application weekly Goldbach numbers (100, 97, 89, 83, 71, 59, 50, 47, 41, 29, 17, 11, 3, 0) as support/resistance levels
Dual-range projection system: Projects both standard deviations internally and overlays Goldbach levels for precise mathematical alignment
Auto-extending ranges when price breaks beyond 100/0 levels – automatically adds upper and lower GB ranges
3. Advanced Technical Features:
Dynamic label positioning with 4 different modes (Right Edge, Left of Line, Right of Line, Fixed Position)
Color-coded level hierarchy: Red (G:100), Green (G:0), Yellow (G:111/-111) for instant visual recognition
Session-based calculations using real market hours rather than arbitrary chart points
Clean weekly management – automatically removes previous levels and draws fresh ones each Sunday
Practical Usefulness:
1. Professional Trading Application:
Institutional session timing: plots when major institutions begin weekly positioning
Objective level placement: Eliminates subjective swing high/low selection - uses concrete session data
Multi-market applicability: Works on forex, indices, commodities, and crypto that trade during this session
2. Risk Management Benefits:
Predefined support/resistance zones based on mathematical progression rather than subjective analysis
Extension levels provide targets when price moves beyond normal ranges
Weekly refresh ensures levels remain relevant to current market structure
3. Unique Market Insights:
Goldbach number spacing provides mathematically-derived levels that often align with natural market movements
Session-based anchoring captures institutional weekly bias and positioning
Visual clarity with customizable labels and positioning for different trading styles
How It Differs from Existing Scripts:
Not a standard Fibonacci tool - uses specific mathematical sequence with weekly session anchoring
Not a generic pivot indicator - focuses on Sunday institutional session range
Not a simple support/resistance script - combines time-based analysis with mathematical projections
Not a rehash of existing indicators - genuinely novel approach combining session analysis with Goldbach mathematics
Target Audience:
Institutional traders using weekly analysis
Mathematical traders interested in number theory applications
Session-based analysts focusing on specific market opening periods
Risk management specialists needing objective level placement
This script represents genuine innovation in combining specific market session analysis with mathematical number theory, providing traders with a unique tool that doesn't exist elsewhere in the TradingView library.
23/35 SR Channels (Hitchhikers Guide To Goldbach)This indicator highlights potential short-term support and resistance zones based on the 23rd and 35th minute of each hour. At each of these time points, it draws a zone from the high to the low of the candle, extending it forward for a fixed number of bars.
Key features:
🔸 Orange zones mark the 23-minute candle
🔹 Blue zones mark the 35-minute candle
📏 Zones extend for a customizable number of bars (channelLength)
🔄 Existing zones are removed if they overlap significantly with a new one
🏷️ Optional labels show when a 23 or 35 zone is created
This tool is ideal for traders looking to identify time-based micro-structures and intraday reaction zones.
AutoFib Breakout Strategy for Uptrend AssetsThis trading strategy is designed to help you catch powerful upward moves on assets that are in a long-term uptrend, such as Gold (XAUUSD). It uses a popular technical tool called the Fibonacci Extension, combined with a trend filter and a risk-managed exit system.
✅ When to Use This Strategy
• Works best on higher timeframes: Daily (1D), 3-Day (3D), or Weekly (W).
• Best used on uptrending assets like Gold.
• Designed for swing trading – holding trades from a few days to weeks.
📊 How It Works
1. Find the Trend
We only want to trade in the direction of the trend.
• The strategy uses the 200-period EMA (Exponential Moving Average) to identify if the market is in an uptrend.
• If the price is above the 200 EMA, we consider it an uptrend and allow long trades.
2. Identify Breakout Levels
• The strategy detects recent high and low pivot points to draw Fibonacci extension levels.
• It focuses on the 1.618 Fibonacci level, which is often a target in strong trends.
• When the price breaks above this level in an uptrend, it signals a potential momentum breakout – a good time to buy.
3. Enter a Trade
• The strategy enters a long (buy) position when the price closes above the 1.618 Fibonacci level and the market is in an uptrend (above the 200 EMA).
4. Manage Risk Automatically
• The trade includes a stop-loss set to 1x the ATR (Average True Range) below the entry price – this protects against sudden drops.
• It sets a take-profit at 3x the ATR above the entry – aiming for higher rewards than risks.
⚠️ Important Notes
• 📈 Higher Timeframes Preferred: This strategy works best on Daily (D), 3-Day (3D), and Weekly (W) charts, especially on Gold (XAUUSD).
• 🧪 Not for Deep Backtesting: Due to the nature of how pivot points and Fib levels are calculated, this strategy may not perform well in backtesting simulations (because the historical calculations can shift). It is better used for live analysis and forward testing.

CANX MA Crossover© CanxStixTrader
Moving average crossover systems measure drift in the market. They are great strategies for time-limited traders. KEEP IT SIMPLE
This strategy works both for buys and sells using the reaction line to guide your position against the reactions.
HOW TO USE THE INDICATOR
1) Choose your market and timeframe.
2) Choose the length.
3) Choose the multiplier.
4) Choose if the strategy is long-only or bidirectional (longs & shorts).
TIPS
The strategy works best in bullish markets as that is the primary direction that market such as stocks, indexes and metals like to move.
- Increase the multiplier to reduce whipsaws
- Increase the length to take fewer trades
- Decrease the length to take more trades
- Try a Long-Only strategy to see if that performs better.
The base set up when you load the indicator is for the 1 minute chart on gold. We found that it also works well on the US Indexes. For other markets you may need to change the length and multiplier to suit the market and back test its results.

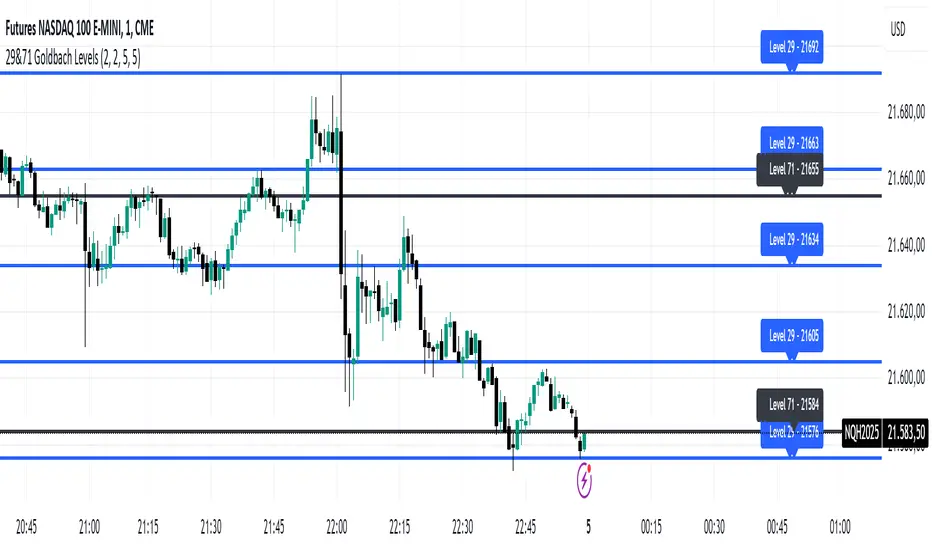
29&71 Goldbach levelsThe indicator automatically plots horizontal lines at the 29 and 71 price levels on your chart. These levels serve as psychological barriers in the market, where price action may react or consolidate, just as prime numbers are fundamental in the theory of numbers.
---
Features:
- 29 Level: Identifies significant areas where market participants may encounter support or resistance, similar to the importance of prime numbers in Goldbach's conjecture.
- 71 Level: Marks another key zone that might indicate possible price breakouts or reversals, offering traders a reference point for decision-making.
- Customizable: You can adjust the colors, line styles, or alerts associated with these levels to fit your trading preferences.
How to Use:
- Use the 29 and 71 levels to spot potential areas of support or resistance on the chart.
- Watch for price reactions at these levels for possible breakout or reversal setups.
- Combine the levels with other technical indicators for added confirmation.
---
This indicator blends the theory of prime numbers with market analysis, offering traders a novel approach to identifying key levels that might influence price movements.
FuTech : MACD Crossovers Advanced Alert Lines=============================================================
Indicator : FuTech: MACD Crossovers Advanced Alert Lines
Overview:
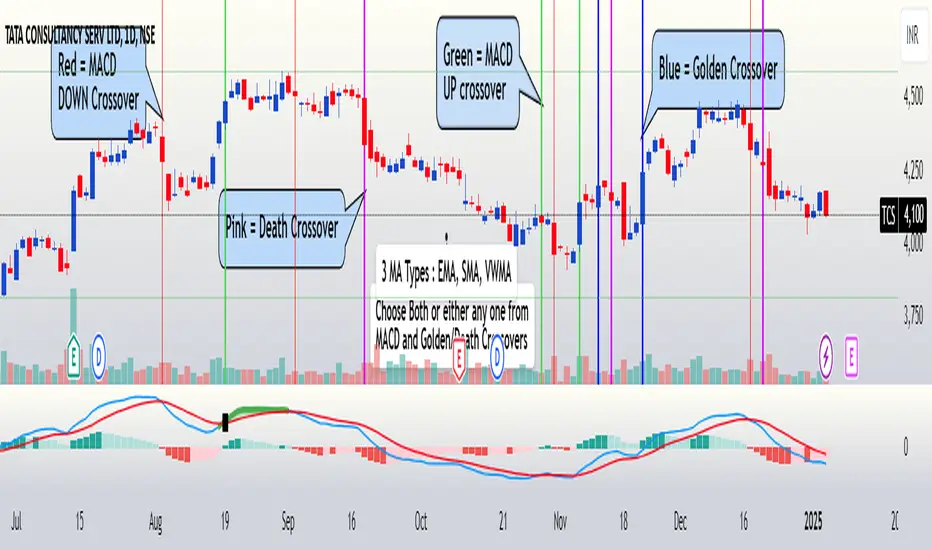
The "FuTech: MACD Crossovers Advanced Alert Lines" indicator is designed to assist traders in identifying key technical patterns using the :-
1. MACD (Moving Average Convergence Divergence) and
2. Golden/Death Crossovers
By visualizing these indicators directly on the chart with advanced lines, it helps traders make more informed decisions on when to enter or exit trades.
=============================================================
Key Features of "FuTech: MACD Crossovers Advanced Alert Lines":
1. MACD Crossovers:
a) The MACD is one of the most widely used indicators for identifying momentum shifts and potential buy/sell signals. This indicator plots vertical lines on the chart whenever the MACD line crosses the signal line.
b) Upward Crossover (Bullish Signal) : When the MACD line crosses above the signal line, a green vertical line will appear, indicating a potential buying opportunity.
c) Downward Crossover (Bearish Signal) : When the MACD line crosses below the signal line, a red vertical line will appear, signaling a potential selling opportunity.
2. Golden Cross & Death Cross:
a) The Golden Cross occurs when the price moves above a long-term moving average (like the 50-day moving average), signaling a potential upward trend.
b) The Death Cross occurs when the price moves below a long-term moving average, signaling a potential downward trend.
c) These crossovers are displayed with customizable lines on the chart to easily spot when the market is shifting direction.
d) Golden Cross (Bullish Signal) : A blue vertical line appears when the price crosses above the selected long-term moving average.
e) Death Cross (Bearish Signal) : A purple vertical line appears when the price crosses below the selected long-term moving average.
=============================================================
Customization Options:
This indicator offers several customization options to suit your trading preferences:
1) MACD Settings:
a) Choose between different moving average types (EMA, SMA, or VWMA) for calculating the MACD.
b) Adjust the lengths of the fast, slow, and signal MACD periods.
c) Control the width and color of the vertical lines drawn on the chart for both up and down crossovers.
2) Golden Cross / Death Cross Settings:
a) Select the moving average type for the Golden Cross / Death Cross (EMA, SMA, or VWMA).
b) Define the lookback period for calculating the Golden Cross / Death Cross.
c) Customize the appearance of the Golden and Death Cross lines, including their width and color.
You can use both as well as either of the MACD lines or Golden Crossover / Death Crossover Lines respectively as per your trading strategies
=============================================================
How "FuTech: MACD Crossovers Advanced Alert Lines" indicator Works:
a) The indicator monitors the price and calculates the MACD and Golden/Death Crosses.
b) When the MACD line crosses above or below the signal line, or when the price crosses above or below the long-term moving average, it plots a vertical line on the chart.
c) These lines help traders quickly spot potential turning points in the market, providing clear signals to act upon.
=============================================================
Use Case:
a) Swing Traders: The indicator is useful for spotting momentum shifts and trend reversals, helping you time entries and exits for short- to medium-term trades.
b) Long-Term Traders: The Golden and Death Cross signals help identify major trend changes, giving insights into potential market shifts.
=============================================================
Why Use This "FuTech: MACD Crossovers Advanced Alert Lines" Indicator ?
a) Clear Visuals : The vertical lines provide clear and easy-to-spot signals for MACD crossovers and Golden/Death Crosses.
b) Customizable : Adjust settings for your personal trading strategy, whether you're focusing on short-term momentum or long-term trend shifts.
c) Supports Decision Making : With its advanced line plotting and customizable features, this indicator helps you make quicker and more informed trading decisions.
=============================================================
How to Use:
a) MACD Crossovers: Look for green lines to signal potential buying opportunities (when the MACD line crosses above the signal line) and red lines for selling opportunities (when the MACD line crosses below the signal line).
b) Golden Cross / Death Cross: Use the blue lines to confirm when a positive trend may begin (Golden Cross) and purple lines to warn when a negative trend may start (Death Cross).
=============================================================
Conclusion:
"FuTech: MACD Crossovers Advanced Alert Lines" indicator combines two powerful technical analysis tools, the MACD and Golden/Death Crosses, to provide clear, actionable signals on your chart.
By customizing the appearance of these signals and combining them with your trading strategy, you can enhance your decision-making process and improve your trading outcomes.
=============================================================
Thank you !
Jai Swaminarayan Dasna Das !
He Hari ! Bas Ek Tu Raji Tha !
=============================================================
Asset Correlation with XAU/USD (Macroeconomics X Gold)This Pine Script calculates the correlation of economic assets with gold (XAU/USD), including indicators such as the DXY, the S&P 500, the US 10-year yield (US10Y), oil (USOIL), the USD/JPY pair, and the AUD/USD pair. The goal is to analyze the impact of these variables on the price of gold, particularly in a macroeconomic context.
Main Features:
Asset Monitoring: The script monitors 24-hour variations of six key assets (DXY, S&P 500, US10Y, USOIL, USDJPY, AUDUSD), along with the price of XAU/USD.
Percentage Change Calculation: The percentage change for each asset is calculated based on the previous day's close, compared to the most recent 5-minute close.
Direction Determination: The direction of each asset (whether the change is positive, negative, or neutral) is calculated and used to determine the potential impact on the price of gold.
Interactive Tables: The results of directions, variations, and impacts are displayed in a table on the screen, with each asset being evaluated by its weight (influence on gold) and direction. The table also includes arrows indicating the impact of each asset on the price of gold, based on the correlation between them.
Dominance: The overall dominance of gold is calculated based on the weights and directions of the assets, generating a result that reflects whether gold is trending upwards or downwards due to the other observed assets. An arrow symbol indicates whether the dominance is positive (⬆️), negative (⬇️), or neutral (—).
Table Details:
The table displays the monitored assets, their assigned weights, the direction (arrows up, down, or neutral), the percentage change of each asset, and the impact of these assets on the price of gold.
The last column shows the "dominance" overall, with the final impact of these assets on the direction of the XAU/USD price.
Usage: This script is useful for traders and analysts who want to monitor how different macroeconomic factors (such as the value of the dollar, the S&P 500, US interest rates, oil prices, and currency pairs) influence the price of gold. It provides a clear view of how these assets correlate with gold, helping to make more informed decisions in the market.
For a better view of the table, right-click on >> visual order >> bring it to the top.

Sniper Entry Indicator, Crypto, Forex, Indices, I ndicator Description:
Momentum & Sideways Market Detector is a powerful TradingView indicator that combines the strengths of RSI (Relative Strength Index) and Moving Averages to identify market momentum and detect sideways movements. This versatile tool is designed to work effectively across various asset classes, including Cryptocurrencies, Forex pairs, Gold, and major stock indices like Nifty, BankNifty, Finifty, and Midcap.
Key Features:
Momentum Detection: The indicator uses RSI to gauge market momentum, highlighting overbought and oversold conditions to signal potential reversals by Displaying strength on the chart, above 90 it will be overbought and check for reversal trade, below 10 it will be oversold and check for the long opportunity.
Sideways Market Identification: It utilizes a combination of Moving Averages to detect low-volatility periods and sideways market conditions, helping traders avoid choppy markets. Area or label highlighted by blue means it is sideways, you can ignore entries in this zone.
Multi-Asset Compatibility: The indicator is optimized to perform well on diverse asset classes, including Crypto, Forex, Commodities, and Equity Indices, making it a versatile tool for traders of all types. It is compatible with Indian indices as well giving trader opportunity to see live trade with strike price entry and sl. It also trails the SL when reached the first target.
Customizable Parameters: Users can adjust RSI and Moving Average settings to suit their trading style and timeframe preferences.
Settings:
Stock/Option (Whether you want to trade Sport or it's option, if unchecked it will look for expiry of the stock option, month, and year, user also needs to provide the call and put option)
Spot Symbol (I have provided some of the spot symbols for the selection which will help him to configure it's F&O )
Backtest Day (User can backtest the data by changing the day to previous lookback, it is a very good feature to test the results.)
Remove lines from the table (If table is too long, i have provided the option to remove some of the lines from the table, provide number to remove the lines)
This indicator is a must-have for traders looking to enhance their strategy by accurately identifying market conditions and adapting their trades accordingly.

RSI PRECISION v.3RSI PRECISION v.3 (MACD, StochRSI, SMA Signals)
Developed by Giorgos Protonotarios (2021-2023)
RSI PRECISION is an alternative to the classic Relative Strength Index (RSI). The indicator aims to enhance the classic RSI and make it more accurate on longer timeframes. Additionally, the indicator works as an advanced signaling machine, offering five different categories of leading trading signals. RSI PRECISION is an ideal tool for analyzing highly volatile markets, such as cryptocurrency and small-cap stocks.
In this 3rd version, the core formula remains the same, however, there are new trading signals and a great number of new parameters. Traders have the opportunity to fully customize the indicator according to their needs.
What is new ?
The RSI formula remains the same, however, there are additional features:
• Selected StochRSI signals
• Low-timeframe SMA signal (<60 minutes)
• High-timeframe SMA signal (>60 minutes)
• SMA on the RSI PRECISION readings
• Ability to customize everything in settings (tooltips added)
Note: You can turn off any trading signal by unselecting it in Settings>Style.
□ NEW TRADING SIGNALS (v.3)
■ SELECTED STOCHRSI SIGNALS
The selected StochRSI signals are visualized by a cross (+) on the top and bottom of the indicator. The settings for StochRSI are the classic 8.5.3 (customizable). By default, the crossover is generated when StochRSI crosses above 25, and the crossunder when StochRSI crosses below 75.
(i) Bullish StochRSI cross
• Symbol: Cross (+) on the Top
• Event: StochRSI crosses above level 25
(ii) Bearish StochRSI cross
• Symbol: Cross (+) on the Bottom
• Event: StochRSI crosses below level 75
■ SMA CROSSOVERS (LOW/HIGH TIMEFRAMES)
These trading signals are generated when the price of an asset crosses above or below a preset SMA.
There are two different SMAs, one shown on low timeframes, and one on high timeframes. You can adjust the periods for both, by default 200 periods.
(i) Low-Timeframe SMA Cross (<60 minutes)
• Symbol: Bullish (↥) on the top of the indicator and bearish (↧) on the bottom
• Event: The price crosses above or below the selected SMA on low timeframes
(ii) High-Timeframe SMA Cross (>60 minutes)
• Symbol: Bullish (↥) on the top of the indicator and bearish (↧) on the bottom
• Event: The price crosses above or below the selected SMA on high timeframes
■ SMA LINE ON RSI PRECISION
This is just a simple SMA line on the RSI PRECISION readings. By default, it is set at 50 periods.
• SMA Line (blue-dashed)
You can turn it off by unselecting it in Settings>Style.
□ OLDER TRADING SIGNALS
The 3rd version of RSI PRECISION also includes all previous signals.
■ RSI PRECISION CROSSES
This signal corresponds to a bullish/bearish RSI PRECISION cross. By default, it is 5 for a bullish crossover and 100 for a bearish crossunder. These numbers are indicative and can be customized.
(i) Bullish RSI PRECISION Cross
• Symbol: Green arrow (▲) on the Top
• Event: RSI PRECISION crosses above level 5
(ii) Bearish RSI PRECISION Cross
• Symbol: Red arrow (▼) on the Bottom
• Event: RSI PRECISION crosses below level 100
■ MACD CROSSOVER SIGNALS
The MACD signals are visualized by a green/red dot (•). The default settings are the standard MACD settings (12,6,9).
(i) Bullish MACD cross
• Symbol: Green Dot (•) on the Top
• Event: MACD crosses above its signal line
(ii) Bearish MACD cross
• Symbol: Red Dot (•) on the Bottom
• Event: MACD crosses below its signal line
NOTE: In lower timeframes, MACD generates too many signals. You can switch off “MACD BULLISH & BEARISH CROSSOVERS” by clicking on ‘SETTINGS’, then ‘STYLE’, and then unselecting ‘Bullish MACD Cross’ and ‘Bearish MACD Cross’.
■ GOLDEN/DEATH CROSSES (SMA CROSSOVERS)
The cross of the 50-day moving average above the 200-day moving average is called a golden cross, and it is considered a bullish signal. The cross of the 50-day moving average below the 200-day moving average is called a death cross, and it is considered a bearish signal.
The Golden/Death crosses are visualized by (X). By default, 50 periods for the fast SMA and 200 periods for the slow SMA (both are customizable).
(i) Bullish SMA Cross
• Symbol: (X) on the Top
• Event: The fast SMA crosses above the Slow SMA
(ii) Bearish RSI Cross
• Symbol: (X) on the Bottom
• Event: The fast SMA crosses below the Slow SMA
□ More about the Indicator
■ MISSION
Enhancing the classic Relative Strength Index (RSI) and making it more accurate on longer timeframes, during choppy market conditions, and especially near market tops/bottoms.
■ OBJECTIVES
(1) Creating a better RSI that works as an “All-in-one” indicator
(2) Identifying overbought/oversold market levels in a simple and user-friendly manner
(3) Making precise calculations near market tops and bottoms, where price volatility is always booming
(4) Making precise calculations on longer timeframes (weekly, monthly) where the classic RSI readings are hardly readable
(5) Offering five different categories of trading signals (RSI, StochRSI, MACD, Golden/Death Crosses, SMAs) in a single indicator
■ RSI PRECISION CALCULATIONS
The RSI PRECISION formula consists of three (3) different components:
(a) Relative Strength Index component (the classic RSI)
(b) Periodic Price Volatility component (PPV, essential)
(c) RSI Volatility component (less important)
RSI PRECISION FORMULA ADJUSTMENTS
(i) CLASSIC RSI
This measurement corresponds to the classic RSI. If the other two components of the formula are set to zero (0%), then by entering 100% here, the RSI PRECISION becomes identical to the classic RSI.
-By default, 100%
(ii) PERIODIC PRICE VOLATILITY -PPV
The Periodic Price Volatility (PPV) is an advanced measurement of price volatility and an essential component of the core RSI PRECISION formula. You can easily adjust the weight of PPV in the formula.
-By default, 100%
(iii) RSI VOLATILITY
This is an extra measurement of volatility. This time the focus is exclusively on periodic RSI volatility, not on price volatility.
-By default, 5%
■ FINAL THOUGHTS
RSI PRECISION v.3 is an improved RSI indicator offering five leading trading signals. Everything is combined in one place to create an all-in-one TA tool. I have been using it as my only indicator for quite some time.
As always, happy trading, and remember, if you want to rule the world, create code, not war.
□ Giorgos Protonotarios,
Financial Analyst, Building Web
(October 5th 2023)

CE - 42MACRO Fixed Income and Macro This is Part 2 of 2 from the 42MACRO Recreation Series
However, there will be a bonus Indicator coming soon!
The CE - 42MACRO Fixed Income and Macro Table is a next level Macroeconomic and market analysis indicator.
It aims to provide a probabilistic insight into the market realized GRID Macro regimes,
track a multiplex of important Assets, Indices, Bonds and ETF's to derive extra market insights by showing the most important aggregates and their performance over multiple timeframes... and what that might mean for the whole market direction.
For traders and especially investors, the unique functionalities will be of high value.
Quick guide on how to use it:
docs.google.com
WARNING
By the nature of the macro regimes, the outcomes are more accurate over longer Chart Timeframes (Week to Months).
However, it is also a valuable tool to form an advanced,
market realized, short to medium term bias.
NOTE
This Indicator is intended to be used alongside the 1nd part "CE - 42MACRO Equity Factor"
for a more wholistic approach and higher accuracy.
Methodology:
The Equity Factor Table tracks specifically chosen Assets to identify their performance and add the combined performances together to visualize 42MACRO's GRID Equity Model.
For this it uses the below Assets:
Convertibles ( AMEX:CWB )
Leveraged Loans ( AMEX:BKLN )
High Yield Credit ( AMEX:HYG )
Preferreds ( NASDAQ:PFF )
Emerging Market US$ Bonds ( NASDAQ:EMB )
Long Bond ( NASDAQ:TLT )
5-10yr Treasurys ( NASDAQ:IEF )
5-10yr TIPS ( AMEX:TIP )
0-5yr TIPS ( AMEX:STIP )
EM Local Currency Bonds ( AMEX:EMLC )
BDCs ( AMEX:BIZD )
Barclays Agg ( AMEX:AGG )
Investment Grade Credit ( AMEX:LQD )
MBS ( NASDAQ:MBB )
1-3yr Treasurys ( NASDAQ:SHY )
Bitcoin ( AMEX:BITO )
Industrial Metals ( AMEX:DBB )
Commodities ( AMEX:DBC )
Gold ( AMEX:GLD )
Equity Volatility ( AMEX:VIXM )
Interest Rate Volatility ( AMEX:PFIX )
Energy ( AMEX:USO )
Precious Metals ( AMEX:DBP )
Agriculture ( AMEX:DBA )
US Dollar ( AMEX:UUP )
Inverse US Dollar ( AMEX:UDN )
Functionalities:
Fixed Income and Macro Table
Shows relative market Asset performance
Comes with different Calculation options like RoC,
Sharpe ratio, Sortino ratio, Omega ratio and Normalization
Allows for advanced market (health) performance
Provides the calculated, realized GRID market regimes
Informs about "Risk ON" and "Risk OFF" market states
Visuals - for your best experience only use one (+ BarColoring) at a time:
You can visualize all important metrics:
- GRID regimes of the currently chosen calculation type
- Risk On/Risk Off with background colouring and additional +1/-1 values
- a smoother GRID model
- a smoother Risk On/ Risk Off metric
- Barcoloring for enabled metric of the above
If you have more suggestions, please write me
Fixed Income and Macro:
The visualisation of the relative performance of the different assets provides valuable information about the current market environment and the actual market performance.
It furthermore makes it possible to obtain a deeper understanding of how the interconnected market works and makes it simple to identify the actual market direction,
thus also providing all the information to derive overall market health, market strength or weakness.
Utility:
The Fixed Income and Macro Table is divided in 4 Columns which are the GRID regimes:
Economic Growth:
Goldilocks
Reflation
Economic Contraction:
Inflation
Deflation
Top 5 Fixed Income/ Macro Factors:
Are the values green for a specific Column?
If so then the market reflects the corresponding GRID behavior.
Bottom 5 Fixed Income/ Macro Factors:
Are the values red for a specific Column?
If so then the market reflects the corresponding GRID behavior.
So if we have Goldilocks as current regime we would see green values in the Top 5 Goldilocks Cells and red values in the Bottom 5 Goldilocks Cells.
You will find that Reflation will look similar, as it is also a sign of Economic Growth.
Same is the case for the two Contraction regimes.
******
This Indicator again is based to a majority on 42MACRO's models.
I only brought them into TV and added things on top of it.
If you have questions or need a more in-depth guide DM me.
GM

CE - 42MACRO Equity Factor Table This is Part 1 of 2 from the 42MACRO Recreation Series
The CE - 42MACRO Equity Factor Table is a whole toolbox packaged in a single indicator.
It aims to provide a probabilistic insight into the market realized GRID Macro Regime, use a multiplex of important Assets and Indices to form a high probability Implied Correlation expectation and allows to derive extra market insights by showing the most important aggregates and their performance over multiple timeframes... and what that might mean for the whole market direction, as well as the underlying asset.
WARNING
By the nature of the macro regimes, the outcomes are more accurate over longer Chart Timeframes (Week to Months).
However, it is also a valuable tool to form a proper,
market realized, short to medium term bias.
NOTE
This Indicator is intended to be used alongside the 2nd part "CE - 42MACRO Yield and Macro"
for a more wholistic approach and higher accuracy.
Due to coding limitations they can not be merged into one Indicator.
Methodology:
The Equity Factor Table tracks specifically chosen Assets to identify their performance and add the combined performances together to visualize 42MACRO's GRID Equity Model.
For this it uses the below Assets, with more to come:
Dividend Compounders ( AMEX:SPHD )
Mid Caps ( AMEX:VO )
Emerging Markets ( AMEX:EEM )
Small Caps ( AMEX:IWM )
Mega Cap Growth ( NASDAQ:QQQ )
Brazil ( AMEX:EWZ )
United Kingdom ( AMEX:EWU )
Growth ( AMEX:IWF )
United States ( AMEX:SPY )
Japan ( AMEX:DXJ )
Momentum ( AMEX:MTUM )
China ( AMEX:FXI )
Low Beta ( AMEX:SPLV )
International ex-US ( NASDAQ:ACWX )
India ( AMEX:INDA )
Eurozone ( AMEX:EZU )
Quality ( AMEX:QUAL )
Size ( AMEX:OEF )
Functionalities:
1. Correlations
Takes a measure of Cross Market Correlations
2. Implied Trend
Calculates the trend for each Asset and uses the Correlation to obtain the Implied Trend for the underlying Asset
There are multiple functionalities to enhance Signal Speed and precision...
Reading a signal only over a certain threshold, otherwise being colored in gray to signal noise or unclear market behavior
Normalization of Signal
Double Normalization of Signal for more Speed... ideal for the Crypto Market
Using an additional Hull Moving Average to enhance Signal Speed
Additional simple Background coloring to get a Signal from the HMA
Barcoloring based on the Implied Correlation
3. Equity Factor Table
Shows market realized Asset performance
Provides the approximate realized GRID market regimes
Informs about "Risk ON" and "Risk OFF" market states
Now into the juicy stuff...
Visuals:
There is a variety of options to change visual settings of what is plotted and where
+ additional considerations.
Everything that is relevant in the underlying logic which can improve comprehension can be visualized with these options.
More to come
Market Correlation:
The Market Correlation Table takes the Correlation of all the Assets to the Asset on the Chart,
it furthermore uses the Normalized KAMA Oscillator by IkkeOmar to analyse the current trend of every single Asset.
(To enhance the Signal you can apply the mentioned Indicator on the relevant Assets to find your target Asset movements that you intend to capture...
and then change the length of the Indicator in here)
It then Implies a Correlation based on the Trend and the Correlation to give a probabilistically adjusted expectation for the future Chart Asset Movement.
This is strengthened by taking the average of all Implied Trends.
Thus the Correlation Table provides valuable insights about probabilistically likely Movement of the Asset over the defined time duration,
providing alpha for Traders and Investors alike.
Equity Factors:
The table provides valuable information about the current market environment (whether it's risk on or risk off),
the rough GRID models from 42MACRO and the actual market performance.
This allows you to obtain a deeper understanding of how the market works and makes it simple to identify the actual market direction,
makes it possible to derive overall market Health and shows market strength or weakness.
Utility:
The Equity Factor Table is divided in 4 Sections which are the GRID regimes:
Economic Growth:
Goldilocks
Reflation
Economic Contraction:
Inflation
Deflation
Top 5 Equity Factors:
Are the values green for a specific Column?
If so then the market reflects the corresponding GRID behavior.
Bottom 5 Equity Factors:
Are the values red for a specific Column?
If so then the market reflects the corresponding GRID behavior.
So if we have Goldilocks as current regime we would see green values in the Top 5 Goldilocks Cells and red values in the Bottom 5 Goldilocks Cells.
You will find that Reflation will look similar, as it is also a sign of Economic Growth.
Same is the case for the two Contraction regimes.
This whole Indicator, as well as the second part, is based to a majority on 42MACRO's models.
I only brought them into TV and added things on top of it.
If you have questions or need a more in-depth guide DM me.
Will make a guide to all functionalities if necessity becomes apparent.
GM
