חפש סקריפטים עבור "GOLD"

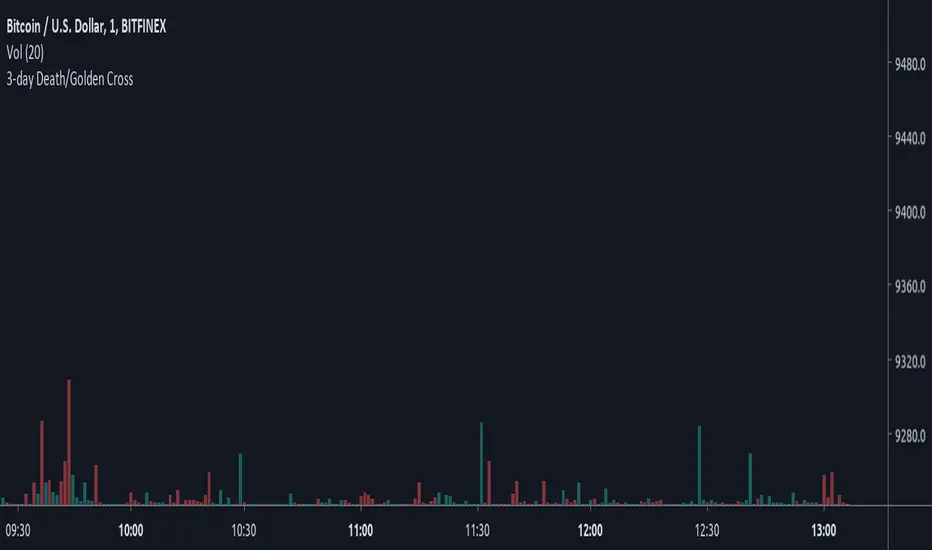
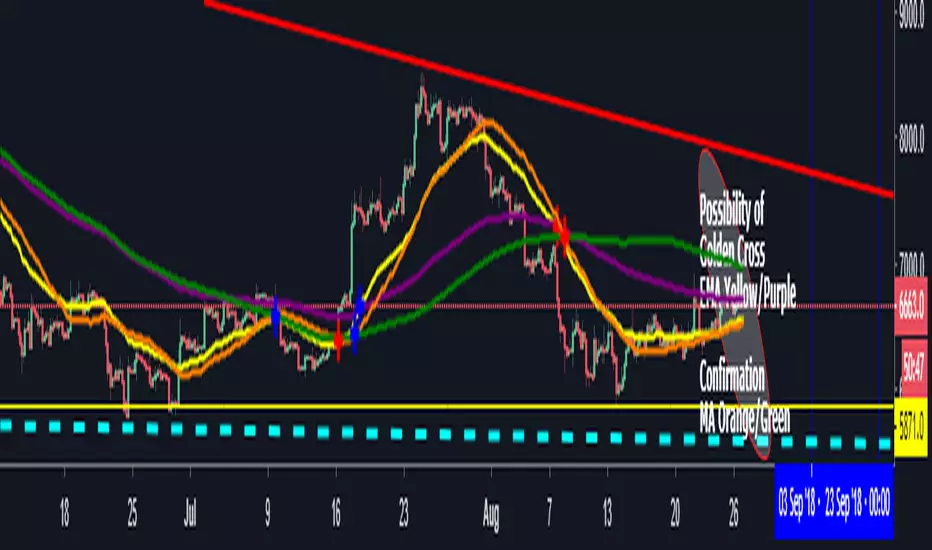
3-day Death/Golden CrossBased on Crypto Crew University youtube video, "Emergency Update: New Bitcoin GOLDEN Cross Emerges (btc crypto live news market price today 2019 ta" (19 June 2019), comparing 2015 and 2018 bull runs.
TrendMaster Gold, v. 6.2xTrendMaster Gold
The ultimate refinement of last year’s TrendMaster system, TrendMaster Gold takes deep pattern recognition to a new level tracking over 20 indicators triggering seven decision gates to trade in a Renko-smoothed charting environment. Optimized for higher returns over a wider range of instruments (see returns below), you are invited to trial this market-mirroring engine. Subscribers receive full breakdown for fine-tuning results to their market favorites while avoiding bot traps. Reach out by message to get your free trial. We are always available for questions, comments, and suggestions. There’s always room for improvement.
Results Chart
The backtests below show 1-year returns against a Buy and Hold (B+H) approach for 40 of the world’s top traded instruments (as measured by price volume or similar indicator). The TrendMaster system was run on the top 10 instruments in each of four major markets: Equities, ETFs, Cryptocurrencies, and Forex. All tests were on a 30min chart, set to Renko “Traditional” blocks (because TradingView does not support realtime alerts from ATR-based charts). Block size was set proportionately to price to give the instrument positive results, but there was no “cherry-picking”. (In fact, changing time frames would have produced even better returns in some cases, but it seemed best to use a consistent measure.) Subscribers to the system receive a full, step-by-step breakdown on how to customize the parameters to get the best from their favorite markets.
(For each instrument, you see listed its Symbol (name), Profit % (annual return using TrendMaster Gold), Winning Trade % (being “right”), ProfitFactor (Ratio of money won to money lost), Max Draw Down % (point of worst % loss during the year), and B+H (how much the asset would have returned with no trades, via "buy-and-hold" )...)
TrendMaster Gold
Settings: 30 min, Traditional Renko box, over 1 year (June 1, 2018 - June 1, 2019)
EQUITIES
Symbol Profit % Trade % PF Max DrDn B + H
AMZN 2,212 62 6.6 3 7
AAPL 158 49 3.7 5 5
TSLA 8,263 57 5 6 -38
FB 179 47 3 8 -7
BABA 247 56 3.4 9 -23
BYND 348 67 17.9 6 140
MSFT 224 58 6.8 3 28
AMD 171 50 2.6 13 0
NFLX 2,132 55 5.2 11 -5
BA 560 54 4.9 3 97
ETFs
Symbol Profit % Trade % PF Max DrDn B + H
SPY 275 64 5.5 3 4
QQQ 865 62 6.1 3 5
EEM 278 60 5.3 2 0
IWM 783 61 6.1 2 -3
HYG 21 51 2.7 1 0.5
EWZ 798 58 5.6 5 26
LQD 12 54 2 1 6
EFA 121 61 4.5 2 -7
FXI 391 63 5.4 3 -15
XLF 200 58 3.4 5 -3
CRYPTOCURRENCIES
Symbol Profit % Trade % PF Max DrDn B + H
BTC/USD 3 million 55 4.7 8 -8
ETH/USD 2 million 52 4.9 21 -54
XRP/USD 6 million 52 4 13 -16.6
LTC/USD 222,000 54 3 13 13
BCH/USD 380,000 54 4.6 28 -5
EOS/USD 147,000 55 2.7 20 13
BNB/USDT 2 million 54 4.4 14 143
BSV/USD 334,000 65 18 5 -8
XLM/USD 34 million 51 2.8 12 34
ADA/USD 48,000 64 7 6 3
FOREX PAIRS
Symbol Profit % Trade % PF Max DrDn B + H
EUR/USD 13 41 1.3 5 -4
USD/JPY 3 37 1.1 4 -1
AUD/USD 24 43 1.4 4 10
USD/CAD 20 43 1.7 4 3
GBP/USD 36 46 1.8 2 -5
NZD/USD 21 47 1.6 2 -6
GBP/JPY 40 42 1.6 2 -6
EUR/JPY 18 54 3.2 2 -5
AUD/JPY 47 44 1.8 5 -10
EUR/GBP 17 46 1.7 4 0.1

(YEK) Combo(YEK) Combo is a combination of several indicators (listed below). You can use them together or one by one. Just click settings, and choose which of them to be shown.
Here are the indicators included in this script:
- Ichimoku Cloud
- Bollinger Bands
- Moving Average 1
- Moving Average 2 (In case of detecting golden crosses or death crosses)
- Exponential Moving Average
- T3 Tillson
- MavilimW
Enjoy!

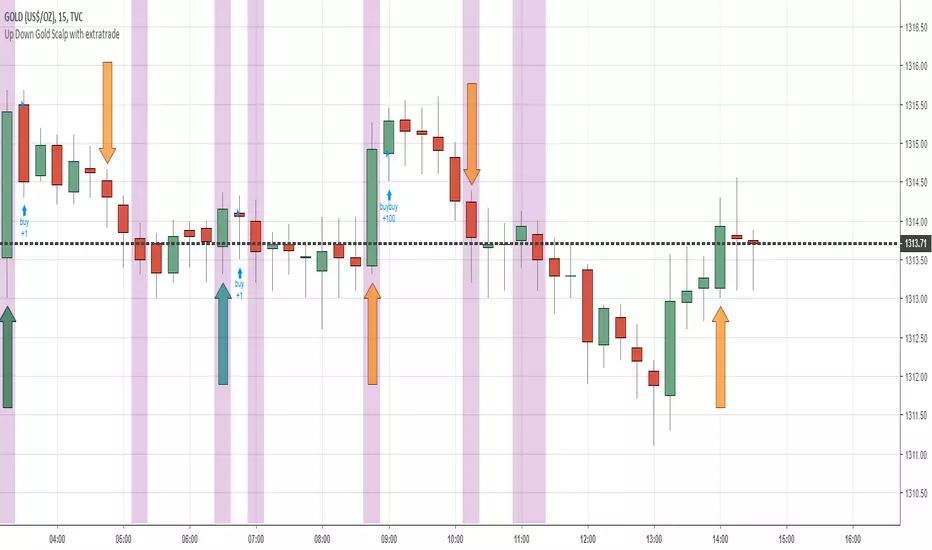
Up Down Gold Scalp with extratrade Only for Gold USD in 15 Min
No Stop Loss!
Delivered with optimum parameters
Have fun
PpSignal Fibonacci Golden Zonefibonacci golden zone is a popular forex system for buy or sell fibo areas.
Buy in 38 fibo zone and sell in 61 fibo zone. when the fiboncci trend is up, the fill color between 28 and 61 is yellow, when the trend is down the fibonacci color is red.
a recommended use some move average with some oscillator for a find the trend.
Move average recommended serhttps://www.tradingview.com/script/guQUYY7J-PpSignal-Trend-Follow/
Oscillator see
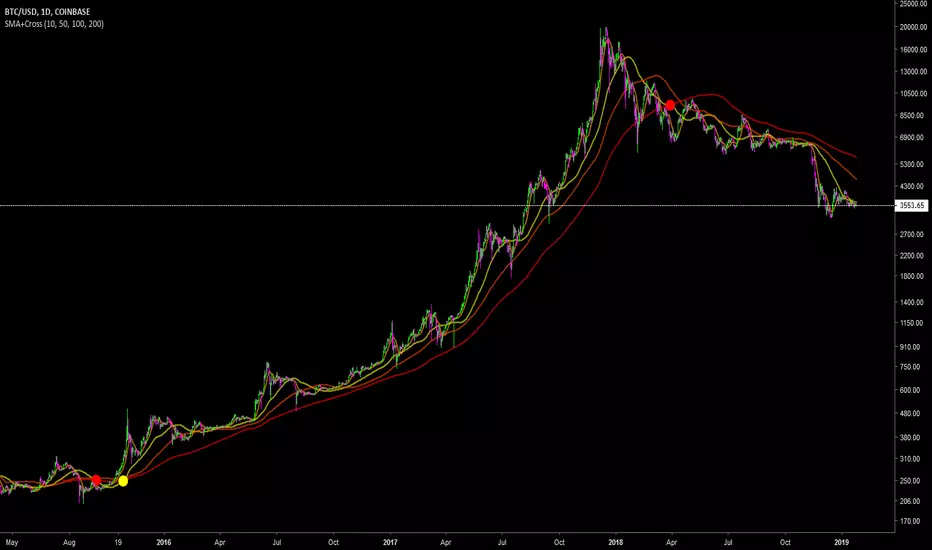
Harry's SMA combo with Death and Golden CrossThis is my first script. Simple one but useful nonetheless.
Good for long term trade setups based on SMA50-200 Death and Golden Cross.
Let me know if you want some modifications which can improve it further.
Chao..
Autofib + Golden Pocket, v1- Auto plots Fibonacci levels on chart
- Fills Golden Pocket zone
- Option to display only low to high or high to low fibs, or both
- Option to include wicks, or just measure candle bodies
- Ability to set alerts at each fib level
- Message for access

Ichimoku + Death/Golden Cross + MAsSwiss-army knife indicator for traders. Renders Ichimoku and MAs (short term and long term). Also points Death Cross and Golden Cross formations on 5/10 MA.

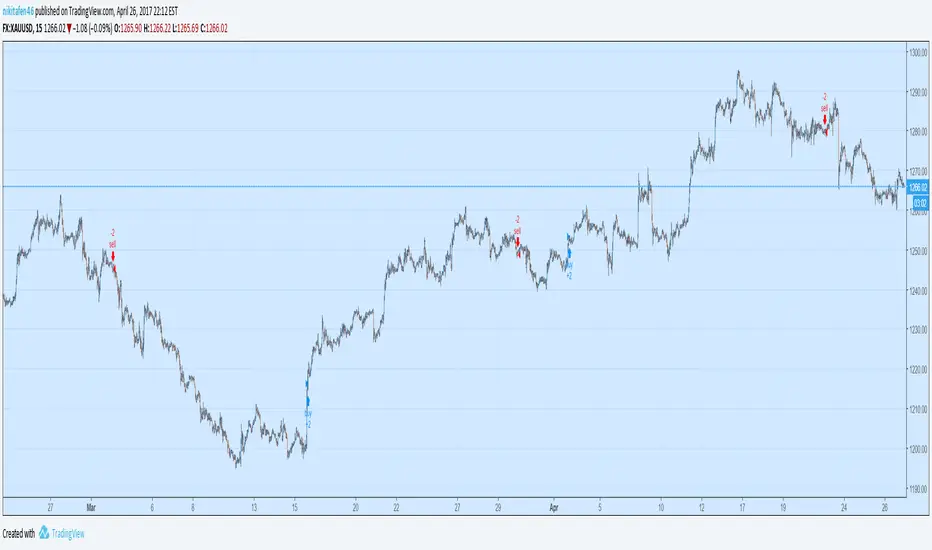
Top Finder 1.1Top Finder is an automated cryptocurrency signals and analysis tool which uses a complex algorithm involving multiple indicators, trends, and cross-overs including proprietary formulas developed in-house to predict the top or near top price of cryptocurrencies. It also works well on stocks, gold, oil and forex, even soybeans!
Top Finder is the sister indicator to Bottom Finder (check my other scripts).
Signal strength is represented by height/color of the signal. (Taller signal = stronger signal).

Bottom Finder 2.2Release 2.2
Bottom Finder is an automated cryptocurrency signals and analysis tool which uses a complex algorithm involving multiple indicators, trends, and cross-overs including proprietary formulas developed in-house to predict the bottom price of cryptocurrencies. It also works well on stocks, gold, oil and forex!
Future updates will be included onto this script.
Tip #1: In a bear market, the Half height (fuchsia colored) signals should be ignored by the risk averse trader. In a bull market feel free to buy on both the signals.
Tip #2: In a bear market, use a smaller percent gain instead of TSSL to set your exit targets. In a bull do the opposite, using TSSL (or method of your choice) to exit.

Bottom Finder 2.1Release 2.1 Final!
Bottom Finder is an automated cryptocurrency signals and analysis tool which uses a complex algorithm involving multiple indicators, trends, and cross-overs including proprietary formulas developed in-house to predict the bottom price of cryptocurrencies. It also works well on stocks, gold, oil and forex!

Ichimoku Cloud strategy for gold marketThis strategy is based on main ichimoku features (Leading span , conversion line and base line) compared to cloud conditions.
I indicated all possibilities in this indicator and strategy decision is based on crossing factors of each main line through two other line confirmations.

Tick Tick BoomThis is THE tick tick boom method from the GOLD MINDS group!
When we enter a trade the line changes color.
If your charts are not in UTC time then you can adjust the UTC offset time. If your charts are in UTC-9 then set this to 9, if you are in UTC+1 set this to -1, if your charts are un UTC then set this to 0.
I noticed daily pivots, support, and resistance levels are pretty useful targets here. Uncheck the box if you would like to see the levels.
Many thanks to Dimitri Wallace!

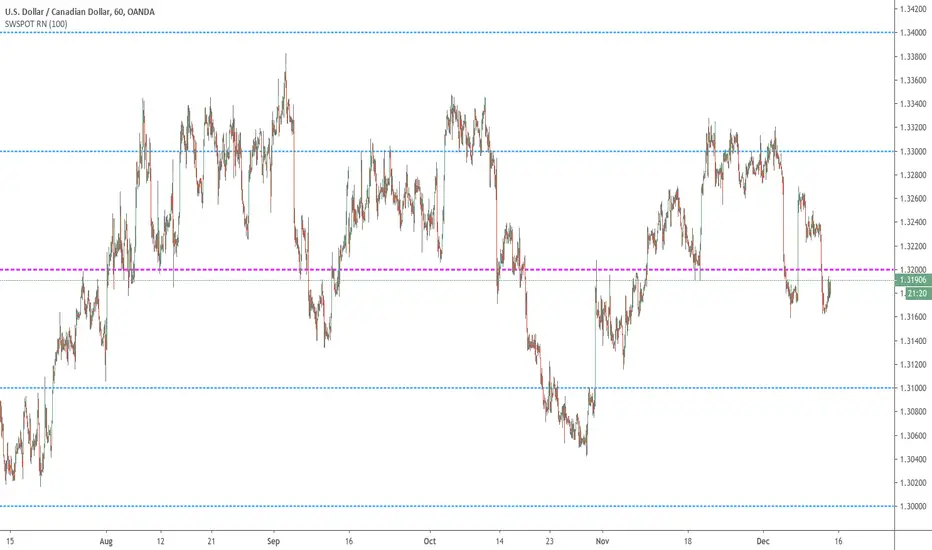
Sweetspot Gold RN - by JustUncleLThis is an alternate version of "Sweetspot Gold R4" that does not use sublevels. Removing the sublevels allows more efficient use of the plots (TV script has a limit of 64 plot calls).
This works well for all currency pairs I've tested, most commodities, and most stocks.
The indicator plots the so called "round price levels" or "00" levels. For example, 1.4000, 1.4400, 1.4500.
It automatically calculates the levels for each chart time frame. Optionally you can manually select main level size (in pips)
Use this indicator as a guidance to a better mapping of Support/Resistance levels on the chart. Next time you draw Support/Resistance lines, if they coincide with round price levels, you have got a excellent S/R level to work with!
cooltoyz: The Turtle SurferThis strategy applies the old tested turtle trading strategy, defining a channel and riding the trend, but
It has some twists tough, to make it adapt on the fly to changes in market conditions.
Since all parameters can be adjusted from the inputs, the strat can (and needs) to be fine tuned for the current values of an asset. for example, for gold values, it works good for years. for btc, it breaks for dates with values under 1500$. that's because 1% of 800 is not the same as 1% of 2400$..... Yeah, data fitting, i know all that....
Some of the parameters work well only for low volatility markets, others are designed exactly to capture volatility. So the parameters must be tested, turned on-off to see how well they do. The default values ARE NOT a generic good for all, most surely.
The Turtle Surfer moves slowly, but it's prepared to rabbit jump in/out if some moon/doom event shows up without invitation :)
If you want to play with the strat, start with all checkboxes off, then turn on/off each one and see the results for the asset you want.
I have had good results in xau, btc and eth

Generation 6 Massive Trend Following for Gold (Note at bottom!)Making this one an open script for you people.
Commission_value = 0.02 is the same as a 50 pip gold spread.
Start capital $10,000.
1.00 lots = 1 contract on this.
Trend establishment with the 600 period moving average, trend continuation with the crossover/crossunder.
This strategy is great for finding trends on XAUUSD.
Side note: if anyone knows MQL4 coding language for MT4, please let me know, I would like to see the results of this strategy over a period of several years rather than the several months of data that Tradingview Provides. Please PM me, I want to see how profitable this code is over a long period of time. Thank you, and enjoy.
15 Minute Gold Trend-Following StrategyThis is the main strategy that I will be forward testing on demo for a month or two, then making it an EA in MetaTrader4
You can see the code for yourself this time, all the strategy is, is a crossover of various moving averages.
Commission included, $10,000 account.
Results over the past 3 months, beginning in January 2017.

MAster Gold StrategyVersion 3 for you guys, just add to favorites and you can use.
Only 36 trades since 2017, since that is when the backtesting began.
I made the commission more realistic, now it is about 37 pips per trade.
Only works on gold, (XAUUSD).
Trend Following as you can see.
1 contract size, 1 trade at a time, good proof of how being correct less than a third of the time can still bring you in a lot of profits.
Essentially, the net profit will be close to $8000, or 80%, as a long position on XAUUSD is currently running, and when it is closed, the profit will go up.
Imagine that, 72% profit on your account in 3 months?
(Hint: add the indicator to your favs, pull up the 30 minute gold chart)

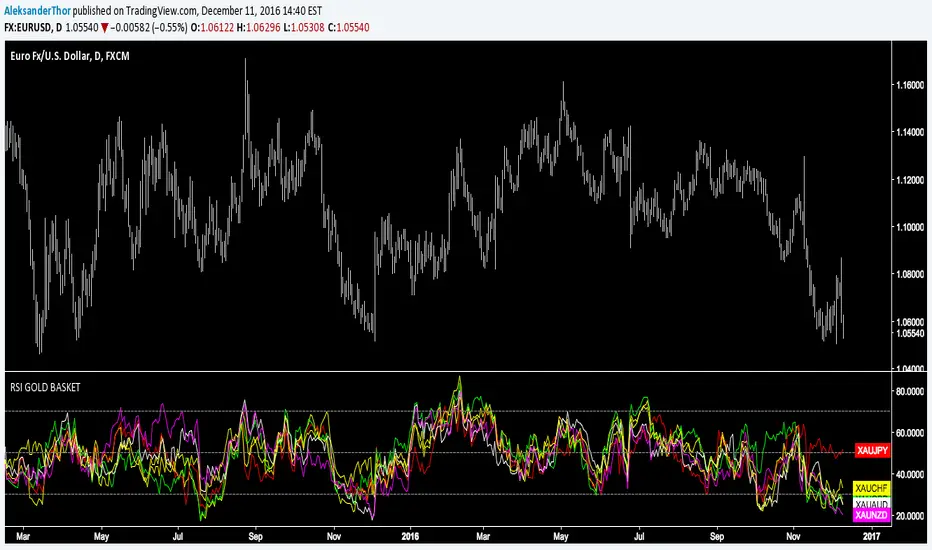
RSI Gold Basket"Using gold as a common denominator measure of a group of currencies enables one to rank these different currencies by order of performance" - Currency Trading and Intermarket Analysis by Ashraf Laïdi
Correlation of chart symbol to different Index-ETF-currencyScript plots correlation of chart symbol to a variety of indexes, symbols, equities. ** Original idea was to find Bitcoin correlation, which I did not. Built in correlations are: Nikie, DAX, SPY, AAPL, US Dollar, Gold, EURUSD, USDCNY, EEM, QQQ, XLK, XLF, USDJPY, EURGBP
