Professional Signals & Overlays [R2D2]Professional Signals & Overlays: The Institutional Edge
Introduction
In high-frequency markets, clarity is power. The Professional Signals & Overlays Suite is an all-in-one technical architecture designed to strip away noise and present only high-probability actionable data.
This is not just a signal generator; it is a complete market "Head-Up Display" (HUD). By synthesizing trend structure (Smart Trail), statistical extremes (Reversal Zones), and momentum classifications (AI Scoring), this toolkit allows you to align your execution with the dominant flow of capital—whether you are scalping volatility or riding multi-week trends.
Visual Legend: How to Read the Signals
We have engineered a visual hierarchy to help you gauge signal strength in milliseconds:
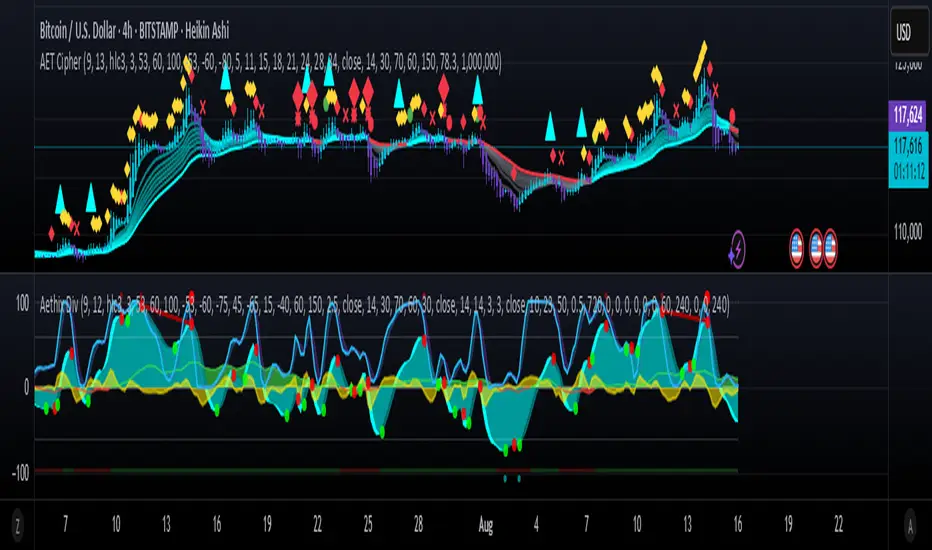
Normal Signals (▲ / ▼)
Visual: Red or Green box with a White Triangle .
Meaning: A standard trend breakout has occurred. The Smart Trail has flipped, and momentum is aligning with the new direction.
Strong Signals (+)
Visual: Red or Green box with a White Plus (+) .
Meaning: A "High Confluence" event. The breakout is backed by Volume Anomalies and RSI Momentum . These signals statistically have a higher probability of sustained follow-through.
AI Classification (Optional Mode)
Visual: Numbers 1, 2, 3, 4 appear instead of symbols.
Meaning:
4: Strong Trend (High Volume + High Momentum).
3: Active Trend.
2: Normal/Weak Trend.
1: Contrarian/Reversal setup.
Exit Signals (x)
Visual: Tiny Blue or Orange "X".
Meaning: Price has hit a statistical extreme (Reversal Zone). Consider taking partial profits.
Core Architecture
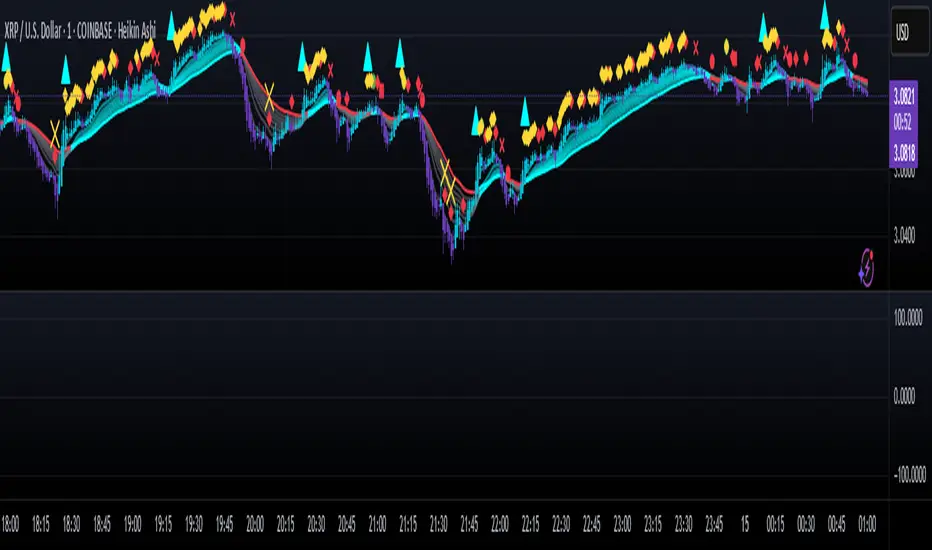
1. The Smart Trail (Dynamic Support/Resistance)
The backbone of the system. This step-line algorithm adjusts automatically to market volatility.
Green Line: Hold Longs / Trailing Stop Support.
Red Line: Hold Shorts / Trailing Stop Resistance.
Strategy: As long as price remains above the Green Trail, the trend is bullish. Do not fight it.
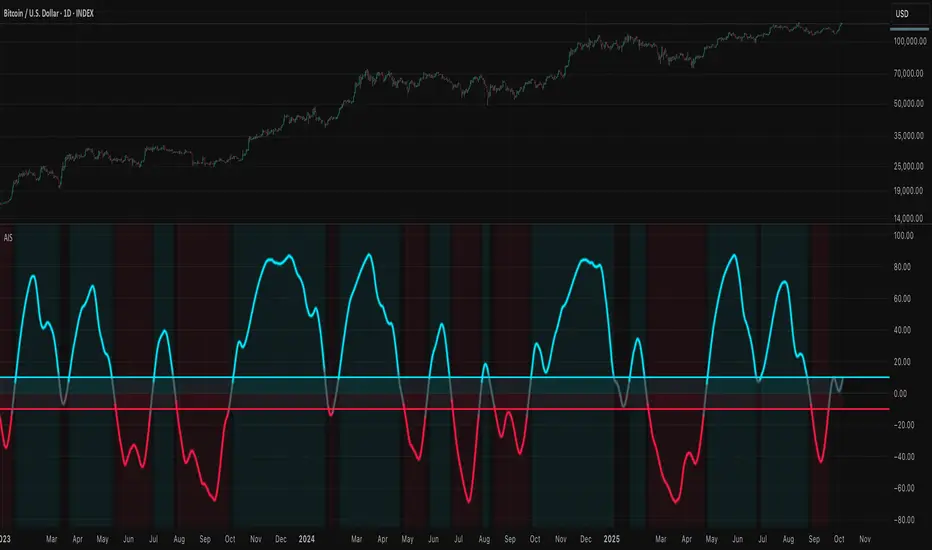
2. Reversal Zones (Volatility Bands)
Markets breathe. The Reversal Zones (shaded outer bands) visualize the statistical limits of standard price movement.
Usage: When price pierces the Upper (Red) or Lower (Green) zones, the move is overextended. Watch for "Exit (x)" signals here to lock in gains or look for mean-reversion entries.
3. Professional Dashboard (Real-Time Telemetry)
Located in the bottom corner, this panel provides a health check on the asset:
Trend Strength: Momentum velocity (0-100%). >50% is Bullish control.
Volatility: Annualized volatility percentage. High values = reduce position size.
Squeeze: Detects when volatility is compressing (Bollinger Bands narrowing). A "True" (Red) reading warns of an explosive move imminent.
Volume Sentiment: Measures the ratio of Bullish vs. Bearish volume flow over the last 14 periods.
Effective Trading Strategies
Strategy A: The Trend Continuation (Confirmation)
Best for: Crypto Breakouts, Forex Trends, Growth Stocks
Wait for a Green Box Signal (Triangle or +).
Confirm that the Dashboard "Trend Strength" is Green (>50%).
Confirm that "Volume Sentiment" is positive.
Execute Long.
Stop Loss: Place just below the Smart Trail. Trail it upwards as the line moves.
Strategy B: The Squeeze Breakout
Best for: Indices (SPX, NAS100) and Consolidating Coins
Watch the Dashboard for the "Squeeze" metric to turn RED . This means energy is building.
Wait for a "Strong Signal (+)" to print, signaling the release of that energy.
Enter in the direction of the signal. These moves are often violent and fast.
Settings Guide
Optimal Sensitivity (Default: 12): Lower (5-8) for Scalping, Higher (14-20) for Swing Trading.
Show AI Classification: Toggle this ON to see the raw strength score (1-4) instead of the geometric symbols.
Signal Mode: Switch to "Contrarian" to catch reversals at the edges of the zones (best for ranging markets).
Risk Disclaimer: Trading involves substantial risk. The Professional Signals & Overlays suite is a tool for technical analysis, not a guarantee of future performance. Always use stop losses and manage your risk responsibly.
אינדיקטור Pine Script®