Crypto Correlation MatrixA crypto correlation matrix or table is a tool that displays the correlation between different cryptocurrencies and other financial assets. The matrix provides an overview of the degree to which various cryptocurrencies move in tandem or independently of each other. Each cell represents the correlation between the row and column assets respectively.
The correlation matrix can be useful for traders and investors in several ways:
First, it allows them to identify trends and patterns in the behavior of different cryptocurrencies. By looking at the correlations between different assets, traders can gain insight into the intra-relationships of the crypto market and make more informed trading decisions. For example, if two cryptocurrencies have a high positive correlation, meaning that they tend to move in the same direction, a trader may want to diversify their portfolio by choosing to invest in only one of the two assets.
Additionally, the correlation matrix can help traders and investors to manage risk. By analyzing the correlations between different assets, traders can identify opportunities to hedge their positions or limit their exposure to particular risks. For example, if a trader holds a portfolio of cryptocurrencies that are highly correlated with each other, they may be at greater risk of losses if the market moves against them. By diversifying their portfolio with assets that are less correlated with each other, they can reduce their overall risk.
Some of the unique properties for this specific script are the correlation strength levels in conjunction with the color gradient of cells, intended for clearer readability.
Features:
Supports up to 64 different crypto assets.
Dark/Light mode.
Correlation strength levels and cell coloring.
Adjustable positioning on the chart.
Alerts at the close of a bar. (Daily timeframe or higher recommended)
חפש סקריפטים עבור "crypto"

Crypto Terminal [Kioseff Trading]Hello!
Introducing Crypto Terminal (:
The indicator makes use of cryptocurrency data provided by vendor INTOTHEBLOCK.
NOTE: The cryptocurrency on your chart must be paired with USD or USDT. Data won't load otherwise - possibly transient. For instance, BTCUSD or BTCUSDT, ETHUSD or ETHUSDT.
Provided datasets:
Twitter Sentiment Data
Telegram Sentiment Data
Whale Data (i.e. % of Asset Belonging to Whales)
$100,000+ Transactions
Bulls/Bears (Bulls Buying | Bears Selling)
Current Position PnL (Currently Open Positions for the Coin are Retrieved and Plotted. Data is Split into Currently Profitable Positions, Losing Positions, and B/E Positions)
Average Balance
Holders/Traders Percentage (Addresses are Retrieved and Classified as Holding Accounts or Trader Accounts)
Correlation
Futures OI
Perpetual OI
Zero Balance Addresses
Flow (Money Inflow & Outflow)
Active Addresses
Average Transaction Time
Realized PnL (Addresses with Realized Profits, Realized Losses, and B/E)
Cruisers
A few more data points are provided.
Additionally, you can plot the values of any dataset in a pane below price.
Below are images of plottable data; different cryptocurrencies will be shown for each example (:
Twitter sentiment data.
Assess this data lightly; difficult to confirm accuracy.
Telegram sentiment data.
Assess this data lightly; difficult to confirm accuracy.
Percentage of asset belonging to whales.
$100,000+ transactions (volume oriented)
Bulls buying; bears selling.
Current positions at profit; current positions at loss; current positions at breakeven.
Average balance.
Percentage of asset belonging to traders; percentage of asset belonging to holders.
Asset's 30-interval correlation to BTC.
Perpetual open interest.
Zero-balance addresses.
Flows.
Active addresses.
Average transaction time.
Addresses at realized profit; addresses at realized loss; addresses at breakeven.
Cruiser data.
Futures open interest.
Naturally, this data isn't provided for every cryptocurrency; NaN values are returned in some instances.
Table 1
I provided three data tables, which load independently, so you don't have to change plotted data to access values.
Table 2
Lastly, you can create a 10-asset crypto index and run calculations against it.
The image shows an example.
I'll update this script with additional calculations/data in the near future. If you've any suggestions - please let me know!
Enjoy (:

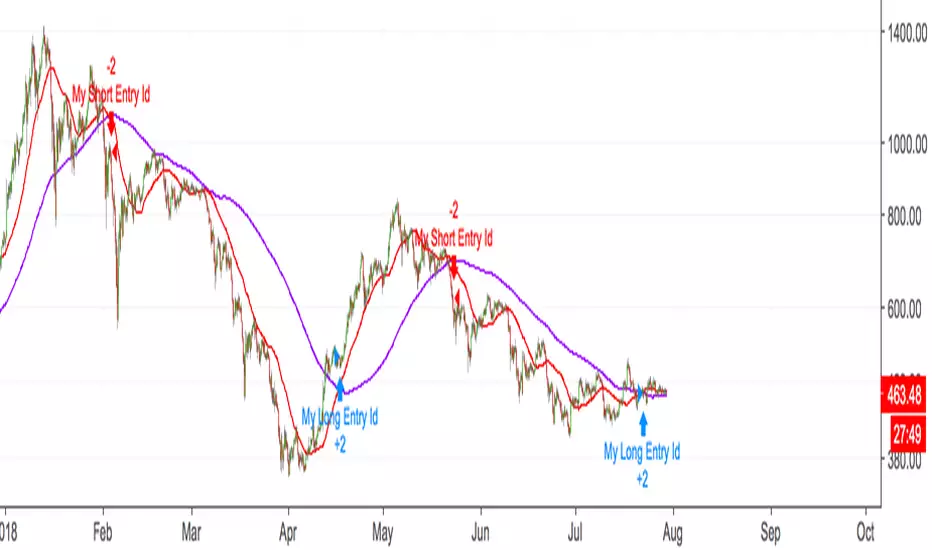
The CryptoPlayground FrameworkThe CryptoPlayground Framework & Built-in Strategy Analysis
CryptoPlayground’s Framework provides the community an “executive assistant” that teaches traders how to trade The CryptoPlayground Framework ‘LIVE’. Producing a structured approach with a built in Strategy where traders to learn the method as the trade pans out.
Cryptoplayground’s Framework pays close attentions to fundamental as well as technical analysis . In this publication we will be breaking down the simplicity of what makes the framework “tick”.
Traders take notice how the price moves between the double blue sets of lines marked #cpf, these are some of the most important aspects of the CryptoPlayground Framework. Let’s jump in and explain.. The built-in Fibonacci Retraction add+ tool is the method we use to frame up our technical analysis . Helping CryptoPlayground traders define support and resistance levels of extreme relevance and more importantly defining #cpf Optimal Trade Entries. Traders trading from these blue lines produce high probability low risk trade ideas and opportunities.
How it’s done: Drawn using (plot) the high and low of a particular time-frame (depicted by your chart settings, or set using custom time settings in the indicator settings itself). These high and low points have many names and can be defined in many ways. as basic as it comes these are knows as pivot points . Using these points, Cryptoplayground Framework draws levels respecting Fibonacci ratios. Reminder that CryptoPlayground is a framework to structure trades, these levels are supposed to change. Using a time series to do so allows traders to define their style of trading, whether intra, daily or swing.
When the CryptoPlayground Framework is “about to change” we call this a liquidity event and most commonly in crypto it’s some sort of purge in the direction that traders are willing to buy up to or sell to.
🤖 Technicals in the code:
// Fibonacci Retraction
Length(x)
Source( close)
Out = fib retract
High(close, x)
Low(close, x)
plot(…
Plotshape (fib = high - low within time series multiples by ratio)
Alert condition(
crossunder(close, x)…. ; candle close below x indicating our liquidity event)
Plot ( purge
Plotshape (purge
CryptoPlayground Framework traders have the added improvement of RSI add+ , as a further confirmation, defining whether bulls are in control, bears are in control or when defining overbought or oversold thresholds. Represented by the larger blue and grey dotted channel, traders are able to use this visual tool and add it to their analysis.
🤖 Technicals in the code:
//RSI+
Based on in-build RSI , where RSI is (rsiSource, rsilength)
RSI = close
Legth = x
Condition = x
Condition = x
plot ( plot as size 2 dotted lines on the chart )
CryptoPlaygound “Helper Tool” is an Exponential Moving Average function to determine bullish and bearish conditions, we are able to remain emotionless through the trade. As well as, when to book profit and the sign of a possible reversal. Backtested for optimal crypto conditions, the degree of weighted decrease provides observations faster for a volatile market. CryptoFramework makes these calculations available on all time frames or customisable for the style of trader. CryptoPlayground used a time settings (constant) that makes traders pay themselves first.
🤖 Technicals in the code:
// bullish . bearish
Length = ( x )
Source( close )
Out = ( ema )
High ( close, x )
Low ( close, x )
Last = ( high , x )
Last = ( low , x )
Bearish = cross ( close , x )
Bullish = cross ( close , x )
Plotshape ( bullish , style
Plotshape ( bearish , style
// Long.short exit
Ema = x
SMA = x
EMA ( close, x )
SMA ( close , x )
RSI (close , x )
Using the CryptoPlayground Framework, the description below will describe, How to trade a “Fake Out - Purge Event“, also known as “Purge and Revert”
Set alert: Purge Event (This way you will get notified, this type of trade can be ruined with emotions and therefor it is best traded with structure)
Purge Events indicate one of 3 things, a breakout/liquidity run or raid, a reach for liquidity or a possible fake-out. Purge Events are represented by the label “Purge”.
In this example, CryptoPlayground Framework has structured a trade example during a “Fakeout - Purge Event” to the sell side.
Further visual description provided.
On chart elaboration and description on how to trade
1. Set Alert Condition - Liquidity Purge Alert
(using TradingView alert settings)
2. Set entry at #cpf Entry 1 :
This is a level 2 entry.
Scaling down chart time-frame will create a further "Optimal Trade Entry
".
3. Pay yourself, book profit, move your stop loss up or to break even.
The trade is now risk free and you’ve made a successful trade.
The rest is just added bonus.
4. Opportunity to consider re-enter, add partials previously taken signified by bullish Label and Rejection of Fibonacci ratios.
5. Trade is complete, you paid yourself, lowered risk, added more into a trade and entered hopefully using a limit order :)
Blue horizontal lines marked #cpf are your long and short optimal trade entry location, where trading from these regions carry less risk. These blue lines are what the Cryptoplayground Framework refers to as Optimal Trade Entries.
In the opposition's corner we have a mirrored x2 blue horizontal lines marked #cpf these are your targets. Traders are made aware of a "liquidity Event" at these levels when bulls or bears are in control.
White "time to book profit" labels are there to remind traders to pay themselves first. Having Entered from #cpf a CryptoPlayground Trader would at this point take profit and move stop loss into profit or break even. Using this method further reduces downside and removes the risk from your original entry position. Leaving the CryptoPlayground Framework Trader with a "Risk Free Trade".
White "exit trade" indicates extreme limits of oversold and overbought conditions where it is likely that a reversal will take place as buyers or sellers increase in the respected direction.
Grey horizontal dotted lines indicate levels at which price action is likely to respect. In that regard, price action will make moves from these levels and to these levels.
If you have any questions please reach out, the script is invite-only.
If you wish to have access please reach out.
Hope you enjoy, please comment or message! 🙏

Crypto grabberSo, its my first position in crypto (and not only crypto) bots series. What we have there.. program writting on Pine script language what can analyse market data of any trading instrument and signalise to enter the deal. Its next versions will update. Trade system based on my x-volume indicator.In central part of system is analyzing volume accumulation and distribution process which decide good and bad time for investing.
So some important points:
1) In time when you change timeframe or trading symbol bot analise all bars history. The number of trading (signal) candles in the analysis history is marked in black.
2) The percent of profitable signals is marked in blue.
3) Total profit points are marked in green.
4) Total bars in history are marked in red.
For better indicator vision you can turn off non interesting plots in settings menu.
There is two kinds of alerts: Buy alert and Sell alert. Set it once per bar close or every minute ( because the best way you must open the deal at 20 sec before bar close ).
This trading system is great for creating a profitable trading portfolio. Try it yourself to find exchanges and cryptocurrencies with profitable historical views. For example, the KRAKEN exchange trades well: XBTCAD, XBTUSD in 30-45 min timeframe.
I will do better settings in new versions of this bot. Waiting your likes)

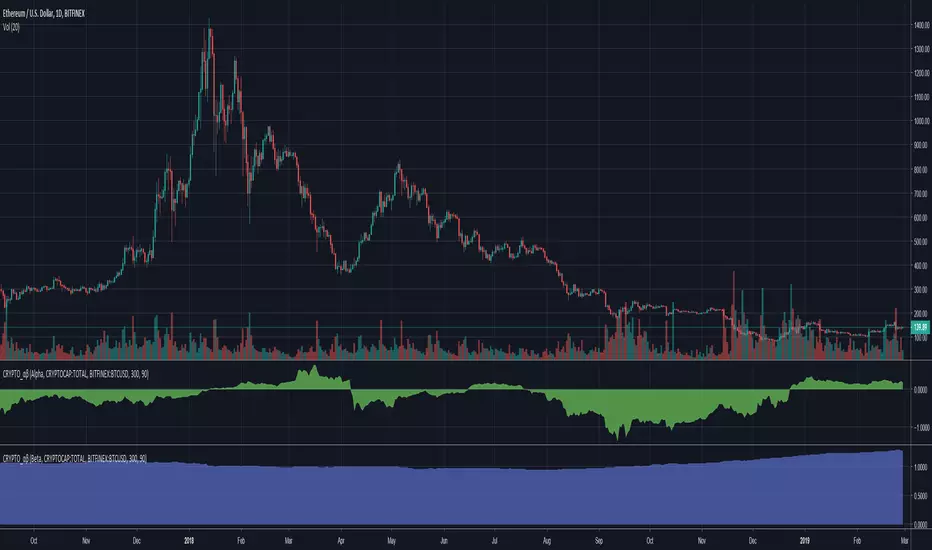
Cryptocurrency α / β (Alpha and Beta)Alpha and Beta for cryptocurrency. Custom input for other symbols.
Cryptocurrency Profitability Rankings PRO Customisable ListA good cryptocurrency may multiply your earnings - with the same effort.
This indicator helps crypto traders to find the trading securities that suit their profitability and volatility preference.
This indicator calculates and generate a ranking of profitability from a user-defined list of cryptocurrencies, based on MACD cycles within user-defined time span.
Multiple time frames: This indicator is designed for day trading, so suggested time frames are: 3m, 5m, 15m, 30m, 1H. Users can try other time frames (< 1D) if they find it useful.
This is PRO version of Cryptocurrency Profitability Rankings with Popular List, developed based on Profitability Meter for Day Trading PRO
PRO Version advanced functions:
Customisable(User-Defined) Cryptocurrency List
Option to select Open or Close price as start point for calculation.
Flexible Time Span Type: Hours and Bars, besides Days
More statistics options: Display price change(%) of latest rising/falling MACD cycle
Free trial for two weeks: Please leave a comment asking for a trial, you should get access within 48 hours. In case it doesn't work, please message the author.
Format Configuration:
Profitability Threshold: a percentage of price movement within a MACD cycle that a user thinks can be used to define profitability, defval: 0.8%.
Select open or close as start point: which can affect the results greatly, as difference between open and close can be significant, especially for big time interval.
Statistics Options
timeSpan: time span for statistics
timeSpanType: time span type for statistics
User-defined cryptocurrencies list: up to 10 items
About Customisable List of Cryptocurrency:
At present, in Pine Language, there is no method to plot a string input variable. Therefore, fixed handles are used to represent each symbol name, eg. "Sym_10". User need to remember the order of the list or refer to "Format".
Make sure to input correct tiers, eg. "BITFINEX:ETHUSD"
Related Indicators:
Profitability Meter for Day Trading PRO - Calculating and evaluating individual trading security's profitability.
About Loading Time: It may take up to 2 minutes for your browser to load a new format setting, depending on the your computer and network speed.
List of the author's Indicators
www.tradingview.com
Disclaim: By using or requesting access to this indicator, you acknowledge that you have read and accepted that this indicator is for study purposes only and it does NOT guarantee you will make money.
I am not financial adviser and I am NOT responsible for any profits or losses you may incur by using this indicator!
Users should make their own decisions, carefully assess risks and be responsible for investment and trading activities.
The latest updates override the previous description. Please check the updates.
加密货币赢利潜力排行指标 PRO 自定义列表
优质的交易币种可能倍增你的收益-在付出同样的努力的情况下。
该指标基于Profitability Meter for Day Trading PRO开发,帮助加密货币交易员找到适合其赢利性和波动率偏好的币种。
该指标根据用户定义的时间跨度内的MACD周期,计算和比对用户自定义的一组虚拟货币,生成一个赢利潜力排名。
多时间维度:本指标为日内交易设计,因此建议使用时间维度:3m,5m,15m,30m,1H; 如果用户需要,也可以用于其他小于1D的维度。
免费试用两周:跟帖评论要求试用,您应该在48小时内获得访问权限。 如果没有获得,请私信开发者。
这是Cryptocurrency Profitability Rankings with Popular List的PRO版本
可自定义加密货币列表,上至10个
可选择开盘价或收盘价作为计算起点。
灵活的时间跨度类型:小时,蜡烛数,天数
更多统计选项:显示最近上涨/下跌的MACD周期的价格变动(%)
格式配置:
盈利能力阈值:用户自定义的MACD单次波动的可赢利的百分比,默认为0.8%
选择开盘或者收盘作为起点:这会对结果产生很大影响,因为开盘价和收盘价之间的差异可能很大,特别是在较大的时间维度。
统计选项
timeSpan:统计功能的时间跨度
timeSpanType:统计功能的时间跨度单位
用户自定义的加密货币列表输入栏
关于自定义的加密货币列表:
目前,在Pine Language中,不能打印字符串输入变量。 因此,使用顺序数字字符代表币种名称,例如。“Sym_10”。 用户需要记住其输入币种的顺序或随时参考“格式设置”中的顺序。
确保输入正确的交易所和币种名称,例如。 “BITFINEX:ETHUSD”。
相关指标:
日内交易盈利潜力指示仪PRO (Profitability Meter for Day Trading PRO):用于计算和评估单个交易品种的盈利能力
关于载入新设置:每次载入新的设置可能需要0-2分钟,取决于用户的电脑配置和网络速度。
试用开发者的其他指标
www.tradingview.com
免责声明:在要求获得本指标使用权之前以及在使用本指标之前,用户认可已经完全了解和接受:本指标仅供教育和研究目的, 它不提供任何赢利的可能性。
本指标的开发者并非专业投资顾问,因此不对用户的任何赢亏负责。
用户应独立判断,审慎评估并自负投资和交易风险!
最新更新会覆盖之前的说明。 请检查更新。

Crypto Mineable vs Not Mineable (24h Volumes Ratio)Hello traders!
This indicator shows you the dynamic ratio between 24h total volumes of the mineable and not mineable cryptocurrencies from TOP-40 according to coinmarketcap.com .
NOTE : The word "dynamic" means that I didn't have to hardcode 24h volumes from coinmarketcap.com for the presented cryptocurrencies - all values are updated automatically.
How to get access
You can buy it for only 30$ to get lifetime access
Happy Trading!
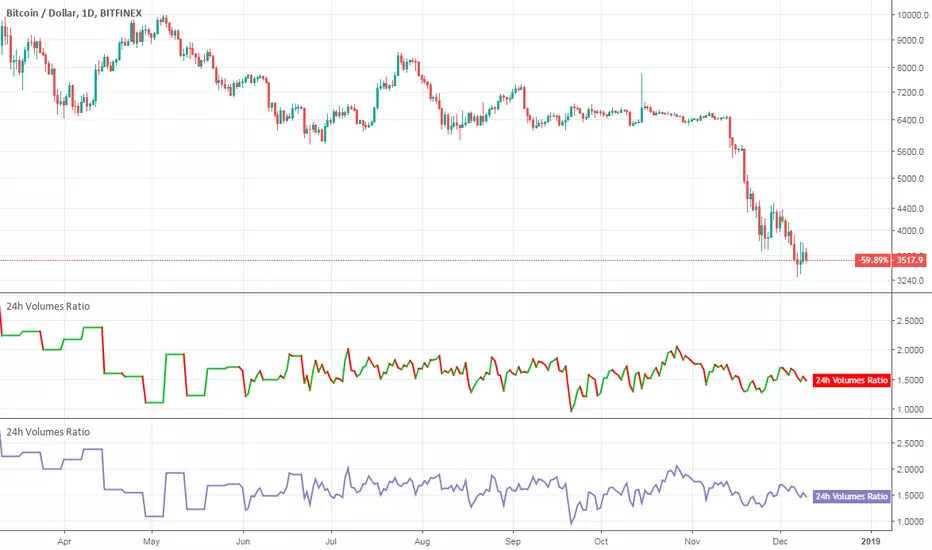
Crypto Mineable vs Not Mineable (24h Volumes)Hello traders!
This indicator shows you the dynamic 24h total volume charts of the mineable and not mineable cryptocurrencies from TOP-40 according to coinmarketcap.com .
NOTE : The word "dynamic" means that I didn't have to hardcode 24h volumes from coinmarketcap.com for the presented cryptocurrencies - all values are updated automatically.
How to get access
You can buy it for only 30$ to get lifetime access
Happy Trading!

Crypto Mineable vs Not Mineable (Market Caps Ratio)Hello traders!
This indicator shows you the ratio between market capitalizations of the mineable and not mineable cryptocurrencies from TOP-20 (excluding Bitcoin Cash).
NOTE : The market capitalizations are calculated dynamically . The word "dynamically" means that I did not hardcode supplies for presented cryptocurrencies.
What else is included
Alert for the specified positive % change
Alert for the specified negative % change
How to get access
Buy for only 25$ to get lifetime access to this indicator
Like and follow for more cool indicators!
Happy Trading!

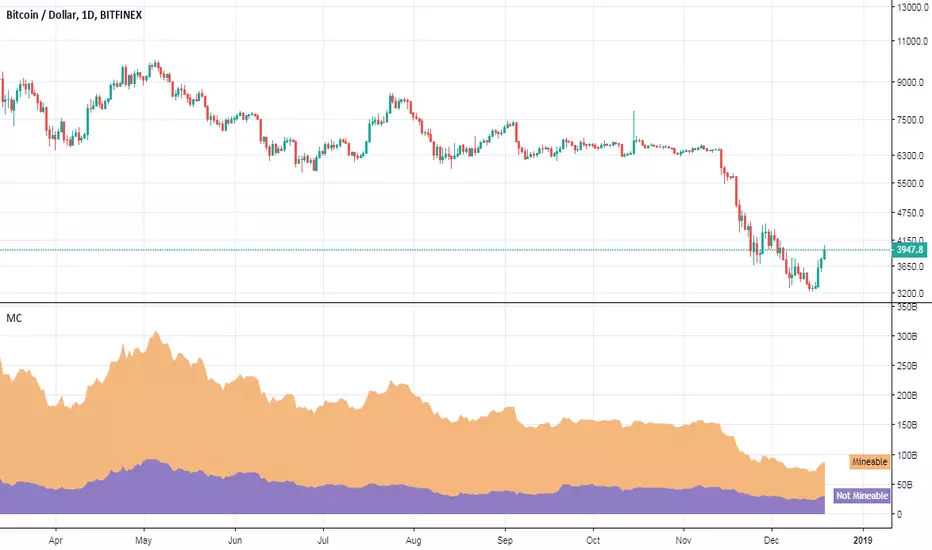
Crypto Mineable vs Not Mineable (Market Caps)Hello traders!
This indicator shows you the dynamic market capitalization charts of the mineable and not mineable cryptocurrencies from TOP-20 (excluding Bitcoin Cash).
NOTE : The word "dynamic" means that I did not hardcode supplies for the presented cryptocurrencies.
How to get access
Buy for only 25$ to get lifetime access to this indicator
Like and follow for more cool indicators!
Happy Trading!
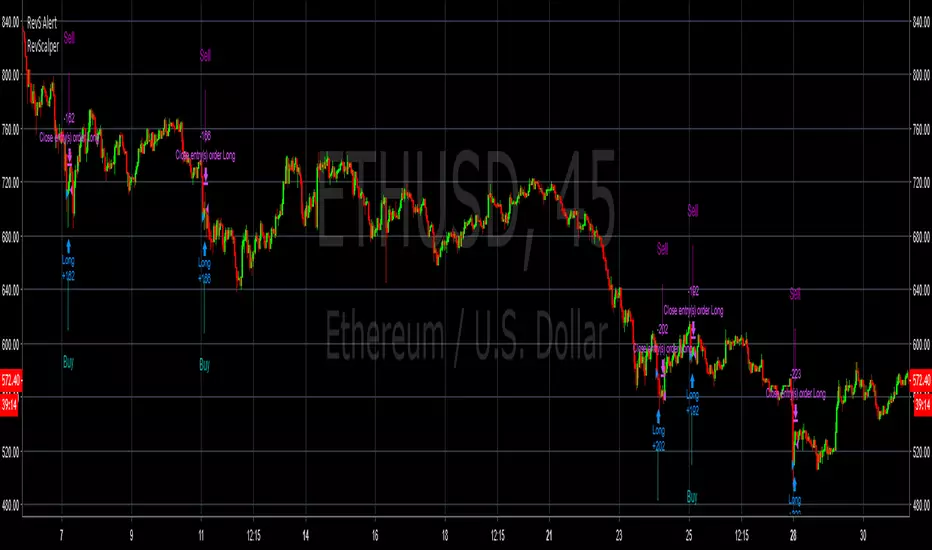
Crypto Reversal Scalper BacktesterThe script that will detect a reversal with two variables. The script will then attempt to scalp against the trend short-term.
Absolutely, NO REPAINTING. Can be used across crypto pairs.
You must use ONCE PER BAR for alerts! Yes it does work!
PM me for a trial.
Cost for the bot will be 0.01 BTC/month. Cost can be negotiable.
CryptoTrader - Simple and effective Ema CrossoverWorks well on 4h charts, ETHUSD,BTCUSD,and XRPUSD but can be tested also on other crypto's.
On those pairs no need of sofisticate scripts to trade.
Can add a trailing stop, but as you see works perfect as it is.
KISS (Keep It Simple Stupid).
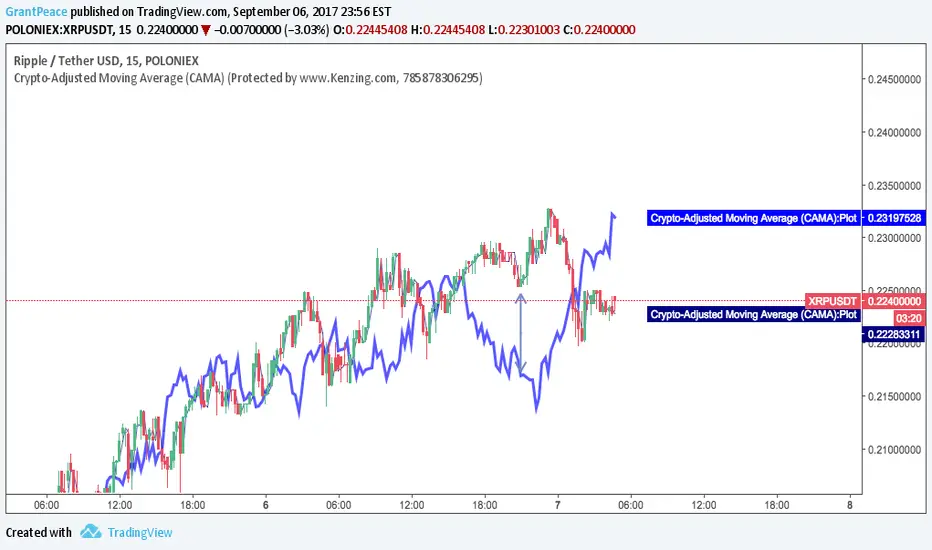
Crypto-Adjusted Moving Average (CAMA) (15 MINUTE CANDLESTICKS)This moving average is adjusted to give weight to the performance of the 6 largest Cryptocurrencies by market-cap: Bitcoin , Ethereum , Bitcoin Cash, Ripple, Litecoin, and Nem -0.95% Coin. The use of this indicator is to observe divergence between the price of the underlying asset (the crypto-currency you are interested in trading) and the rest of the cryptocurrency market.
If more cryptocurrencies go down while your observed currency goes up, the CAMA will sit lower. If more cryptocurrencies go up while your observed currency goes down, the CAMA will sit higher.
The indicator uses two input types:
"MA_Length" is the value given to the length of the moving average.
and
"CryptoFactor" which is the weight given to the movement of the Crypto-Index.
This modification to the moving average brings a fundamental element to your chart as it can be assumed, if all other crypto currencies move down, while the observed currency moves up quickly, that a breakout is occurring. This allows the trader to identify the breakout and react quicker to a MOONing asset.
Crypto Fear & Greed Score [Underblock]Crypto Fear & Greed Score - Methodology & Functioning
Introduction
The Crypto Fear & Greed Score is a comprehensive indicator designed to assess market sentiment by detecting extreme conditions of panic (fear) and euphoria (greed). By combining multiple technical factors, it helps traders identify potential buying and selling opportunities based on the emotional state of the market.
This indicator is highly customizable, allowing users to adjust weight parameters for RSI, volatility, Bitcoin dominance, and trading volume, making it adaptable to different market conditions.
Key Components
The indicator consists of two primary sub-scores:
Fear Score (Panic) - Measures the intensity of fear in the market.
Greed Score (Euphoria) - Measures the level of overconfidence and excessive optimism.
The difference between these two values results in the Net Score, which indicates the dominant market sentiment at any given time.
1. Relative Strength Index (RSI)
The indicator utilizes multiple RSI timeframes to measure momentum and overbought/oversold conditions:
RSI 1D (Daily) - Captures medium-term sentiment shifts.
RSI 4H (4-hour) - Identifies short-term market movements.
RSI 1W (Weekly) - Helps detect long-term overbought/oversold conditions.
2. Volatility Analysis
High volatility is often associated with fear and panic-driven selling.
Low volatility in bullish markets may indicate complacency and overconfidence.
3. Bitcoin Dominance (BTC.D)
Bitcoin dominance provides insights into capital flow between Bitcoin and altcoins:
Rising BTC dominance suggests fear as investors move into BTC for safety.
Declining BTC dominance indicates increased risk appetite and potential market euphoria.
4. Buying and Selling Volume
The indicator analyzes both buying and selling volume, ensuring a clearer confirmation of market sentiment.
High buying volume in uptrends reinforces bullish momentum.
Spikes in selling volume indicate panic and possible market bottoms.
Calculation Methodology
The indicator allows users to adjust weight parameters for each component, making it adaptable to different trading strategies. The formulas are structured as follows:
Fear Score (Panic Calculation)
Fear Score = (1 - RSI_1D) * W_RSI1D + (1 - RSI_4H) * W_RSI4H + (1 - Dominance) * W_Dominance + Volatility * W_Volatility + Sell Volume * W_SellVolume
Greed Score (Euphoria Calculation)
Greed Score = RSI_1D * W_RSI1D + RSI_4H * W_RSI4H + Dominance * W_Dominance + (1 - Volatility) * W_Volatility + Buy Volume * W_BuyVolume
Net Fear & Greed Score
Net Score = (Greed Score - Fear Score) * 100
Interpretation:
Above 70: Extreme greed -> possible overbought conditions.
Below -70: Extreme fear -> potential buying opportunity.
Near 0: Neutral market sentiment.
Trend Reversal Detection
The indicator includes two moving averages for enhanced trend detection:
Short-term SMA (50-periods) - Reacts quicklier to changes in sentiment.
Long-term SMA (200-periods) - Captures broader trend reversals.
How Crossovers Work:
Short SMA crossing above Long SMA -> Potential bullish reversal.
Short SMA crossing below Long SMA -> Possible bearish trend shift.
Alerts for SMA crossovers help traders act on momentum shifts in real-time.
Customization and Visualization
The Net Score dynamically changes color: green for greed, red for fear.
Users can adjust weightings directly from settings, avoiding manual script modifications.
Reference levels at 70 and -70 provide clarity on extreme market conditions.
Conclusion
The Crypto Fear & Greed Score provides a powerful and objective measure of market sentiment, helping traders navigate extreme conditions effectively.
🟢 If the Net Score is below -70, panic may present a buying opportunity.
🔴 If the Net Score is above 70, excessive euphoria may indicate a selling opportunity.
⚖️ Neutral values suggest a balanced market sentiment.
By customizing weight parameters and utilizing trend reversal alerts, traders can gain a deeper insight into market psychology and make more informed trading decisions. 🚀

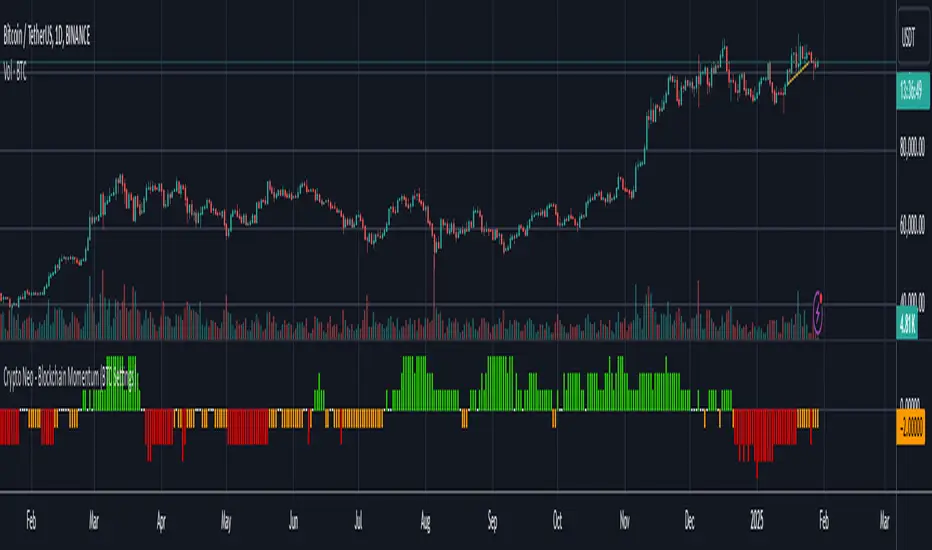
Crypto Neo - Blockchain Momentum (BTC Settings)The Crypto Neo - Blockchain Momentum indicator analyzes Bitcoin’s on-chain activity to gauge bullish or bearish trends. It combines multiple on-chain metrics and applies different moving average strategies to assess Bitcoin’s momentum.
This indicator is designed to track key blockchain data sources, such as:
Hash Rate
Active Addresses
Transactions per Second
New Addresses
Trader Behavior
Long-Term Holders (Cruisers)
Money Flow In/Out
Large Transactions Count
It processes these inputs using various Moving Average (MA) types, including SMA, EMA, DMA, to generate a Bullish Momentum Score, which is visually displayed on the chart.
How to Use:
Select MA Type – Choose between SMA, EMA, MIXMA, or DMA to determine how moving averages are applied.
Set MA Lengths – Adjust MA1 Length and MA2 Length to define short-term vs. long-term trend comparison.
Customize Data Sources – Select different on-chain metrics for the indicator to analyze.
Interpret the Bullish Momentum Score:
🟢 Green (Strong Bullish Momentum) – Bullish on-chain signals dominate.
🟡 Yellow (Moderate Bullish Momentum) – Weak bullish trend forming.
⚪ White (Neutral) – No clear trend.
🟠 Orange (Moderate Bearish Momentum) – Weak bearish signals emerging.
🔴 Red (Strong Bearish Momentum) – Bearish on-chain signals dominate.
Important Notes
This indicator does not generate trading signals but helps interpret blockchain trends for informed decision-making.
Since it relies on daily on-chain data, it is best used on the 1D timeframe for accurate readings.
Real-time calculations may vary slightly due to different bar update behaviors.
This indicator is very useful to confirm market turns early. Here are a few an example setups:
1. Back in 2019 on chain metrics started trending up after the market had dumped signaling a very good opportunity to buy.
2. During the 2021 bull market. When the market was forming a top, the on chain metrics started trending down indicating a risk to the downside.
Crypto Sectors Performance [Daveatt]IMPORTANT
⚠️ This script must be used on the Daily timeframe only.
OVERVIEW
This indicator brings the powerful sector analysis capabilities from velo.xyz/market's
Sector Performance chart to TradingView.
It enables traders to track and compare performance across the crypto market's major sectors, providing essential insights for sector rotation strategies and market analysis.
CALCULATION METHOD
The indicator calculates performance across six key crypto sectors: DeFi, Gaming, Layer 1s, Layer 2s, AI, and Memecoins.
For each sector, it computes a rolling percentage performance by averaging the performance of multiple representative tokens.
All sector performances are rebased to 0% at the start of each period, making relative comparisons clear and intuitive.
VISUALIZATION MODES
The script features two distinct visualization methods:
Plots Mode:
Displays continuous performance lines for each sector over time, ideal for tracking relative strength trends and sector momentum. Each sector has its own color-coded line with performance values clearly marked.
Bars Mode:
Presents current sector performance as vertical bars, offering an immediate visual comparison of sector gains and losses.
The bars are color-coded and labeled with exact percentage values for precise analysis.
For the "Bars Mode", I used the box.new() function
SECTOR COMPOSITION
Each sector comprises carefully selected representative tokens:
- DeFi: AAVE, 1INCH, JUP, MKR, UNI
- Gaming: GALA, AXS, RONIN, SAND
- Layer 1: BTC, ETH, AVAX, APT, SOL, BNB, SUI
- Layer 2: ARB, OP, ZK, POL, STRK, MNT
- AI: FET, NEAR, RENDER, TAO
- Memecoins: PEPE, BONK, SHIB, DOGE, WIFU, POPCAT
PERFORMANCE TRACKING
The indicator implements a rolling window approach for performance calculations.
Starting from 0% at the beginning of each period, it tracks relative performance with positive values indicating outperformance and negative values showing underperformance.
Multiple timeframe options (1W, 1M, 3M, 6M, and 1Y) allow for both short-term and long-term analysis.
APPLICATIONS
This tool proves invaluable for:
- Sector rotation analysis
- Identifying trending sectors
- Comparing relative strength
- Gauging market sentiment
- Understanding market structure through sector performance
Thanks for reading and for the support
Daveatt

Crypto Arbitrage Scanner [CryptoSea]Crypto Arbitrage Scanner
The Crypto Arbitrage Scanner is an advanced tool designed to help traders identify arbitrage opportunities across multiple cryptocurrency exchanges. With the ability to compare prices, volumes, and differences in price, this indicator is a must-have for any trader seeking to exploit cross-exchange inefficiencies in real time.
Key Features
Multi-Exchange Price and Volume Comparison: Tracks data from multiple major cryptocurrency exchanges, including BINANCE, COINBASE, KUCOIN, and others, allowing traders to easily compare prices and volume across platforms.
Customizable Difference Metrics: Allows users to toggle between displaying price differences in percentages or absolute dollar values, depending on the preferred metric for arbitrage analysis.
Sorting and Filtering Options: Includes user-defined sorting options to order the data by Price, Volume, or Difference, helping to prioritize potential arbitrage opportunities based on the trader's chosen criteria.
Difference and Volume Thresholds: Users can specify the minimum volume and price difference thresholds, ensuring that only significant arbitrage opportunities are highlighted.
Real-Time Alerts: Built-in alert conditions notify users when arbitrage opportunities exceed their defined price difference thresholds, helping traders respond instantly to market movements.
The Crypto Arb Scanner displays a table of prices, volumes, and price differences across selected exchanges. Each exchange is listed along with the current close price, volume, and the difference in price compared to the average price across all exchanges. Highlighting is used to indicate significant differences that may present arbitrage opportunities.
In the example below, we can see a highlighted opportunity in green showing that the price is below the user inputed thresold.
How it Works
Data Collection: Gathers real-time volume and price data from various exchanges using a streamlined process, allowing for a detailed comparison.
Average Price Calculation: Computes the average price across all valid exchanges to identify where price discrepancies occur, providing a clear picture of arbitrage potential.
Sorting Mechanism: Utilizes custom sorting based on user preferences, making it easy to quickly analyze and identify key opportunities.
Dynamic Highlighting and Alerts: Price differences that exceed user-defined thresholds are highlighted, and alerts can be triggered for these arbitrage opportunities, allowing for a timely response.
Application
Arbitrage Trading: The Crypto Arb Scanner is ideal for traders looking to exploit price differences across exchanges, enabling efficient arbitrage opportunities.
Market Efficiency Analysis: Offers insights into the consistency of prices across exchanges, which can help gauge the efficiency and liquidity of the markets being traded.
Customizable Alerts: Set alerts based on price differences or volume, allowing traders to stay informed about changes without constantly monitoring the markets.
The Crypto Arbitrage Scanner is a powerful addition to any trader's toolkit, offering comprehensive features to detect arbitrage opportunities with confidence. With real-time monitoring, customizable metrics, and a user-friendly interface, this tool allows traders to make informed decisions and capitalize on inefficiencies across exchanges.

Crypto Wallets Profitability & Performance [LuxAlgo]The Crypto Wallets Profitability & Performance indicator provides a comprehensive view of the financial status of cryptocurrency wallets by leveraging on-chain data from IntoTheBlock. It measures the percentage of wallets profiting, losing, or breaking even based on current market prices.
Additionally, it offers performance metrics across different timeframes, enabling traders to better assess market conditions.
This information can be crucial for understanding market sentiment and making informed trading decisions.
🔶 USAGE
🔹 Wallets Profitability
This indicator is designed to help traders and analysts evaluate the profitability of cryptocurrency wallets in real-time. It aggregates data gathered from the blockchain on the number of wallets that are in profit, loss, or breaking even and presents it visually on the chart.
Breaking even line demonstrates how realized gains and losses have changed, while the profit and the loss monitor unrealized gains and losses.
The signal line helps traders by providing a smoothed average and highlighting areas relative to profiting and losing levels. This makes it easier to identify and confirm trading momentum, assess strength, and filter out market noise.
🔹 Profitability Meter
The Profitability Meter is an alternative display that visually represents the percentage of wallets that are profiting, losing, or breaking even.
🔹 Performance
The script provides a view of the financial health of cryptocurrency wallets, showing the percentage of wallets in profit, loss, or breaking even. By combining these metrics with performance data across various timeframes, traders can gain valuable insights into overall wallet performance, assess trend strength, and identify potential market reversals.
🔹 Dashboard
The dashboard presents a consolidated view of key statistics. It allows traders to quickly assess the overall financial health of wallets, monitor trend strength, and gauge market conditions.
🔶 DETAILS
🔹 The Chart Occupation Option
The chart occupation option adjusts the occupation percentage of the chart to balance the visibility of the indicator.
🔹 The Height in Performance Options
Crypto markets often experience significant volatility, leading to rapid and substantial gains or losses. Hence, plotting performance graphs on top of the chart alongside other indicators can result in a cluttered display. The height option allows you to adjust the plotting for balanced visibility, ensuring a clearer and more organized chart.
🔶 SETTINGS
The script offers a range of customizable settings to tailor the analysis to your trading needs.
Chart Occupation %: Adjust the occupation percentage of the chart to balance the visibility of the indicator.
🔹 Profiting Wallets
Profiting Percentage: Toggle to display the percentage of wallets in profit.
Smoothing: Adjust the smoothing period for the profiting percentage line.
Signal Line: Choose a signal line type (SMA, EMA, RMA, or None) to overlay on the profiting percentage.
🔹 Losing Wallets
Losing Percentage: Toggle to display the percentage of wallets in loss.
Smoothing: Adjust the smoothing period for the losing percentage line.
Signal Line: Choose a signal line type (SMA, EMA, RMA, or None) to overlay on the losing percentage.
🔹 Breaking Even Wallets
Breaking-Even Percentage: Toggle to display the percentage of wallets breaking even.
Smoothing: Adjust the smoothing period for the breaking-even percentage line.
🔹 Profitability Meter
Profitability Meter: Enable or disable the meter display, set its width, and adjust the offset.
🔹 Performance
Performance Metrics: Choose the timeframe for performance metrics (Day to Date, Week to Date, etc.).
Height: Adjust the height of the chart visuals to balance the visibility of the indicator.
🔹 Dashboard
Block Profitability Stats: Toggle the display of profitability stats.
Performance Stats: Toggle the display of performance stats.
Dashboard Size and Position: Customize the size and position of the performance dashboard on the chart.
🔶 RELATED SCRIPTS
Market-Sentiment-Technicals
Multi-Chart-Widget

Crypto Volatility Bitcoin Correlation Strategy Description:
The Crypto Volatility Bitcoin Correlation Strategy is designed to leverage market volatility specifically in Bitcoin (BTC) using a combination of volatility indicators and trend-following techniques. This strategy utilizes the VIXFix (a volatility indicator adapted for crypto markets) and the BVOL7D (Bitcoin 7-Day Volatility Index from BitMEX) to identify periods of high volatility, while confirming trends with the Exponential Moving Average (EMA). These components work together to offer a comprehensive system that traders can use to enter positions when volatility and trends are aligned in their favor.
Key Features:
VIXFix (Volatility Index for Crypto Markets): This indicator measures the highest price of Bitcoin over a set period and compares it with the current low price to gauge market volatility. A rise in VIXFix indicates increasing market volatility, signaling that large price movements could occur.
BVOL7D (Bitcoin 7-Day Volatility Index): This volatility index, provided by BitMEX, measures the volatility of Bitcoin over the past 7 days. It helps traders monitor the recent volatility trend in the market, particularly useful when making short-term trading decisions.
Exponential Moving Average (EMA): The 50-period EMA acts as a trend indicator. When the price is above the EMA, it suggests the market is in an uptrend, and when the price is below the EMA, it suggests a downtrend.
How It Works:
Long Entry: A long position is triggered when both the VIXFix and BVOL7D indicators are rising, signaling increased volatility, and the price is above the 50-period EMA, confirming that the market is trending upward.
Exit: The strategy exits the position when the price crosses below the 50-period EMA, which signals a potential weakening of the uptrend and a decrease in volatility.
This strategy ensures that traders only enter positions when the volatility aligns with a clear trend, minimizing the risk of entering trades during periods of market uncertainty.
Testing and Timeframe:
This strategy has been tested on Bitcoin using the daily timeframe, which provides a longer-term perspective on market trends and volatility. However, users can adjust the timeframe according to their trading preferences. It is crucial to note that this strategy does not include comprehensive risk management, aside from the exit condition when the price crosses below the EMA. Users are strongly advised to implement their own risk management techniques, such as setting appropriate stop-loss levels, to safeguard their positions during high volatility periods.
Utility:
The Crypto Volatility Bitcoin Correlation Strategy is particularly well-suited for traders who aim to capitalize on the high volatility often seen in the Bitcoin market. By combining volatility measurements (VIXFix and BVOL7D) with a trend-following mechanism (EMA), this strategy helps identify optimal moments for entering and exiting trades. This approach ensures that traders participate in potentially profitable market moves while minimizing exposure during times of uncertainty.
Use Cases:
Volatility-Based Entries: Traders looking to take advantage of market volatility spikes will find this strategy useful for timing entry points during market swings.
Trend Confirmation: By using the EMA as a confirmation tool, traders can avoid entering trades that go against the trend, which can result in significant losses during volatile market conditions.
Risk Management: While the strategy exits when price falls below the EMA, it is important to recognize that this is not a full risk management system. Traders should use caution and integrate additional risk measures, such as stop-losses and position sizing, to better manage potential losses.
How to Use:
Step 1: Monitor the VIXFix and BVOL7D indicators. When both are rising and the Bitcoin price is above the EMA, the strategy will trigger a long entry, indicating that the market is experiencing increased volatility with a confirmed uptrend.
Step 2: Exit the position when the price drops below the 50-period EMA, signaling that the trend may be reversing or weakening, reducing the likelihood of continued upward price movement.
This strategy is open-source and is intended to help traders navigate volatile market conditions, particularly in Bitcoin, using proven indicators for volatility and trend confirmation.
Risk Disclaimer:
This strategy has been tested on the daily timeframe of Bitcoin, but users should be aware that it does not include built-in risk management except for the below-EMA exit condition. Users should be extremely cautious when using this strategy and are encouraged to implement their own risk management, such as using stop-losses, position sizing, and setting appropriate limits. Trading involves significant risk, and this strategy does not guarantee profits or prevent losses. Past performance is not indicative of future results. Always test any strategy in a demo environment before applying it to live markets.

CryptoLibrary "Crypto"
This Library includes functions related to crytocurrencies and their blockchain
btcBlockReward(t)
Delivers the BTC block reward for a specific date/time
Parameters:
t (int) : Time of the current candle
Returns: blockRewardBtc

Crypto MVRV ZScore - Strategy [PresentTrading]█ Introduction and How it is Different
The "Crypto Valuation Extremes: MVRV ZScore - Strategy " represents a cutting-edge approach to cryptocurrency trading, leveraging the Market Value to Realized Value (MVRV) Z-Score. This metric is pivotal for identifying overvalued or undervalued conditions in the crypto market, particularly Bitcoin. It assesses the current market valuation against the realized capitalization, providing insights that are not apparent through conventional analysis.
BTCUSD 6h Long/Short Performance
Local
█ Strategy, How It Works: Detailed Explanation
The strategy leverages the Market Value to Realized Value (MVRV) Z-Score, specifically designed for cryptocurrencies, with a focus on Bitcoin. This metric is crucial for determining whether Bitcoin is currently undervalued or overvalued compared to its historical 'realized' price. Below is an in-depth explanation of the strategy's components and calculations.
🔶Conceptual Foundation
- Market Capitalization (MC): This represents the total dollar market value of Bitcoin's circulating supply. It is calculated as the current price of Bitcoin multiplied by the number of coins in circulation.
- Realized Capitalization (RC): Unlike MC, which values all coins at the current market price, RC is computed by valuing each coin at the price it was last moved or traded. Essentially, it is a summation of the value of all bitcoins, priced at the time they were last transacted.
- MVRV Ratio: This ratio is derived by dividing the Market Capitalization by the Realized Capitalization (The ratio of MC to RC (MVRV Ratio = MC / RC)). A ratio greater than 1 indicates that the current price is higher than the average price at which all bitcoins were purchased, suggesting potential overvaluation. Conversely, a ratio below 1 suggests undervaluation.
🔶 MVRV Z-Score Calculation
The Z-Score is a statistical measure that indicates the number of standard deviations an element is from the mean. For this strategy, the MVRV Z-Score is calculated as follows:
MVRV Z-Score = (MC - RC) / Standard Deviation of (MC - RC)
This formula quantifies Bitcoin's deviation from its 'normal' valuation range, offering insights into market sentiment and potential price reversals.
🔶 Spread Z-Score for Trading Signals
The strategy refines this approach by calculating a 'spread Z-Score', which adjusts the MVRV Z-Score over a specific period (default: 252 days). This is done to smooth out short-term market volatility and focus on longer-term valuation trends. The spread Z-Score is calculated as follows:
Spread Z-Score = (Market Z-Score - MVVR Ratio - SMA of Spread) / Standard Deviation of Spread
Where:
- SMA of Spread is the simple moving average of the spread over the specified period.
- Spread refers to the difference between the Market Z-Score and the MVRV Ratio.
🔶 Trading Signals
- Long Entry Condition: A long (buy) signal is generated when the spread Z-Score crosses above the long entry threshold, indicating that Bitcoin is potentially undervalued.
- Short Entry Condition: A short (sell) signal is triggered when the spread Z-Score falls below the short entry threshold, suggesting overvaluation.
These conditions are based on the premise that extreme deviations from the mean (as indicated by the Z-Score) are likely to revert to the mean over time, presenting opportunities for strategic entry and exit points.
█ Practical Application
Traders use these signals to make informed decisions about opening or closing positions in the Bitcoin market. By quantifying market valuation extremes, the strategy aims to capitalize on the cyclical nature of price movements, identifying high-probability entry and exit points based on historical valuation norms.
█ Trade Direction
A unique feature of this strategy is its configurable trade direction. Users can specify their preference for engaging in long positions, short positions, or both. This flexibility allows traders to tailor the strategy according to their risk tolerance, market outlook, or trading style, making it adaptable to various market conditions and trader objectives.
█ Usage
To implement this strategy, traders should first adjust the input parameters to align with their trading preferences and risk management practices. These parameters include the trade direction, Z-Score calculation period, and the thresholds for long and short entries. Once configured, the strategy automatically generates trading signals based on the calculated spread Z-Score, providing clear indications for potential entry and exit points.
It is advisable for traders to backtest the strategy under different market conditions to validate its effectiveness and adjust the settings as necessary. Continuous monitoring and adjustment are crucial, as market dynamics evolve over time.
█ Default Settings
- Trade Direction: Both (Allows for both long and short positions)
- Z-Score Calculation Period: 252 days (Approximately one trading year, capturing a comprehensive market cycle)
- Long Entry Threshold: 0.382 (Indicative of moderate undervaluation)
- Short Entry Threshold: -0.382 (Signifies moderate overvaluation)
These default settings are designed to balance sensitivity to market valuation extremes with a pragmatic approach to trade execution. They aim to filter out noise and focus on significant market movements, providing a solid foundation for both new and experienced traders looking to exploit the unique insights offered by the MVRV Z-Score in the cryptocurrency market.

Crypto Open InterestPlots a crypto's open interest on Binance.
You can choose to see OI as asset-denominated (e.g. 1000 BTC), USD-denominated, or both.
How I usually interpret OI:
Price up, OI up = longs opened = bullish
Price up, OI down = shorts closed = bullish on HTF, or counter-trade on LTF
Price down, OI up = shorted opened = bearish
Price down, OI down = longs closed = bearish on HTF, or counter-trade on LTF
I find the indicator useful on 1-minute charts to identify liquidations and compare perp v.s. spot patterns.

Crypto Uptrend Script + Pullback//Volume CandlesDescription: his is an adaption of my Pullback candle - This works on all timeframes and Markets (Forex//Stocks//)
Crypto Uptrend Script with Pullback Candle allows traders to get into a trend when the price is at end of a pullback and entering a balance phase in the market (works on all markets). The use of Moving averages to help identify a Trends and the use of Key levels to help traders be aware of where strong areas are in the market.
This script can work really well in Crypto Bull Runs when used on HTF and with confluences
The script has key support and resistance zones which are made up of quarterly data. Price reacts to these areas but patience is required as price will take time to come into these areas
I have updated the Pullback Candle with the use of Volume to filter out the weak Pullback Candles -
There are new candles to the script.
The First candle is the Bullish Volume Candle - This candle is set to a multiplier of 2x with a crossover of 50/100 on Volume - this then will paint a purple candle.
Uses of the Bullish Volume Candle:
Breakthrough of key areas // special chart patterns
Rejection of key areas
End of a impulse wave (Profit Takers)
The second candle is a Hammer - I prefer using the Hammers on Higher Timeframes however they do work on all timeframes. .
The third candle is a Exhaustion of impulse downward move.
Uses of this candle - can denote a new trend but has to be with confluence to a demand area // support area or with any use of technical analysis - using this alone is not advised
The fourth candle is a indecision candle in the shape of a Doji - this candle can help identify if the trend is in a continuation or a reversal
This script can work really well in Crypto Bull Runs
Disclaimer: There will be Pullbacks with High Volume (Breakouts) and not go the way as intended but this script is to allow traders to get into trends at good price levels. The script can paint signals in areas where price is too expensive so please do your own due diligence on the markets as this script is to help get into good areas of price
Please leave a thumbs up if you like this script and message me for information on how to use the script.
