MTF Candle [Pt]The Multi-Timeframe (MTF) Candle Tool is a powerful indicator designed for traders who wish to analyze standard candle bars and Heikin Ashi candles of multiple timeframes simultaneously. This tool is ideal for traders who prefer to trade in higher timeframes while keeping a close eye on the lower timeframes for confirmation signals. The indicator works by overlaying standard candle bars or Heikin Ashi candles of a higher timeframe onto the current chart. This allows traders to quickly switch between the current timeframe and the higher timeframe, without having to switch charts.
Features
- Live, real time updating MTF candle
- Custom colors
- Heikin Ashi candle
- Heikin Ashi Inside bar highlight
חפש סקריפטים עבור "mtf"

MTF TMOTMO - (T)rue (M)omentum (O)scillator) MTF (Higher Aggregation) Version
TMO calculates momentum using the DELTA of price. Giving a much better picture of the trend, reversals & divergences than most momentum oscillators using price. Aside from the regular TMO, this study combines four different TMO aggregations into one indicator for an even better picture of the trend. Once you look deeper into this study you will realize how complex this tool is. This version also produce much more information like crosses, divergences, overbought / oversold signals, higher aggregation fades etc. It is probably not even possible to explain them all, there could easily be an entire e-book about this study.
I have been using this tool for a couple of years now, and this is what i have learned so far:
Favorite Time Frame Variations:
1. 1m / 5m / 30m - Great for intraday futures or options scalps. 30m TMO serves as the overall trend gauge for the day. 5min dictates the longer term intraday moves as well as direction of the 1min. 1min is for the scalps. When the 5min TMO is sloping higher focus should be on 1min buy signals (red to green cross) and vice versa for the 5min agg. sloping down.
2. 5m / 30m / 60m - Also an interesting variation for day trading the 3-5 min charts. Producing more cleaner & beginner-friendly signals that lasts couple of minutes instead of seconds.
3. 120m / Day / 2 Day - For the 30m to 1H or 2H timeframes. Daily & 2 Day dictates the overall trend. 120 min for the signals. Great for a multi-day swings.
4. Day / 2 Day / Week - Good for the daily charts, swing trading analysis as the weekly dictates the overall trend, daily dictates the signals and the 2 day cleans out the daily signals. If the daily & 2 day are not aligned togather, daily signal means nothing. Weekly dictates 2 day - 2 day dictates daily.
5. Week / Month / 3 Month - Same thing as the previous variation but for the weekly charts.
TMO Length:
The default vanilla settings are 14,5,3. Some traders prefer 21,5,3 as the TMO length is litle higher = TMO will potenially last little longer which could teoretically produce less false signals but slower crosses which means signals will lag more behind price. The lower the length, the faster the oscillator oscillates. It is the noice vs. the lag debate. The Length can be changed, but i would not personally touch the other two. Few points up or down on length will not drastically change much. But changes on Calc Length and Smooth Length can produce totally different signals from the original.
Tips & Tricks:
1. Observe
- This is the best tip & trick I can give you. The #1 best way to learn how any study operates is to just observe how it works in certain situations from the past. MTF TMO is not
an exception.
2. The Power of the Higher Aggregation
- The higher aggregation ALWAYS dictates the lower one. Best way to see this? Just 2x the current timeframe aggregation = so on daily chart, plot the daily & two day TMOs and you will notice how the higher agg. smooths out the current agg. The higher the aggregation is, the smoother (but slower) will the TMO turn. The real power kicks in when the 3 or 4 aggregations are aligned togather in one direction.
3. Position of the Higher Aggregation in Relation to the Extremes
- Overbought / oversold signals might not really work on the current aggregation. But pay attention to the higher aggregations in relation to the extremes. Ex: on the daily chart - daily TMO inside the OB / OS extremes might not mean much. But once the higher aggregations such as 3 day or Weekly TMO enters OB/OS zone togather with the daily, this can be a very powerful signal for a TMO reversion to the zeroline.
4. Crosses
- Yes, crosses do work. Personally, I never really focused on them. The thing about the crosses is that it is crucial to pick the right higher aggregation to the combination of the current one that would be reliable but also print enough signals. The closer the cross is to the OB / OS extremes, the more bigger move can occur. Crosses around the zero line can be considered as less quality crosses.
5. Divergences
- TMO can print awesome divergences. The best divergences are on the current aggregation (TMO agg. same as the chart) since the current agg. oscillates fast, it can usually produce lower lows & higher highs faster then any higher aggregations. Easy setup: wait for the higher aggregation to reach the OB / OS extremes and watch the current (chart) aggregation to print a divergence.
6. Three is Enough
- I personally find more than three aggregations messy and hard to read. But there is always the option to turn on the 4th one. Just switch the TMO 4 Main, TMO 4 Signal and TMO 4 Fill in the style settings.
Hope it helps.

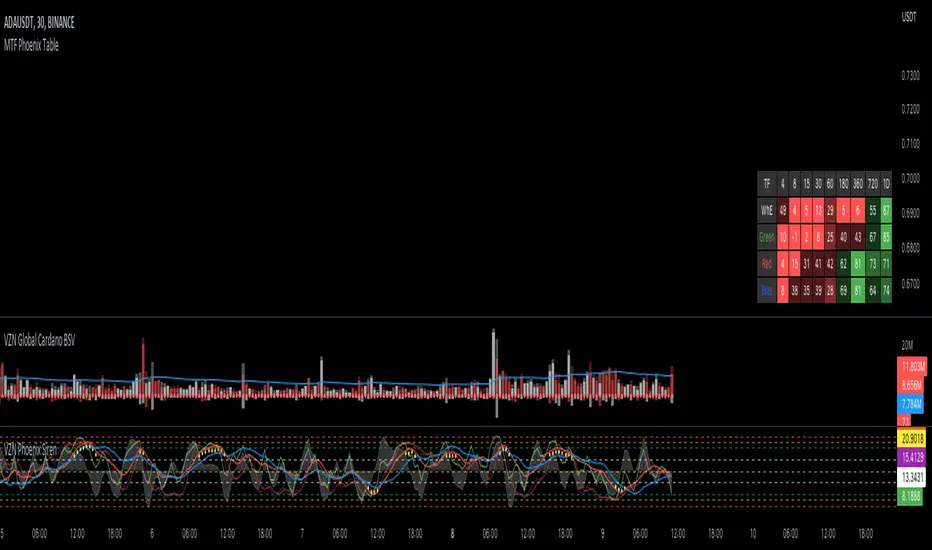
MTF Phoenix TableThis is a MTF heatmap companion for the Phoenix Ascending indicator by WyckoffMode. It aims to make MTF analysis easier at a quick glance.
The row headings are color coordinated for easy visual recognition.
MTF Stochastic, A versionHey everybody,
Here is a version of a MTF Stochastic script I wrote a while ago. The code is based on a formula written by Peter_O and the built in Tradingview Stochastic indicator. See this link to the original script of Peter_O. I use this formula a lot if I want to build in a Stochastic trend filter in my strategies. In this version I added options to plot different signals and trends.

MTF Dots BTC-Pair [Auto] [Moto]Hello traders,
Rsi is pretty commonly used and for some good reasons. When I'm trading, I don't always want to use the USDT/USDTPERP rsi, I want to see the correlated BTC pair Rsi of that asset
This script is similar to my MTF Dots and MTF Dots Cor scripts, but with an important and crucial distinction.
This shows user input oversold and overbought RSI metrics for multiple simultaneous timeframes comparatively to a perpetual futures contracts respective BTC pair automatically.
IMPORTANT: As of posting, the script will only show relevant information if the observed chart is a Binance perp chart. Any other chart and the script will not show data.
For example, if a user is on the BINANCE:SOLUSDTPERP chart, the script will show oversold and overbought Rsi data points for BINANCE:SOLBTC. If observing the BINANCE:ZRXUSDTPERP chart, it will give metrics for BINANCE:ZRXBTC Rsi.
There are six time frames, set to "Chart" resolution by default, which have individual period, overbought and oversold levels of strength.
DM for access,
Thanks
MTF RSI & STOCH Strategy by kziThis script is a teaml job with Indicator-Johns.
First he used my script, then i transform his code.
The origine:
The first transformation:
www.tradingview.com
Funny moment together, thanks for that. :)
This sharing is an indicator where you can see the average of different time frames.
The RSI is the blue line
The Stock is the yellow line
You can manage the timeframe in the parameters.
The strategy is to take position when the two lines get overbought or oversold and close when the stoch and RSI goes to the middle.

MTF previous high and low quarter levelsDescription
An experimental script that prints quarter levels of the previous timeframe's high and low to the current timeframe. The idea is quite simple and is basically the Fibonacci pivoted on the previous high and low with quarter level settings (0,0.25,0.5,0.75,1 etc). The default setting is the previous daily high and low but can be customized on user discretion.
New quarter levels are printed after the close of the previous timeframe and open of the new timeframe (user's timeframe setting)
How To Use
Levels should not be used blindly. Levels can be used as confluence when aligned with high probability supply and demand zones, support, resistance, order blocks, and so on.
Credit to @HeWhoMustNotBeNamed for the Previous High/Low MTF indicator code and @mrbirman for the idea to put this together.

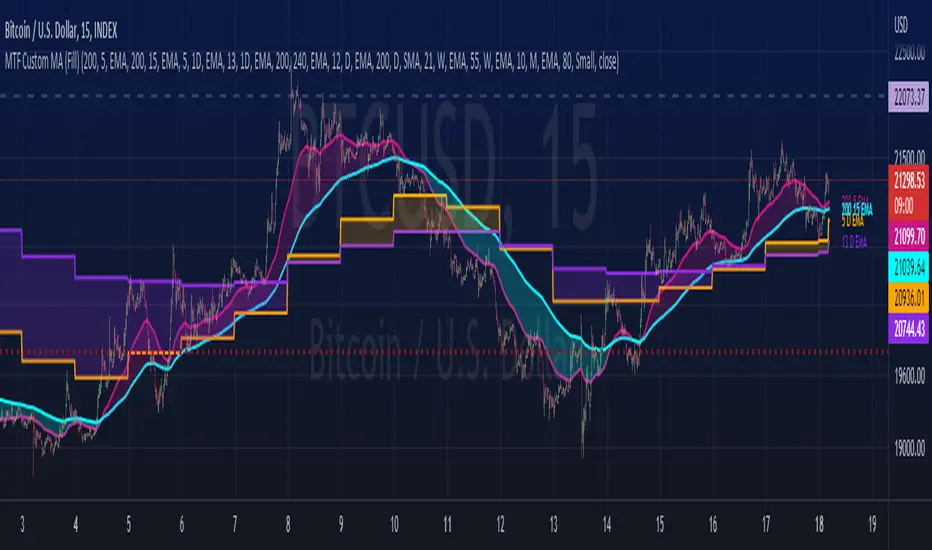
MTF Custom Moving AveragesThis user-friendly indicator allows up to 8 moving averages ( EMA or SMA ) from any timeframe, on any time frame. There are plenty of other MTF MA indicators, each with their own pros and cons. I wanted to make one without the cons:
- Independently set each MA to Exponential or Simple
- No preset lengths
- No preset timeframes
- Optional labels to help keep track of the period/length/type of each plot
- Clean, intuitive input layout
- More than enough MAs available to use one indicator for several use cases... just check/uncheck the ones that are relevant to each chart
Watch for death crosses on the 4hr while monitoring the "Bull Market Support band" (Weekly 21 EMA and 20 SMA ) and checking the Monthly 10 EMA for major support or resistance. Toggle between half of the available MAs for long term BTC trends and use the others for your alts. Use this one indicator to support multiple strategies.
Please leave a comment if you find it useful or have suggestions!
Inspired by the first MTF indicator I found: Weekly Moving Average by TommyTompsen.
MTF Dots Cor[Intromoto]Hey traders.
This indicator shows an MTF RSI levels via the dots above and below candles of a separate security. For example, type BTCUSDT into the ticker field and your chart will show the respective RSI levels for BTDUSDT, independent of your observed chart. This essentially shows RSI correlation to another asset.
There is also an MTF function in the settings to show the timeframe for the RSI oversold/overbought conditions.
DM for access.
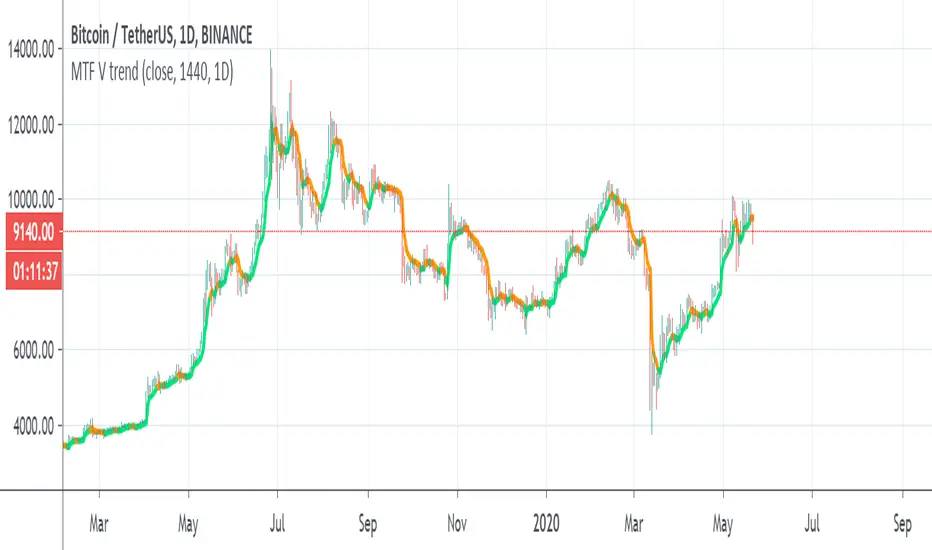
MTF V trendSo i try to make this trend line based on MA volume that i created in the past
orange is downtrend, lime is uptrend
you have MTF function so you can put it on which time frame you want
if you want it to be exact on the candles then fix the tf to time in min
for example : on 4 hour candles put 240 and MTF of 4 hour
MTF Ichimoku CloudHere is my take on Ichimoku Cloud, Multiple Time Frames, based on the
most excellent work of "PineCoders" (MTF Selection Framework functions)!
The big advantage is that on 1 image you can easily see where
price is compared to Ichimoku Cloud patterns (each of different Time Frames).
This gives a lot of Support and Resistance area's!
I restricted the amount of MTF's at 2, more is just too messy
To make it more clear:
- Conversion line and Baseline in present timeframe : thick line
- Conversion line and Baseline in Higher Time Frame (HTF 1) : thin line
- Conversion line and Baseline in Higher Time Frame (HTF 2) : line with circles
All lines has labels at the right of the line with corresponding Time Frame
Since some prefer different settings with higher Time Frames,
each period in each Time Frame can be changed
The Time Frames itself can be chosen:
- or a multiple of present Time Frame
- or a fixed chosen Time Frame
Thanks!

MTF multi Stochastic and RSI + DV Ver miniI tried reducing the size of MTF multi Stochastic and RSI + DVby reducing its functions.
It is an indicator that it is going to see stochastic, stochast RSI, RSI, and Damiani Volatmeter v3.2 at a stretch.
The upper row is stochastic, stochastic RSI, the lower row is RSI and the upper leg RSI.
Due to the specifications of pine, the overall value is +100 in the upper row.
The line that the current foot displays in two colors, green and red, and the signal gray line. This is a line with the upper legs displayed in blue and orange.
Damiani Volatmeter v3.2 is displayed in the background color.
Red is when the current foot is in the range market, blue is when the upper foot is in the range market. In the case of both ranges, the colors will overlap and become purple.
It was created with the idea that it might be relatively safe if you reverse the tension when the color of the stochastic changes in the purple area.
MTF multi Stochastic and RSI + DVを機能削減をして小型化してみました。
ストキャスティック、ストキャスRSI、RSI、Damiani Volatmeter v3.2を一気に見ようというというインジケーターです。
上段にストキャスティック、ストキャスRSI、下段がRSIと上位足のRSIとなっています。
pineの仕様上、全体の数値が、上段が+100となっています。
現在の足が緑と赤の2色で表示している線とシグナルの灰色の線。上位足が青とオレンジ色で表示している線です。
Damiani Volatmeter v3.2はバックグランドの色で表示しています。
赤色が現在の足がレンジ相場の場合、青色が上位足がレンジ相場の場合です。両方レンジ相場の場合は色が重なって紫色になると思われます。
紫色の所でストキャスティックなどの色が変わった時に逆張りをすれば比較的安全かもしれないという考えで作成しました。

MTF MACDSimple and common MTF MACD.
The feature is that various MA can be selected as an option.
シンプルなありふれたMTF MACDです。
オプションで色々なMAを選ぶことができるのが特徴です。

CR MTF True Sight V1.0MTF True Sight is the next generation of my Plain True Sight strategy. While Plain True Sight is more patient, MTF is designed to respond with more agility.

MTF MAIt is just a simple MTF MA.
The types of moving averages that can be selected have been increased considerably
ただのシンプルなMTF MAです。
選択できる移動平均の種類はかなり増やしておきました
MTF Deviation (on-chart) - Mtrl_ScientistHey everyone,
This is an on-chart version of my previous MTF Deviation indicator:
I've added more fib levels and you can now easily see the support/resistance price levels.

MTF Fractal Manifold Support & Resistance Pro [Voidspire]Welcome to MTF Fractal Manifold Support & Resistance Pro. This is not a standard pivot point or zigzag indicator. This tool utilizes Topological Data Analysis (TDA) and Quantitative Physics concepts to treat price action as a high-dimensional manifold.
By applying Lorentzian Kernel Clustering and the Expectation-Maximization (EM) algorithm, the script identifies "High Energy" singularity points where price, time, and volatility (mass) converge. It distinguishes between significant structural levels and random market noise using Shannon Entropy Z-Scores.
🧠 Key Features
⚛️ Physics-Based Clustering: Instead of simple highs/lows, we calculate the "Mass" of a price level based on Tick Volume (Forex) or Real Volume (Equities) and Volatility.
📐 6-Dimensional Analysis: Monitors 6 different timeframes simultaneously (Micro, Meso, and Macro layers) to find Fractal resonance.
📊 Hurst Exponent Integration: Automatically detects whether the market is trending or mean-reverting (ranging) to adjust the search radius (Gamma) of the clusters dynamically.
🧪 Entropy Z-Score: Each level is assigned a Z-Score. Low scores (Green) indicate highly ordered, stable support. High scores (Red) indicate chaotic, unstable zones.
🔥 Topological Confluence Zones: When multiple timeframe levels overlap, they merge into high-probability "Heatmap Boxes," signaling major reversal or breakout zones.
🔥 This indicator does not use future functions and will not be repaint.
⚙️ Comprehensive Settings Guide
This script is highly customizable to fit any asset class (Crypto, Forex, Stocks, Indices).
1. Algorithm Settings (Core)
Asset Class Model:
Forex/Synthetic: Uses Tick Volume + Volatility to calculate Mass.
Equities: Uses Real Volume.
Pure Price: Uses pure geometry (Suitable for assets where accurate trading volume information is not available).
Fractal Gamma Sensitivity: Controls the "focus" of the clustering. Higher values detect finer, more local structures; lower values find broader, major structures.
Entropy Lookback: The historical window used to calculate the Z-Score statistics.
2. Manifold Layer Configuration (Layers 1-6)
You have control over 6 distinct timeframe layers.
Enable/Timeframe: Choose which timeframes to analyze (e.g., 15m, 1H, 4H, Daily).
K-Centers: How many support/resistance clusters to find on this specific timeframe.
Sample Size: How far back in history to analyze data for this layer.
3. Topological Confluence (The Heatmap)
Show High-Energy Confluence: Enables the drawing of rectangular zones where levels overlap.
Merge Threshold %: The distance required to merge two levels into a single zone.
Bullish/Bearish Heatmap: Custom colors for Support (Bullish) and Resistance (Bearish) zones.
4. Dynamic Visibility Control
Hide Micro/Meso Layer: Automatically hides lower timeframe levels when you zoom out to higher timeframes (e.g., hide 15m levels when looking at the Weekly chart) to keep your chart clean.
5. UI & Visual Interaction
Confluence Breakout Threshold: The percentage price must move beyond a zone to confirm a breakout signal.
Zone Transparency: Adjusts the alpha channel of the confluence boxes.
Label Size: Customize the text size of the energy/entropy data labels.
Show Dashboard: Toggles the stats panel.
Show Midline: Toggles the median line inside confluence zones.
6. Layer Coloring & Alerts
Layer Colors: Set unique colors for all 6 layers (Micro, Meso, Macro) to visually decode timeframe hierarchy.
Ghost Extension Transparency: Adjust the visibility of the dotted lines that project the support levels into the future.
Alerts: Configure custom messages for bullish breakouts or bearish breakdowns. Supports variables {ticker} and {price}.
Disclaimer
Trading involves substantial risk and is not suitable for every investor. This indicator is a tool for technical analysis and does not constitute financial advice. Past performance does not guarantee future results. Always use proper risk management.
------------------------------------
中文介绍
机构级市场支撑阻力分析系统
欢迎使用多时间框架高维流形支撑阻力分析系统。这不仅仅是一个普通的枢轴点或 Zigzag 指标。本脚本利用 拓扑数据分析 (TDA) 和 量化物理学 概念,将价格行为视为一个高维流形进行建模。
通过应用 洛伦兹核聚类 (Lorentzian Kernel Clustering) 和 期望最大化 (EM) 算法,该脚本能够识别价格、时间和波动率(质量)汇聚的“高能奇点”。同时,结合 香农熵 Z-Score (Shannon Entropy Z-Scores),它可以有效区分关键的市场结构位和随机的市场噪音。
🧠 核心特性
⚛️ 物理驱动聚类: 我们不单纯依赖高低点,而是根据 Tick 量(外汇)或真实成交量(股票)结合波动率来计算价格水平的“质量 (Mass)”。
📐 6维流形分析: 同时监控 6 个不同的时间周期(微观、中观、宏观层级),寻找分形共振。
📊 赫斯特指数 (Hurst Exponent): 自动检测市场是处于趋势状态还是均值回归(震荡)状态,并据此动态调整聚类算法的搜索半径 (Gamma)。
🧪 熵值 Z-Score: 每个支撑位都有一个 Z分数。低分(绿色)代表高度有序、稳固的支撑;高分(红色)代表混沌、不稳定的区域。
🔥 拓扑共振区: 当多个时间周期的水平位重叠时,它们会合并成高概率的“热力图箱体 (Heatmap Boxes)”,这通常是反转或突破的关键区域。
🔥该指标不使用未来函数,也不会重绘。
⚙️ 全面的参数设置指南
本脚本高度可定制,适用于任何资产类别(加密货币、外汇、股票、指数)。
1. Algorithm Settings (核心算法设置)
Asset Class Model (资产模型):
Forex/Synthetic: 使用 Tick 量 + 波动率计算质量。
Equities: 使用真实成交量。
Pure Price: 纯几何计算(适用于不能获取准确成交量信息的资产)。
Fractal Gamma Sensitivity (分形敏感度): 控制聚类的“焦点”。数值越高,生成的结构越精细;数值越低,寻找的结构越宏观。
Entropy Lookback: 计算熵值 Z-Score 统计数据的历史样本窗口大小。
2. Manifold Layer Configuration (流形层级 1-6)
您可以控制 6 个独立的时间框架层级。
Enable/Timeframe: 选择要分析的时间周期(例如:15分钟、1小时、4小时、日线)。
K-Centers: 在该时间周期上寻找多少个支撑/阻力聚类中心。
Sample Size: 分析该层级多少根历史 K 线的数据。
3. Topological Confluence (拓扑共振/热力图)
Show High-Energy Confluence: 开启后,将重叠的水平位显示为矩形区域。
Merge Threshold %: 将两个临近水平位合并为一个区域的距离阈值。
Bullish/Bearish Heatmap: 自定义支撑区(看涨)和阻力区(看跌)的颜色。
4. Dynamic Visibility Control (动态可视性)
Hide Micro/Meso Layer: 当您切换到大周期图表时,自动隐藏小周期的线条,保持图表整洁。
5. UI & Visual Interaction (UI 与交互)
Confluence Breakout Threshold: 价格必须突破区域宽度的百分之多少才被确认为突破信号。
Zone Transparency: 调整共振区箱体的透明度。
Label Size: 自定义能量/熵值数据标签的字体大小。
Show Dashboard: 显示/隐藏统计面板。
Show Midline: 显示/隐藏共振区内部的中轴线。
6. Layer Coloring & Alerts (着色与警报)
Layer Colors: 为所有 6 个层级设置不同的颜色,以便直观区分微观、中观和宏观结构。
Ghost Extension Transparency: 调整向右延伸的预测虚线的透明度。
Alerts: 配置看涨突破或看跌跌破的自定义警报消息。支持变量 {ticker} 和 {price}。
免责声明
交易涉及巨大风险,并不适合所有投资者。该指标仅供技术分析辅助使用,不构成任何财务建议。过往的表现并不能保证未来的结果。请务必做好风险管理。

MTF STDVThis indicator is based on the classical indicator Standard Deviation.
MTF STDV
Monthly
Weekly
Daily
4H
1H
STDV

MTF Trading Helper & Multi AlertsHi dear fellows, I´m using this indicator for my trading, so every then and when I will publish updates on this one.
This indicator should help to identify the right trading setup. I´m using it to trade index futures and stocks.
MTF Trading Helper & Multi Alerts
Overview
This indicator provides a clear visual representation of trend direction across three timeframes. It helps traders identify trend alignment, potential reversals, and optimal entry/exit points by analyzing the relationship between different smoothed timeframes.
You can set up multiple alerts (as one alert in Tradingview)
How It Works
The indicator displays three colored circles representing the smoothed candle direction on three different timeframes:
Bottom plot represents the overall trend direction, the plot in the middle shows intermediate momentum, and the one on top captures short-term price action.
When a color change occurs, the circle appears in a darker shade to highlight the transition.
🟢 Green = Bullish - 🔴 Red = Bearish
This change can also trigger multiple alerts.
Timeframe Settings - important
Choose between two trading setups, either for:
Intraday 1-minute candles or 1h for swing trading. Set up your chart accordingly to that timeframe.
Intraday | 1Min chart candles
Swing | 1 hour chart candles
Plots
TF3 represents the overall trend direction (bottom), TF2 shows intermediate momentum (middle), and TF1 captures short-term price action (top).
Interpretation & Strategy Alerts
1. Trend Bullish (TF3 turns Green)
The higher timeframe has shifted bullish - a potential new uptrend is forming.
Example: You're watching ES-mini on the Intraday setting. TF3 turns green after being red for several days. This signals the broader trend may be shifting bullish - consider looking for long opportunities.
2. Trend Bearish (TF3 turns Red)
The higher timeframe has shifted bearish - consider protecting profits or exiting long positions.
Example: You hold a long position in Es-mini. TF3 turns red, indicating the macro trend is weakening. This is your signal to take profits or tighten stop-losses.
3. Possible Accumulation (TF3 Red + TF2 turns Green)
While the overall trend is still bearish, the medium timeframe shows buying pressure. Smart money may be accumulating - watch closely for a potential trend reversal.
Example: Es-mini has been in a downtrend (TF3 red). Suddenly TF2 turns green while TF3 remains red. This could indicate institutional buying before a reversal. Don't buy yet, but add it to your watchlist and wait for confirmation.
4. Trend Continuation (TF3 Green + TF2 turns Green)
The medium timeframe realigns with the bullish macro trend - a potential buying opportunity as momentum returns to the uptrend.
Example: Es-mini is in an uptrend (TF3 green). After a pullback, TF2 was red but now turns green again. The pullback appears to be over - this is a trend continuation signal and a potential entry point.
5. Buy the Dip (TF3 + TF2 Green + TF1 turns Green)
All timeframes are now aligned bullish. The short-term pullback is complete and price is resuming the uptrend - optimal entry for short-term trades.
Example: Es-mini is trending up (TF3 + TF2 green). A small dip caused TF1 to turn red briefly. When TF1 turns green again, all three timeframes are aligned - this is your "Buy the Dip" signal with strong confirmation.
6. Sell the Dip (TF3 + TF2 Green + TF1 turns Red)
Short-term weakness within an uptrend. This can be used to take partial profits, wait for a better entry, or trail stops tighter.
Example: You're long on ES-mini with TF3 and TF2 green. TF1 turns red, indicating short-term selling pressure. Consider taking partial profits here and wait for TF1 to turn green again (Buy the Dip) to add back to your position.
How to Use
Choose your scenario: Select "Intraday" 1min-chart for day trading or "Swing" 1h-chart for swingtrading
Enable alerts: Turn on the strategy alerts you want to receive in the settings
Wait for signals: Let the indicator notify you when conditions align
Confirm with price action: Always use additional confirmation before entering trades
Best Practices
✅ Use TF3 as your trend filter - only take longs when TF3 turns green and hold them :)
✅ Use TF2 for timing - wait for TF2 to align with TF3 for swings.
✅ Use TF2 for early entries (accumulation phase) when TF3 is still red. Watch out!
✅ Use TF1 for entries when TF3 and TF2 are green. Only buy if TF1 is red. Keep it short and sweet.
✅ Combine with support/resistance levels for better entries
✅ Use proper risk management - no indicator is 100% accurate
Disclaimer
This indicator is for educational purposes only. Past performance does not guarantee future results. Always do your own research and use proper risk management. Never risk more than you can afford to lose.

MTF FVG, OB & Sessions1. Advanced Multi-Timeframe Fair Value Gaps (FVG)
This is the most complex part of the script. Unlike standard FVG indicators that just draw boxes, this module uses Arrays to manage the gaps dynamically.
Dynamic Mitigation: The script tracks every FVG stored in memory. If price trades through an FVG (mitigates it), the script automatically deletes the box.
Option (Wick vs. Close): You can choose to delete the FVG as soon as a wick touches the other side, or only if a candle closes through it.
Displacement Filter: It uses an ATR (Average True Range) multiplier to ensure that only significant, impulsive moves (displacement) generate an FVG, filtering out low-volatility noise.
Confluence (Overlap) Logic: The script checks for overlaps between the three different timeframes (e.g., a 4H FVG inside a Daily FVG).
Alignment Setting: You can set the script to highlight specific boxes only when timeframes align, indicating a stronger level of interest.
3 Monitorable Timeframes: Defaults to 4-Hour, 1-Hour, and 15-Minute, but fully customizable.
2. Multi-Timeframe Order Blocks (OB)
This module identifies potential Order Blocks based on Swing Highs and Swing Lows (Pivot points).
Pivot Detection: It looks for a specific pattern of highs/lows (defined by the "Swing Lookback" input) to identify key reversal points on higher timeframes.
MTF Overlay: It fetches these structures from the 3 defined timeframes and projects them onto your current chart.
Visuals: Draws extended boxes representing the open/close range of the order block candle.
3. Session Liquidity (Highs & Lows)
This module tracks the specific trading sessions to highlight intraday liquidity pools.
Sessions Tracked: Asia, London, and New York.
Behavior:
While the session is active, it tracks the highest and lowest price.
Once the session closes, it draws dashed lines extending forward from that session's High and Low.
Purpose: These levels act as key targets for liquidity sweeps (e.g., price sweeping the London Low before reversing).
Technical Summary
Data Handling: Uses request.security with barmerge.lookahead_on to fetch data from higher timeframes without repainting historical closed bars.
Efficiency: Uses specific types (type OB_Data) and Arrays to handle data efficiently, keeping the script fast despite processing multiple timeframes simultaneously.
Limits: Includes a built-in "Max FVG Storage" and "Delete After X Bars" feature to prevent the chart from becoming too cluttered with old data.

MTF Order Block & FVG Finder (Public Ver.)═══════════════════════════════════════════════════════════════
🎯 OVERVIEW
═══════════════════════════════════════════════════════════════
The MTF Order Block & FVG Finder is a comprehensive institutional trading tool that identifies and visualizes Order Blocks (OB) and Fair Value Gaps (FVG) across multiple timeframes. This indicator helps traders spot key support and resistance zones where institutional players have placed significant orders.
═══════════════════════════════════════════════════════════════
✨ KEY FEATURES
═══════════════════════════════════════════════════════════════
📊 ORDER BLOCK DETECTION
• Multi-Timeframe Analysis: Monitor up to 3 different timeframes simultaneously
• Smart Engulfing Detection: Identifies bullish and bearish order blocks using engulfing patterns
• ATR-Based Filtering: Filter out insignificant order blocks using customizable ATR multiplier
• Dynamic Extension: Option to extend order blocks to the right edge of the chart
• Visual Differentiation: Distinct colors and transparency levels for each timeframe
• Auto-Invalidation: Order blocks automatically disappear when price closes beyond them
🔲 FAIR VALUE GAP (FVG) DETECTION
• 12 Timeframe Support: From 1-minute to weekly charts (1, 3, 5, 15, 30, 45, 60, 120, 180, 240, D, W)
• Dynamic Level Adjustment: FVG levels automatically update when price touches the gap
• Color Change System: Visual indication when FVG zones are tested by price
• Customizable Display: Full control over extension, labels, colors, and sizes
• Smart Management: FVGs are removed when fully filled by price action
🔔 ADVANCED ALERT SYSTEM
• Price Touch Alerts: Get notified when price reaches order block zones
• Separate Controls: Enable/disable alerts for bullish and bearish order blocks independently
• Tolerance Settings: Adjust alert sensitivity with percentage-based tolerance (0-1%)
• Detailed Messages: Alerts include current price, block range, and timeframe information
• Smart Triggering: Prevents duplicate alerts on the same bar
═══════════════════════════════════════════════════════════════
⚙️ SETTINGS GUIDE
═══════════════════════════════════════════════════════════════
🎨 ORDER BLOCK SETTINGS
• Primary Timeframe: Main timeframe for order block detection (default: current chart)
• Secondary Timeframe: Optional second timeframe with toggle on/off
• Tertiary Timeframe: Optional third timeframe with toggle on/off
• Extend to Right: Automatically extend order blocks to current price bar
• Filter Small Blocks: Enable ATR-based filtering to focus on significant levels
• ATR Period: Lookback period for ATR calculation (default: 100)
• Minimum OB Size: Threshold as multiple of ATR (default: 0.3× ATR)
📐 FVG SETTINGS
• Move Levels on Touch: Dynamically adjust FVG boundaries when price interacts
• Change Color on Touch: Visual feedback showing tested vs untested FVGs
• Extend to Right: Extend FVG boxes to current price bar
• Plot Labels: Display timeframe labels on FVG boxes
• Custom Colors: Separate colors for bullish, bearish, and tested FVGs
• Timeframe Selection: Choose which timeframes to display FVGs
🔔 ALERT SETTINGS
• Enable Price Touch Alerts: Master switch for all alerts
• Bullish OB Alerts: Notifications when price touches bullish order blocks
• Bearish OB Alerts: Notifications when price touches bearish order blocks
• Alert Tolerance: Fine-tune sensitivity (default: 0.1%)
═══════════════════════════════════════════════════════════════
🔍 HOW IT WORKS
═══════════════════════════════════════════════════════════════
📌 ORDER BLOCK LOGIC
An order block forms when a strong directional candle engulfs the previous candle:
BULLISH ORDER BLOCK:
✓ Current candle closes above its open (bullish candle)
✓ Previous candle closed below its open (bearish candle)
✓ Current candle's close is above previous candle's open
✓ Current candle's open is below previous candle's close
→ The previous bearish candle's body becomes the bullish order block
BEARISH ORDER BLOCK:
✓ Current candle closes below its open (bearish candle)
✓ Previous candle closed above its open (bullish candle)
✓ Current candle's close is below previous candle's open
✓ Current candle's open is above previous candle's close
→ The previous bullish candle's body becomes the bearish order block
INVALIDATION:
• Bullish OB: Invalidated when price closes below the block's low
• Bearish OB: Invalidated when price closes above the block's high
📌 FAIR VALUE GAP LOGIC
FVGs represent areas where price moved rapidly with minimal trading activity:
BULLISH FVG (Gap Up):
• Low of current candle > High of candle
• Creates unfilled space between these two candles
• Acts as potential support zone
BEARISH FVG (Gap Down):
• High of current candle < Low of candle
• Creates unfilled space between these two candles
• Acts as potential resistance zone
FVG MANAGEMENT:
• Gaps are "filled" when price fully retraces through them
• Optional: Adjust levels when partially filled
• Optional: Change color to show tested zones
═══════════════════════════════════════════════════════════════
💡 TRADING APPLICATIONS
═══════════════════════════════════════════════════════════════
📈 ENTRY STRATEGIES
• Use order blocks as high-probability entry zones
• Wait for price to return to OB/FVG before entering
• Combine with higher timeframe trend direction
• Look for confluence between OBs and FVGs
🛡️ RISK MANAGEMENT
• Place stop losses beyond order block boundaries
• Use multiple timeframe OBs for layered stop placement
• Smaller OBs (filtered by ATR) = tighter stops
• Larger OBs = more significant levels
🎯 TARGET SETTING
• Next order block or FVG as initial target
• Multiple timeframe analysis for swing targets
• Use FVG fills as profit-taking zones
• Higher timeframe OBs as major targets
✅ CONFIRMATION TECHNIQUES
• Wait for price reaction at order block levels
• Look for reversal candlestick patterns
• Combine with volume analysis
• Use lower timeframe for precise entries
═══════════════════════════════════════════════════════════════
🎓 BEST PRACTICES
═══════════════════════════════════════════════════════════════
1️⃣ START WITH HIGHER TIMEFRAMES
• Focus on 4H, Daily, or Weekly order blocks first
• These represent stronger institutional levels
• Use lower timeframes for entry refinement
2️⃣ USE ATR FILTER WISELY
• Enable filtering to reduce noise
• Adjust multiplier based on market volatility
• Higher volatility = higher multiplier needed
3️⃣ COMBINE MULTIPLE TIMEFRAMES
• Look for confluence zones (multiple OBs/FVGs aligning)
• Higher timeframe OB + lower timeframe FVG = strong zone
• Three timeframe alignment = highest probability setups
4️⃣ ALERT MANAGEMENT
• Enable alerts for hands-free monitoring
• Set appropriate tolerance based on asset volatility
• Crypto: 0.1-0.3% | Forex: 0.05-0.1% | Stocks: 0.1-0.2%
5️⃣ UNDERSTAND MARKET CONTEXT
• OBs work best in trending markets
• FVGs are powerful in range-bound conditions
• Always consider overall market structure
═══════════════════════════════════════════════════════════════
📊 TECHNICAL SPECIFICATIONS
═══════════════════════════════════════════════════════════════
• Pine Script™ Version: 6
• Indicator Type: Overlay
• Maximum Boxes: 500
• Maximum Labels: 500
• Dynamic Requests: Enabled
• License: Mozilla Public License 2.0
═══════════════════════════════════════════════════════════════
🎨 VISUAL CUSTOMIZATION
═══════════════════════════════════════════════════════════════
COLOR CODING:
• Primary TF: Darker/More opaque (70% transparency)
• Secondary TF: Medium opacity (80% transparency)
• Tertiary TF: Lighter/More transparent (90% transparency)
• Green: Bullish order blocks
• Red: Bearish order blocks
• Gray: Tested FVGs
LABEL SYSTEM:
• Timeframe labels clearly identify each OB/FVG
• Centered placement for easy identification
• Customizable label size and color
• Optional hide/show functionality
═══════════════════════════════════════════════════════════════
⚠️ IMPORTANT NOTES
═══════════════════════════════════════════════════════════════
• This indicator is for educational purposes only
• Not financial advice - always do your own research
• Past performance does not guarantee future results
• Practice proper risk management in all trades
• Combine with other analysis tools for best results
• Test settings on your preferred assets and timeframes

MTF Bollinger Bands (1-2-3 SD)MTF Bollinger Bands (1-2-3 SD)
Plots Bollinger Bands from any higher timeframe (e.g., Daily or Weekly) directly on your current chart (1m, 15m, 1h, etc.).
Features:
Shows 1σ (blue), 2σ (orange), and 3σ (red) bands with transparent fills
Fully customizable timeframe, length, and deviation multipliers
Option to show/hide each band pair independently
Smooth (no gaps) or stepped display
Perfectly matches the native Bollinger Bands when you switch to the selected higher timeframe
Great for keeping higher-timeframe structure and extreme levels in view while trading lower timeframes.
