SpaceTime Profile Regular SpaceManBTCSpaceTime Profile Regular SpaceManBTC
Is a profiling tool for a market session.
Using time and price it calculates the TPO mapping the POC on your chart as well as the general profile.
The tool is useful as it can give you a general idea of how a day traded/is trading based off of its shape.
As well as provides the current developing POC as a reference for potentially a dynamic level of interest.
Value area shading is also including in the release using 68% as my reference of personal choice to represent where
bulk of the market activity occured on a given time frame.
To generate the data the indicator aims to look at the price variations over time of the given session (you can choose this in settings), this will then stack
and overlay on the chart to generate the TPO calculations by mapping 1 to 1 with the price you see on the chart.
This will give you areas of importance such as the POC which can be retested when naked providing a point of interest.
Works similar to volume profile but with no volume calculations only with price and time in mind.
Very useful tool for trend / market analysis by providing this graphical representation of a trading session between buyers and sellers!
חפש סקריפטים עבור "poc"
SpaceTime Profile AdvancedSpaceTime Profile Advanced is different to the non overlay with a different codebase.
The main advantages are the 1:1 price mappings that occur on this data generation as well as the auto mapping POC line!
The implementation is heavily different and therefore they both provide different uses
Overlay is better for current chart data being mapped up to 10 days minimum in most cases
As well as POC lines and soon High value areas
ToDo:
Naked POC
High value areas
Auto Tick Size
Better colouring

Session Volume Profile v1.0This script is a continuous Real Time Session Based (1D) Volume Profile . It emulates TV's built in Volume Profile Session Volume function.
It looks at the real time volume for a given session (1 day) and updates the following three elements for that day in real time:
Point of Control ( POC )
Value Area High ( VAH )
Value Area Low ( VAL )
There are 2 standard parameters:
Number of Bins/Rows : The granularity of the volume profile, the higher the number the more precise the calculations will be but will load slower, ideal is 16/32.
Percent for Value Area : Percent of total volume traded that you would like to be shown as a fill around the POC (maximum volume bin/row)
There are also 2 non standard parameters:
Checkbox for slower loading but more precise Value Area Calculation, checked = enabled, unchecked = disabled
Checkbox for more volatile symbols, check this if the price action is outside of the white dotted lines, default is disabled, checked = enabled, unchecked = disabled
POC: White Stepline
Value Area High: Highest Blue Line marking the top of the fill (Value Area)
Value Area Low: Lowest White Line marking the bottom of the fill
Please pm me if you are interested in trying this script out; I am also available for hire to work on custom scripts. Ty

Fortunato Lead-Lag Multi-Asset (POC) v5_fix2//@version=6
indicator("Fortunato Lead-Lag Multi-Asset (POC) v5_fix2", shorttitle="FLL Multi POC v5_fix2", overlay=false, max_lines_count=200, max_labels_count=200)
// ========== USER CONFIG ==========
res = input.timeframe("1", "Resolution for analysis (ex: 1, 5, 3)")
corr_length = input.int(60, "Rolling window (bars) for correlation", minval=10, maxval=500)
max_lag = input.int(5, "Max lag to test (bars)", minval=1, maxval=20)
corr_threshold = input.float(0.60, "Correlation threshold (abs)", step=0.01)
min_lag_for_signal = input.int(1, "Min lag to consider (bars)", minval=0)
plot_lag_as_columns = input.bool(true, "Plot lag as columns")
// --- symbols (change to the exact tickers your feed uses) ---
sym_ndx = input.symbol("NASDAQ:NDX", "NDX (leader candidate) - change if needed")
sym_spx = input.symbol("SPX:SPX", "SPX (follower candidate) - change if needed")
// Optional add-ons
sym_vix = input.symbol("CBOE:VIX", "VIX (volatility index) - optional")
sym_dxy = input.symbol("ICEUS:DXY", "DXY (Dollar Index) - optional")
sym_xau = input.symbol("OANDA:XAUUSD","Gold (XAU/USD) - optional")
sym_oil = input.symbol("NYMEX:CL1!", "Crude Oil (continuous) - optional")
sym_btc = input.symbol("BINANCE:BTCUSDT","Bitcoin (BTC) - optional")
// ========== DATA FETCH (selected resolution) ==========
ndx = request.security(sym_ndx, res, close)
spx = request.security(sym_spx, res, close)
vix = request.security(sym_vix, res, close)
dxy = request.security(sym_dxy, res, close)
xau = request.security(sym_xau, res, close)
oil = request.security(sym_oil, res, close)
btc = request.security(sym_btc, res, close)
// ========== HELPERS ==========
has_history(len) => bar_index >= len
// rolling Pearson correlation implemented with ta.cum differences (replaces ta.sum)
rolling_corr(a, b, n) =>
if not has_history(n)
na
else
// compute rolling sums via cumulative sums
// sum_ab = sum_{k=0..n-1} a *b
float cum_ab = ta.cum(a * b)
float cum_ab_lag = cum_ab
float sum_ab = cum_ab - cum_ab_lag
float cum_a = ta.cum(a)
float cum_a_lag = cum_a
float sum_a = cum_a - cum_a_lag
float cum_b = ta.cum(b)
float cum_b_lag = cum_b
float sum_b = cum_b - cum_b_lag
float cum_a2 = ta.cum(a * a)
float cum_a2_lag = cum_a2
float sum_a2 = cum_a2 - cum_a2_lag
float cum_b2 = ta.cum(b * b)
float cum_b2_lag = cum_b2
float sum_b2 = cum_b2 - cum_b2_lag
float nn = n * 1.0
float num = sum_ab - (sum_a * sum_b) / nn
float den_part_a = sum_a2 - (sum_a * sum_a) / nn
float den_part_b = sum_b2 - (sum_b * sum_b) / nn
float den = den_part_a * den_part_b
if den <= 0.0
na
else
num / math.sqrt(den)
// ========== COMPUTE CORRELATIONS FOR ALL LAGS (USING rolling_corr) ==========
var float corr_dir1 = array.new_float()
var float corr_dir2 = array.new_float()
// ensure arrays sized correctly each bar
if array.size(corr_dir1) != (max_lag + 1)
array.clear(corr_dir1)
for i = 0 to max_lag
array.push(corr_dir1, na)
if array.size(corr_dir2) != (max_lag + 1)
array.clear(corr_dir2)
for i = 0 to max_lag
array.push(corr_dir2, na)
// fill arrays with correlation values (call rolling_corr every bar for consistency)
for i = 0 to max_lag
float val1 = na
if has_history(corr_length + i) and not na(ndx) and not na(spx)
// ndx aligned with spx shifted by +i (ndx leads spx by i)
val1 := rolling_corr(ndx, spx , corr_length)
array.set(corr_dir1, i, val1)
float val2 = na
if i > 0 and has_history(corr_length + i) and not na(ndx) and not na(spx)
// spx leads ndx by i
val2 := rolling_corr(ndx , spx, corr_length)
array.set(corr_dir2, i, val2)
// ========== FIND BEST ABSOLUTE CORRELATION AND DIRECTION ==========
float best_corr = na
int best_lag = 0
int best_dir = 0 // 1 = ndx -> spx, -1 = spx -> ndx
// scan dir1 (i = 0..max_lag)
for i = 0 to max_lag
float c = array.get(corr_dir1, i)
if not na(c)
if na(best_corr) or math.abs(c) > math.abs(best_corr)
best_corr := c
best_lag := i
best_dir := 1
// scan dir2 (i = 1..max_lag)
for i = 1 to max_lag
float c = array.get(corr_dir2, i)
if not na(c)
if na(best_corr) or math.abs(c) > math.abs(best_corr)
best_corr := c
best_lag := i
best_dir := -1
// ========== MULTI-ASSET LIGHT CONFIRMATION (explicit calls with rolling_corr) ==========
float sum_corr = 0.0
int count_corr = 0
// VIX
float local_best_vix = na
if not na(vix)
for j = 0 to max_lag
if has_history(corr_length + j)
float cc = rolling_corr(ndx, vix , corr_length)
if not na(cc)
if na(local_best_vix) or math.abs(cc) > math.abs(local_best_vix)
local_best_vix := cc
if not na(local_best_vix)
sum_corr := sum_corr + local_best_vix
count_corr := count_corr + 1
// DXY
float local_best_dxy = na
if not na(dxy)
for j = 0 to max_lag
if has_history(corr_length + j)
float cc = rolling_corr(ndx, dxy , corr_length)
if not na(cc)
if na(local_best_dxy) or math.abs(cc) > math.abs(local_best_dxy)
local_best_dxy := cc
if not na(local_best_dxy)
sum_corr := sum_corr + local_best_dxy
count_corr := count_corr + 1
// XAU
float local_best_xau = na
if not na(xau)
for j = 0 to max_lag
if has_history(corr_length + j)
float cc = rolling_corr(ndx, xau , corr_length)
if not na(cc)
if na(local_best_xau) or math.abs(cc) > math.abs(local_best_xau)
local_best_xau := cc
if not na(local_best_xau)
sum_corr := sum_corr + local_best_xau
count_corr := count_corr + 1
// OIL
float local_best_oil = na
if not na(oil)
for j = 0 to max_lag
if has_history(corr_length + j)
float cc = rolling_corr(ndx, oil , corr_length)
if not na(cc)
if na(local_best_oil) or math.abs(cc) > math.abs(local_best_oil)
local_best_oil := cc
if not na(local_best_oil)
sum_corr := sum_corr + local_best_oil
count_corr := count_corr + 1
// BTC
float local_best_btc = na
if not na(btc)
for j = 0 to max_lag
if has_history(corr_length + j)
float cc = rolling_corr(ndx, btc , corr_length)
if not na(cc)
if na(local_best_btc) or math.abs(cc) > math.abs(local_best_btc)
local_best_btc := cc
if not na(local_best_btc)
sum_corr := sum_corr + local_best_btc
count_corr := count_corr + 1
float confirm_avg = na
if count_corr > 0
confirm_avg := sum_corr / count_corr
// ========== SIGNAL LOGIC ==========
bool lead_detected = false
string lead_direction_text = "NoLeader"
if not na(best_corr) and math.abs(best_corr) >= corr_threshold and best_lag >= min_lag_for_signal
lead_detected := true
lead_direction_text := best_dir == 1 ? "NDX -> SPX" : (best_dir == -1 ? "SPX -> NDX" : "NoLeader")
// ========== PLOTS (GLOBAL) ==========
plot_best_corr = best_corr
plot_best_lag = (lead_detected ? best_lag : na)
plot_confirm_avg = confirm_avg
plot(plot_best_corr, title="Best Corr (signed)", linewidth=2)
hline(0, "zero", linestyle=hline.style_dashed)
hline(corr_threshold, "threshold +", linestyle=hline.style_solid)
hline(-corr_threshold, "threshold -", linestyle=hline.style_solid)
plot(plot_lag_as_columns ? plot_best_lag : na, title="Best Lag (bars)", style=plot.style_columns, linewidth=2)
plot(not na(plot_confirm_avg) ? plot_confirm_avg : na, title="Multi-asset confirm (avg)", linewidth=1, style=plot.style_line)
// ========== LABEL MANAGEMENT ==========
var label lbl = na
if lead_detected and barstate.isconfirmed
if not na(lbl)
label.delete(lbl)
lbl := label.new(bar_index, plot_best_corr, text="Lead: " + lead_direction_text + " lag:" + str.tostring(best_lag) + " corr:" + str.tostring(best_corr, "#.##"),
style=label.style_label_left, color=color.new(color.green, 75), textcolor=color.white, size=size.small)
// ========== ALERTS ==========
alertcondition(lead_detected and best_dir == 1, title="NDX leads SPX detected", message="NDX leads SPX — lag: {{plot_1}} corr: {{plot_0}}")
alertcondition(lead_detected and best_dir == -1, title="SPX leads NDX detected", message="SPX leads NDX — lag: {{plot_1}} corr: {{plot_0}}")
// ========== INFORMATION TABLE ==========
var table t = table.new(position.top_right, 1, 5, border_width=1)
if barstate.islast
table.cell(t, 0, 0, "Resolution: " + res)
table.cell(t, 0, 1, "Best corr: " + (na(best_corr) ? "na" : str.tostring(best_corr, "#.##")))
table.cell(t, 0, 2, "Best lag: " + (na(best_lag) ? "na" : str.tostring(best_lag)))
table.cell(t, 0, 3, "Direction: " + lead_direction_text)
table.cell(t, 0, 4, "Confirm avg: " + (na(confirm_avg) ? "na" : str.tostring(confirm_avg, "#.##")))

Gartley Pattern ULTRA V6[NXT2017]+VolumeProfile+POC+SignalCountsGartley Pattern ULTRA V6 is a professional harmonic scanner designed to automatically detect and visualize valid Gartley patterns across multiple pivot lengths. Unlike standard indicators, this script includes advanced institutional tools like Volume Profile integration per pattern and a statistical dashboard.
Key Features: Multi-Pivot Scanning: Scans for patterns simultaneously across 9 different pivot lengths (from 5 to 233) to find structures on micro and macro levels. Volume Profile Integration: Automatically draws a Volume Profile (VP) covering the range from Point X to the current bar to analyze supply and demand within the pattern structure. POC Indication: Highlights the Point of Control (POC) to identify key support/resistance levels within the pattern. Statistics Dashboard: A table displaying the number of Bullish and Bearish patterns found for each pivot size. Customizable: Full control over colors, tolerance levels, and display options.
The Gartley Pattern Rules Used: This script strictly follows the classic ratios for the Gartley pattern: B Point: Strictly a 0.618 retracement of the XA leg. C Point: Retracement of AB (0.382 – 0.886). Crucially, Point C must not exceed Point A. D Point (Entry): The defining characteristic is the 0.786 retracement of the XA leg . Point D must not exceed Point X.
Settings & Inputs: Deviation Tolerance: Adjust the strictness of the ratio matching (default 30% allows for market noise). Volume Profile: Toggle the VP on/off, adjust resolution (rows), and transparency. Filter & History: Prevents duplicate signals for the same price structure.
How to use: Add the indicator to your chart. Bullish Gartleys are highlighted in Green and Bearish Gartleys in Fuchsia. The pattern completes at the D-point (78.6% of XA). Use the Volume Profile to confirm if the reversal is happening at a high-volume node.
This is a update of v1:

CypherPattern ULTRA V6 [NXT2017]+VolumeProfile+POC +SignalCountsCypher Pattern ULTRA V6 is a comprehensive harmonic scanner designed to automatically detect and visualize valid Cypher patterns across multiple pivot lengths. Unlike standard harmonic indicators, this script includes advanced features like Volume Profile integration per pattern and a statistical dashboard.
Key Features: Multi-Pivot Scanning: Scans for patterns simultaneously across 9 different pivot lengths (from 5 to 233) to find structures on micro and macro levels. Volume Profile Integration: Automatically draws a Volume Profile (VP) covering the range from Point X to the current bar to analyze supply and demand within the pattern structure. POC Indication: Highlights the Point of Control (POC) to identify key support/resistance levels within the pattern. Statistics Dashboard: A table displaying the number of Bullish and Bearish patterns found for each pivot size. Customizable: Full control over colors, tolerance levels, and display options.
The Cypher Pattern Rules Used: This script strictly follows the specific ratios for the Cypher pattern: B Point: 0.382 – 0.618 retracement of the XA leg. C Point: 1.13 – 1.414 extension of the AB leg (C projects beyond A). D Point (Entry): The unique characteristic of the Cypher is that the D point is the 0.786 retracement of the XC leg (not XA).
Settings & Inputs: Deviation Tolerance: Adjust the strictness of the ratio matching (default 30%). Volume Profile: Toggle the VP on/off, adjust resolution (rows), and transparency. Filter & History: Prevents duplicate signals for the same price structure.
How to use: Add the indicator to your chart. Bullish patterns are highlighted in Green (default) and Bearish patterns in Pink/Fuchsia. Look for the D-point completion for potential reversal entries. Use the Volume Profile to confirm if the reversal is happening at a high-volume node.

5-0 Pattern ULTRA V6 [NXT2017]+Volume Profile +POC +SignalCounts5-0 Pattern ULTRA V6
This script is an advanced harmonic scanner designed specifically to detect the 5-0 Pattern. Unlike standard harmonic indicators, the "ULTRA" version scans across 9 different pivot lengths simultaneously (from 5 up to 233) to ensure no valid structure is missed, regardless of the timeframe.
It includes an integrated Volume Profile feature that automatically analyzes the volume distribution within the pattern to help validate the Point of Control (POC) near the reversal zone.
What is the 5-0 Pattern? The 5-0 is a unique 5-point harmonic structure (X, A, B, C, D) discovered by Scott Carney. It is distinct from other patterns like the Gartley or Bat because it relies heavily on specific reciprocal extensions. The completion point (D) is defined by a 50% retracement of the BC leg.
Pattern Rules used in this indicator:
The AB leg is a 1.13 to 1.618 extension of the XA leg.
The BC leg is a 1.618 to 2.618 extension of the AB leg.
The CD leg (Entry Zone) is a distinct 50% retracement of the BC leg.
Key Features of V6
Multi-Pivot Scanning: The indicator runs 9 separate scanners in the background (Pivot lengths: 5, 8, 13, 21, 34, 55, 89, 144, 233). You can toggle specific lengths on/off in the settings.
Auto Volume Profile: When a pattern is found, the script draws a Volume Profile over the structure and highlights the Point of Control (POC) line. This helps determine if there is volume support/resistance at the trade location.
Statistics Dashboard: A dashboard table displays historical data, showing how many Bullish and Bearish patterns have been detected for each pivot size on the current chart.
Smart History Filtering: Includes a mechanism to prevent duplicate patterns from cluttering the chart.
Interactive Guide: A built-in "Guide Mode" can be activated in the settings to hide signals and display a text tutorial on how to trade the pattern.
Settings & Customization
Tolerance: Adjust the inaccuracy percentage to make the scanner stricter or looser regarding Fibonacci ratios.
Visuals: Fully customizable colors for Bullish/Bearish patterns, Target lines, and Volume Profiles.
Labels: Choose between showing "XABCD" lettering or a simple "5-0" tag with the pattern size.
Alerts: Native alert conditions are set up. You can create alerts to be notified instantly when a new pattern is formed.
Risk Disclaimer: Trading harmonic patterns involves risk. The 5-0 pattern is a reversal setup; always use proper risk management and confirmation before entering a trade.
Made by NXT2017
This is a new creation of v1:

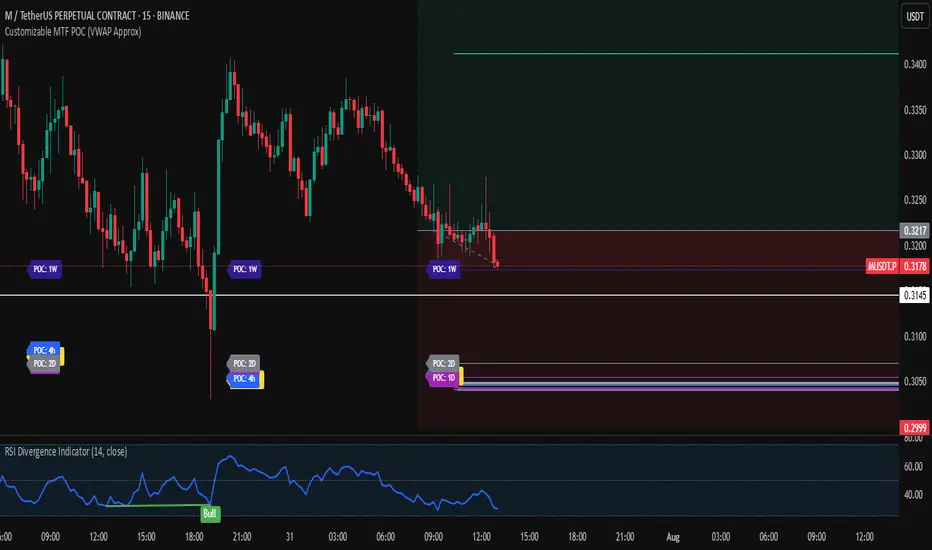
Customizable MTF POC (VWAP Approx)🔍 Multi-Timeframe VWAP POC Zones
This script displays volume-weighted average price (VWAP) levels from multiple timeframes on a single chart. Each VWAP level acts as a potential dynamic support or resistance zone, depending on the price action.
✅ Customizable timeframes included:
1m, 5m, 15m, 1h, 2h, 4h, 1D, 2D, 1W, 1M
📌 Key Features:
– VWAP lines per timeframe with adjustable visibility
– Color-coded for clarity
– Useful for identifying high-confluence support/resistance zones
📈 Usage Tip:
Combine this indicator with price action or liquidity zones for more accurate entries. Confluent VWAP zones across multiple timeframes often signal strong reaction areas.
⚠️ Note: This script uses VWAP as an approximation for Point of Control (POC). It does not rely on true volume profile histograms due to Pine Script limitations. For full volume profile analysis, use TradingView’s built-in “Fixed Range Volume Profile” tool.
REVELATIONS (VoVix - PoC) REVELATIONS (VoVix - POC): True Regime Detection Before the Move
Let’s not sugarcoat it: Most strategies on TradingView are recycled—RSI, MACD, OBV, CCI, Stochastics. They all lag. No matter how many overlays you stack, every one of these “standard” indicators fires after the move is underway. The retail crowd almost always gets in late. That’s never been enough for my team, for DAFE, or for anyone who’s traded enough to know the real edge vanishes by the time the masses react.
How is this different?
REVELATIONS (VoVix - POC) was engineered from raw principle, structured to detect pre-move regime change—before standard technicals even light up. We built, tested, and refined VoVix to answer one hard question:
What if you could see the spike before the trend?
Here’s what sets this system apart, line-by-line:
o True volatility-of-volatility mathematics: It’s not just "ATR of ATR" or noise smoothing. VoVix uses normalized, multi-timeframe v-vol spikes, instantly detecting orderbook stress and "outlier" market events—before the chart shows them as trends.
o Purist regime clustering: Every trade is enabled only during coordinated, multi-filter regime stress. No more signals in meaningless chop.
o Nonlinear entry logic: No trade is ever sent just for a “good enough” condition. Every entry fires only if every requirement is aligned—local extremes, super-spike threshold, regime index, higher timeframe, all must trigger in sync.
o Adaptive position size: Your contracts scale up with event strength. Tiny size during nominal moves, max leverage during true regime breaks—never guesswork, never static exposure.
o All exits governed by regime decay logic: Trades are closed not just on price targets but at the precise moment the market regime exhausts—the hardest part of systemic trading, now solved.
How this destroys the lag:
Standard indicators (RSI, MACD, OBV, CCI, and even most “momentum” overlays) simply tell you what already happened. VoVix triggers as price structure transitions—anyone running these generic scripts will trade behind the move while VoVix gets in as stress emerges. Real alpha comes from anticipation, not confirmation.
The visuals only show what matters:
Top right, you get a live, live quant dashboard—regime index, current position size, real-time performance (Sharpe, Sortino, win rate, and wins). Bottom right: a VoVix "engine bar" that adapts live with regime stress. Everything you see is a direct function of logic driving this edge—no cosmetics, no fake momentum.
Inputs/Signals—explained carefully for clarity:
o ATR Fast Length & ATR Slow Length:
These are the heart of VoVix’s regime sensing. Fast ATR reacts to sharp volatility; Slow ATR is stability baseline. Lower Fast = reacts to every twitch; higher Slow = requires more persistent, “real” regime shifts.
Tip: If you want more signals or faster markets, lower ATR Fast. To eliminate noise, raise ATR Slow.
o ATR StdDev Window: Smoothing for volatility-of-volatility normalization. Lower = more jumpy, higher = only the cleanest spikes trigger.
Tip: Shorten for “jumpy” assets, raise for indices/futures.
o Base Spike Threshold: Think of this as your “minimum event strength.” If the current move isn’t volatile enough (normalized), no signal.
Tip: Higher = only biggest moves matter. Lower for more signals but more potential noise.
o Super Spike Multiplier: The “are you sure?” test—entry only when the current spike is this multiple above local average.
Tip: Raise for ultra-selective/swing-trading; lower for more active style.
Regime & MultiTF:
o Regime Window (Bars):
How many bars to scan for regime cluster “events.” Short for turbo markets, long for big swings/trends only.
o Regime Event Count: Only trade when this many spikes occur within the Regime Window—filters for real stress, not isolated ticks.
Tip: Raise to only ever trade during true breakouts/crashes.
o Local Window for Extremes:
How many bars to check that a spike is a local max.
Tip: Raise to demand only true, “clearest” local regime events; lower for early triggers.
o HTF Confirm:
Higher timeframe regime confirmation (like 45m on an intraday chart). Ensures any event you act on is visible in the broader context.
Tip: Use higher timeframes for only major moves; lower for scalping or fast regimes.
Adaptive Sizing:
o Max Contracts (Adaptive): The largest size your system will ever scale to, even on extreme event.
Tip: Lower for small accounts/conservative risk; raise on big accounts or when you're willing to go big only on outlier events.
o Min Contracts (Adaptive): The “toe-in-the-water.” Smallest possible trade.
Tip: Set as low as your broker/exchange allows for safety, or higher if you want to always have meaningful skin in the game.
Trade Management:
o Stop %: Tightness of your stop-loss relative to entry. Lower for tighter/safer, higher for more breathing room at cost of greater drawdown.
o Take Profit %: How much you'll hold out for on a win. Lower = more scalps. Higher = only run with the best.
o Decay Exit Sensitivity Buffer: Regime index must dip this far below the trading threshold before you exit for “regime decay.”
Tip: 0 = exit as soon as stress fails, higher = exits only on stronger confirmation regime is over.
o Bars Decay Must Persist to Exit: How long must decay be present before system closes—set higher to avoid quick fades and whipsaws.
Backtest Settings
Initial capital: $10,000
Commission: Conservative, realistic roundtrip cost:
15–20 per contract (including slippage per side) I set this to $25
Slippage: 3 ticks per trade
Symbol: CME_MINI:NQ1!
Timeframe: 1 min (but works on all timeframes)
Order size: Adaptive, 1–3 contracts
No pyramiding, no hidden DCA
Why these settings?
These settings are intentionally strict and realistic, reflecting the true costs and risks of live trading. The 10,000 account size is accessible for most retail traders. 25/contract including 3 ticks of slippage are on the high side for NQ, ensuring the strategy is not curve-fit to perfect fills. If it works here, it will work in real conditions.
Tip: Set to 1 for instant regime exit; raise for extra confirmation (less whipsaw risk, exits held longer).
________________________________________
Bottom line: Tune the sensitivity, selectivity, and risk of REVELATIONS by these inputs. Raise thresholds and windows for only the best, most powerful signals (institutional style); lower for activity (scalpers, fast cryptos, signals in constant motion). Sizing is always adaptive—never static or martingale. Exits are always based on both price and regime health. Every input is there for your control, not to sell “complexity.” Use with discipline, and make it your own.
This strategy is not just a technical achievement: It’s a statement about trading smarter, not just more.
* I went back through the code to make sure no the strategy would not suffer from repainting, forward looking, or any frowned upon loopholes.
Disclaimer:
Trading is risky and carries the risk of substantial loss. Do not use funds you aren’t prepared to lose. This is for research and informational purposes only, not financial advice. Backtest, paper trade, and know your risk before going live. Past performance is not a guarantee of future results.
Expect more: We’ll keep pushing the standard, keep evolving the bar until “quant” actually means something in the public code space.
Use with clarity, use with discipline, and always trade your edge.
— Dskyz , for DAFE Trading Systems

Simple Volume Profile with POC (Daily/4H Sessions) [Enhanced]Simple Volume Profile with a Point of Control (POC). The script does the following:
Accumulates volume in user-defined “bins” (price buckets) for a session.
Resets the volume accumulation each new “session”:
On a Daily chart, it considers weekly sessions (resets each Monday).
On a 4H chart, it considers daily sessions (resets at the start of each trading day).
Finds the Point of Control (the price bin with the highest accumulated volume).
Plots the histogram and the POC line on the chart.

Range Detect SystemTechnical analysis indicator designed to identify potential significant price ranges and the distribution of volume within those ranges. The system helps traders calculate POC and show volume history. Also detecting breakouts or potential reversals. System identifies ranges with a high probability of price consolidation and helps screen out extreme price moves or ranges that do not meet certain volatility thresholds.
⭕️ Key Features
Range Detection — identifies price ranges where consolidation is occurring.
Volume Profile Calculation — indicator calculates the Point of Control (POC) based on volume distribution within the identified range, enhancing the analysis of market structure.
Volume History — shows where the largest volume was traded from the center of the range. If the volume is greater in the upper part of the range, the color will be green. If the volume is greater in the lower part, the color will be red.
Range Filtering — Includes multi-level filtering options to avoid ranges that are too volatile or outside normal ranges.
Visual Customization — Shows graphical indicators for potential bullish or bearish crossovers at the upper and lower range boundaries. Users can choose the style and color of the lines, making it easier to visualize ranges and important levels on the chart.
Alerts — system will notify you when a range has been created and also when the price leaves the range.
⭕️ How it works
Extremes (Pivot Points) are taken as a basis, after confirming the relevance of the extremes we take the upper and lower extremes and form a range. We check if it does not violate a number of rules and filters, perform volume calculations, and only then is the range displayed.
Pivot points is a built-in feature that shows an extremum if it has not been updated N bars to the left and N bars to the right. Therefore, there is a delay depending on the bars specified to check, which allows for a more accurate range. This approach allows not to make unnecessary recalculations, which completely eliminates the possibility of redrawing or range changes.
⭕️ Settings
Left Bars and Right Bars — Allows you to define the point that is the highest among the specified number of bars to the left and right of this point.
Range Logic — Select from which point to draw the range. Maximums only, Minimums only or both.
Use Wick — Option to consider the wick of the candles when identifying Range.
Breakout Confirmation — The number of bars required to confirm a breakout, after which the range will close.
Minimum Range Length — Sets the minimum number of candles needed for a range to be considered valid.
Row Size — Number of levels to calculate POC. *Larger values increase the script load.
% Range Filter — Dont Show Range is than more N% of Average Range.
Multi Filter — Allows use of Bollinger Bands, ATR, SMA, or Highest-Lowest range channels for filtering ranges based on volatility.
Range Hit — Shows graphical labels when price hits the upper or lower boundaries of the range, signaling potential reversal or breakout points.
Range Start — Show points where Range was created.

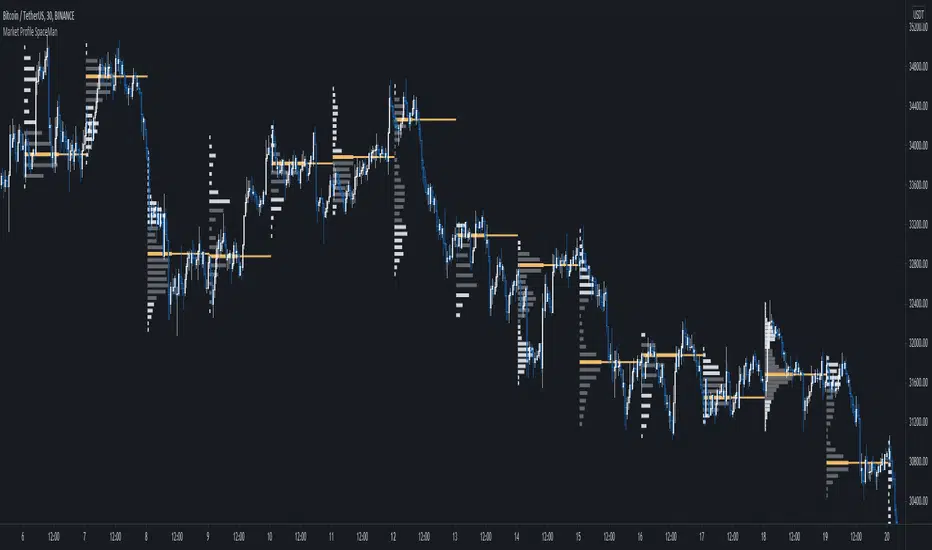
[Pt] Daily Market Profile / TPOA great mentor of mine once told me, trading is like driving. When you are driving, there are directions and road signs to follow. The key areas and levels from TPO market profile are the road signs in trading, you shouldn't trade without them much like you shouldn't drive without road signs, as you will get lost.
From Wikipedia: "A Market Profile is an intra-day charting technique (price vertical, time/activity horizontal) devised by J. Peter Steidlmayer, a trader at the Chicago Board of Trade (CBOT), ca 1959-1985. Steidlmayer was seeking a way to determine and to evaluate market value as it developed in the day time frame. The concept was to display price on a vertical axis against time on the horizontal, and the ensuing graphic generally is a bell shape--fatter at the middle prices, with activity trailing off and volume diminished at the extreme higher and lower prices." If you are unfamiliar with the concept, search for Market Auction Theory, Market Profile, and TPO on the web.
What's cool about this script?
As a professional trading, you should be drafting a trading plan and drawing all your key areas and levels before entering a trade. If you are trading with market profile, with this script, you no longer have to spend the time it takes to manually draw those key areas and levels. All are automatically generated with this script to give you the visual cues in your trades~!!
**IMPORTANT** Please note that due to the limitation on TradingView, there can only be limited number of boxes and lines that can be generated per indicator. Hence, this script only aims to provide you with as many key areas and levels as possible. This may be mitigated by having multiple instances of this indicator. Please use at your risk and discretion.
This script provides a comprehensive set of indicators / elements of daily TPO market profile, which includes the following:
- Market Profile based on TPO
- Point of Control (POC)
- Value Area (VA)
- Single Prints (SP)
- Excess (EX)
- Naked vs Visited (Touched) POC and VA
This script also includes the following key features that hopes to provide value in your trading:
- Automatically generated key areas and levels, including all the elements above
- Those key areas and levels will fade away as they become less significant, based on number of crosses and touches
- Customizable display settings
- Customizable session for generating the MP
- Two positions for MP placement
Setting descriptions:

Market sessions and Volume profile - By LeviathanThis script allows you to keep track of Forex market sessions (Tokyo, London and New York), as well as Daily, Weekly and Monthly sessions. All of them are accompanied by Volume Profile options where you can view VP Histogram, Point of Control, Value Area High and Value Area Low.
Colors, lines and other design preferences are fully customizable.
* Volume Profile of shorter sessions (eg. Tokyo, London, New York) works better when using lower timeframes such as 15min, 5min, etc.
** Use timeframe higher than 15min when viewing Monthly sessions
Indicator settings overview:
SESSION TYPE
- Tokyo session (1:00 - 9:00 UTC/ GMT )
- London session (7:00 - 16:00 UTC/ GMT )
- New York session (13:00 - 22:00 UTC/ GMT )
- Daily session
- Weekly session
- Monthly session
DISPLAY
- Show Volume Profile (Show or hide Volume Profile histogram)
- Show POC (Show or hide Point Of Control line)
- Show VAL (Show or hide Value Area Low line)
- Show VAH (Show or hide Value Area High line)
- Show Live Zone (Show or hide the ongoing session)
VOLUME PROFILE SETTINGS
- Resolution (The higher the value, the more refined of a profile, but less profiles are shown on the chart)
- Smooth Volume Data (Useful for assets that have very large spikes in volume over large bars, helps create better profiles)
APPEARANCE
- Up Volume color (Pick a custom color for up/ bullish volume profile nodes)
- Down Volume color (Pick a custom color for down/ bearish volume profile nodes)
- POC color and thickness (Pick a custom color and thickness for Point Of Control line)
- VAH color and thickness (Pick a custom color and thickness for Value Area High line)
- VAL color and thickness (Pick a custom color and thickness for Value Area Low line)
- Session box thickness (Pick a custom thickness for the session box. Color is provided automatically with optimal contrast)
** Some VP elements are inspired by @LonesomeTheBlue's volume profile script

Market Profile Fixed ViewSome instruments does not provide any volume information, therefore, as a fixed volume profile user, I needed a fixed market profile indicator to use the same principles, regardless of whether the volumes are available or not.
This script draws a market profile histogram corresponding to price variations within a specific duration, you only need to specify Start and End date/time values to see the histogram on your chart.
Details
Two lines corresponding to highest/lowest prices are displayed around the histogram
The redline corresponds to the POC (point of control)
Options
Start calculation
End calculation
Bars number (histogram resolution, currently locked to a max value of 50 bars)
Display side/Width (allows to modify size of bars, to the left or to the right)
Bars/Borders/POC Color customization
Notes
This script will probably be updated (to add VAH/VAL zones, and maybe other options). However, some common market profile attributes have not been implemented yet since I don't really use them)

Market Profile Visible RangeSup TV, 2 important points .
1) surprisingly, it's the first MP Visible Range script on TV;
2) This one doesn't use any bagging/binning*, instead each row represents the time spent on the actual minimal price steps (aka ticks).
The script will be further extended with usual market profile related functionally in future updates. At this point we have:
- Profile itself (each row represents how many bars touch the given price);
- Mode of the profile (called POC)**;
* Still it will be introduced in future when I will find / design the proper aggregating technique. It is vital for processing very wide price ranges (for example, 500 days on ES futures).
** The script correctly calculates POC by finding all the modes in the data & choosing the closest one to data's midrange.
For this kind of technical instrument finally it was more convenient to use Pine Script 5 (btw it's my first Pine 5).
Basically this script is a side-effect of another R&D I'm doing, the stuff is useful tho so let's go.
By choosing length we both specify the amount of data to be processed & the profile's location screen-wise. It's pretty cool and & useful, on my screen it's always almost touching the left side and still always visible.
The code is heavily commented in order to be understood fast, nothing fantastic, just a lil patience required this time.
Rationale
Market & volume profiles are well known concepts, lotta info available, the most important point of all that is that MP is just another way of visualizing data that lets you notice things you don't usually notice on sequential charts. From my side I can only add that it's better to use your own brain for thinking and reconsidering using volume profile in all the cases, especially on decentralized markets (unless you're aggregating ALL the volume data from everywhere, including options, OTC etc).
Here is it, for you

SpaceTime Profile CompositesSpaceTime Profile Composites
SpaceTime Profiel Composites provides an alternative composite builder to the existing solution in the SpaceTime Profile Advanced.
Using the new pinev5 I utilize the ability for user confirmed data to give them the choice in time in a more interactable and user friendly way.
The main advantage of this is the ability to create multiple composites without multiple uses of SpaceTime Profile Advanced, additionally the user can select the indicator and edit the composite start time using the chart as opposed to the date picker in pine.
The indicator is fully fleshed out with all the features:
PoC
NPoC
Single Prints
Naked Single Prints
Value Area
Value Area Levels
Naked Value Area Levels
Excess
Poor highs and lows
Initial Balance
Auto TickSize
Auto TickSize
This has been heavily adjusted to allow greater detail, and less reliant on volatility, should this work well consistently SpaceTime Profile Advanced may also recieve this change to auto ticksize.
How To Use
Composites are best utilized when multiple value areas are overlapping with their POCS in range of the previous VA's, using a composite
the user is able to generate the greater picture for how this area will provide useful levels of interest, instead of multiple smaller profiles, the user can utilize one larger profile to give more accurate levels of reaction.

Hancock - POC VAThis indicator shows POC (Point of Control) and VA (Value Area) High and Low as well as the developing ranges. This indicator makes use of the new arrays which means the resolution for calculating POC and VA is up to 100k bins at, in most cases, tick resolution and allows for custom time-frames.
Not much else needs to be said about this indicator.
Happy Trading
Hancock

KIMATIX LITE Delta ProfileThis indicator provides a clean, market-structure view of where participation concentrates and which side is in control across price levels.
The Lite version is intentionally reduced to focus on context over execution while keeping the visual identity of the full profile.
What is shown
Sentiment Profile (right side)
Displays directional dominance at each price level:
Bullish rows when buying pressure dominates
Bearish rows when selling pressure dominates
Point of Control (POC)
Value Area High / Low (VAH / VAL)
Lite Version
No left-side volume profile
No delta labels or historical delta tracking
No lower-timeframe or orderflow proxy
No alerts or event notifications
No visible-range logic or advanced controls
All calculations run on the chart timeframe only, making this version lighter and suitable for public use while preserving structural relevance.
Intended use
This indicator is designed to:
Identify high-interest price zones
Assess directional pressure at each level
Support bias and location decisions
Complement other execution or confirmation tools
It is not an entry or signal system and does not provide trade timing.
The full version is distributed separately.
More information can be found here:
whop.com

Cnagda Trading ToolCnagda Trading Tools - complete set of intraday trading
1. Trendline breakout based On ATR.
2. Live RSI, volume/candle average 20 Periods, trend direction last 34 periods, and some useful dashboard features.
3. Ma Scalp Line provide trend support and resistance + Where Line More Flat Previous Time You Also Use That Range As Support And Resistance
4. RSI based POC ( Point Of Control) indicate high Volume Area like fixed Range Volume profile
5. London session breakout with buy/sell Signal and NewYork session opening half hour range breakout with Buy/sell signal
Ma Scalp Buy And Sell Signal For Short term Scalping ( 5 Min Timeframe) Based on Ema And Wma Crossover
I hope these tools will improve your trading, but you should trade only after proper research, this indicator is not responsible for any loss.

Advanced Trend Panel v3.1This is a comprehensive dashboard indicator designed to give traders a multi-faceted view of the market at a single glance. It combines key indicators across multiple timeframes, calculates trend duration, and presents all information in a clean, color-coded table. This tool is perfect for confirming trade ideas, identifying trend alignment, and understanding the underlying market dynamics.
#### Key Features:
* **All-in-One Dashboard:** A convenient on-chart table summarizes the state of multiple key indicators, saving you screen space and time.
* **Multi-Timeframe (MTF) Forecast:** Analyzes the long-term trend on a higher timeframe (e.g., Daily) to provide context for the current chart's trend.
* **Trend Analysis:** Uses dual sets of EMAs (long-term and short-term) to define the primary and immediate trend directions.
* **Trend Duration:** A unique feature that calculates how long the current short-term and long-term trends have been active, helping you gauge trend maturity.
* **Core Indicators Included:**
* **ADX:** Measures trend strength to differentiate between strong trends and weak or sideways markets.
* **RSI:** Identifies overbought and oversold conditions.
* **Point of Control (POC):** Shows the price level with the highest traded volume over a lookback period, acting as a key level of support/resistance.
* **Volume:** Compares current volume to its moving average to spot unusual activity.
* **Customizable Alerts:** Set up alerts for trend changes (long-term or short-term), RSI crossing into overbought/oversold zones, or shifts in ADX trend strength.
#### How to Use:
1. Apply the indicator to your chart.
2. In the settings, configure the timeframes, indicator lengths, and display options to match your trading style.
3. Use the table to quickly assess if the long-term trend, short-term trend, and momentum are aligned.
4. Enable alerts to be notified of key changes in market conditions without having to watch the chart constantly.
**Disclaimer:** This script is for educational purposes only and should not be considered financial advice. All trading involves risk. Past performance is not indicative of future results. Please backtest and use this tool as part of a comprehensive trading plan with proper risk management.
Feedback is always welcome! If you find this indicator useful, please leave a like.

Multi Ranges Volume Distribution [LuxAlgo]The Multi Ranges Volume Distribution tool allows traders to see the volume distribution by price for three different timeframes simultaneously. Each distribution can report the total amount of accumulated volume or the accumulated buy/sell volume separately.
Levels are displayed at the top and bottom of each timeframe's range, as well as the POC or level with the most volume.
🔶 USAGE
By default, the tool displays daily, weekly, and monthly volume distributions, highlighting the accumulated volume within each row.
Each distribution shows the volume at each price, as well as three lines: the top and bottom prices, and the price at which the most volume was traded.
The reported accumulated volume can be useful for highlighting which price areas are of the most interest to traders, with the specific timeframe specifying whether this interest is long-term or short-term.
🔹 Timeframes & Rows
Traders can adjust the timeframe and the number of rows for each volume distribution.
This is useful for multi-timeframe analysis of volume at the same price levels, or for obtaining detailed data within the same timeframe.
The chart above shows three volume distributions with the same monthly timeframe but a different number of rows; each is more detailed than the previous one.
🔹 Total vs Buy & Sell Volume
Traders can choose to display either the total volume or the buy and sell volumes.
As we can see on the above chart, the background of each row uses a gradient that is a function of the delta between the buy and sell volumes.
This is useful to determine which areas attract buyers and sellers.
🔶 SETTINGS
Volume Display: Select between total volume and buy and sell volume.
Distance between each box: Adjust the spacing of the volume distributions.
Period A: Select a timeframe and the number of rows.
Period B: Select a timeframe and the number of rows.
Period C: Select a timeframe and the number of rows.

Volume Analysis - Heatmap and Volume ProfileHello All!
I have a new toy for you! Volume Analysis - Heatmap and Volume Profile . Honestly I started to work to develop Volume Heatmap then I decided to improve it and add more features such Volume profile, volume, difference in Buy/Sell volumes etc. I tried to put my abilities into this script and tried to use some new Pine Language™ features ( method, force_overlay, enum etc features ). I hope the usage of these new features would be an example for Pine Programmers.
Lets talk about how it works:
- It gets number of Rows/Columns from the user for each candle to create heatmap
- It calculates the number of the candles to analyze. Number of the candles may change by number of Rows/columns or if any volume / difference in volumes / volume profile is enabled
- It gets Closing/Opening price, Volume and Time info from lower time frame for each candle ( it can be up to 100K for each candle )
- After getting the data it calculates lower time frame to analyze
- Then it calculates how closing price moves, how much volume on each move and create boxes by the volume/move in each box
- The colors for each box calculated by volume info and closing price movements in the lower time frame
- It shows the boxes on Absolute places or Zero Line optionally
- it shows Volume, Cumulative volume, Difference between Buy/Sell volume for each column
- it changes empty box color by Chart background color, also you can change transparency
- At this time it creates Volume Profile with up to 25 rows
- As a new Pine Language™ feature, it can show Volume Profile in the indicator window or in Main chart, shows Value Area, Value Area High (VAH), Value Area Low (VAL), and draw it and POC (Point Of Control) in the indicator window and/or in the main chart
- Honestly the feature I like is that: For the markets that are not open 24/7, it combines the data from the lower time period without any gaps. For example, if you work for a market that is closed on Saturdays and Sundays, it ensures data integrity by omitting weekends and holidays. so for example if the data is like "ABC---DEF-X---YL-Z" then it makes this data like "ABCDEFXYLZ". In this way, there will be no data breaks in the displayed boxes, there will be no empty colons, and it will appear as if data is coming in at any time.
- Finally it shows Info Panel to give info, its background color automatically changes by the Chart background color
- Important! You should set your "Plan" accordingly, your plan is "Premium or Higher" or "Lower tier". so the script can understand the minimum time frame it can get data!!
I tried to share many screenshots below to explain it much better
How it looks?
it shows Highest Buy/Sell volumes brighter, move volume -> brighter
Volume Profile ( up to 25 row s) ( number of contained candles should be more than 1 )
Volume Profile can be shown in the main chart optionally
How the main chart looks:
Closing price shown and you can enable it, change colors & line width
Can include many candles according to Row&Column number you set
Optionally it can show cumulative volume for each candle
Closing prices from lower time frame
Shows Candle Body by changing background colors
It can shows all included candles on Zero line
You can change the colors of many things
You can set Empty box and border transparency
Table, Empty box Colors adjustment done automatically by chart background color
Sometimes we can not get data from some historical candles if time frame is high such 2days, 1 week etc, and it looks like:
It also checks if Chart time frame and Chart type is suitable
Enjoy!

PhantomFlow DynamicLevelsThe PhantomFlow Dynamic Levels indicator analyzes the dynamic volume over the period specified in the Period field. Channel boundaries can be used as dynamic support and resistance levels when trading within a range. The POC level also serves as a level at which the price may react during trend movements. The Period Multiplier parameter affects how many dynamic levels will be displayed. The Accuracy parameter influences the precision of volume calculations.
These levels are crucial for intraday traders as they serve as support or resistance. The Value Area zone includes 70% of the traded volume over the selected period. In other words, it represents the price region where the majority of traders believe the fair value for the asset lies.
The indicator's name, Dynamic Levels, aptly captures its essence. It analyzes trading volume at various price levels, tracking the sentiment dynamics of traders. When the asset's price decreases or increases as a result of trading, the Dynamic Levels indicator displays a new level on the chart. This results in a plotted line on the chart, allowing us to observe the movement dynamics of both the value area and the maximum volume level.
Standard indicators do not provide real-time visibility into level shifts, making the use of the Dynamic Levels indicator a competitive advantage in market trading across any time frame.
We borrowed the volume profile calculation code from @LonesomeTheBlue. Thank you for the work done!
