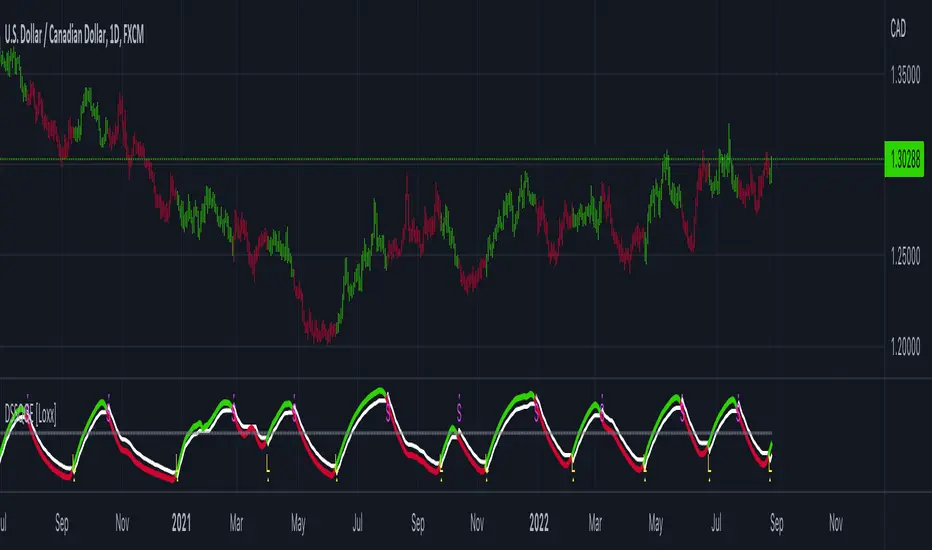
Step-MA Filtered Stochastic [Loxx]Step-MA Filtered Stochastic is a stochastic indicator with step moving average filtering. This smooths the signal by filtering out noise.
What is the Stochastic Indicator?
The stochastic oscillator, also known as stochastic indicator, is a popular trading indicator that is useful for predicting trend reversals. It also focuses on price momentum and can be used to identify overbought and oversold levels in shares, indices, currencies and many other investment assets.
The stochastic oscillator measures the momentum of price movements. Momentum is the rate of acceleration in price movement. The idea behind the stochastic indicator is that the momentum of an instrument’s price will often change before the price movement of the instrument actually changes direction. As a result, the indicator can be used to predict trend reversals.
The stochastic indicator can be used by experienced traders and those learning technical analysis. With the help of other technical analysis tools such as moving averages, trendlines and support and resistance levels, the stochastic oscillator can help to improve trading accuracy and identify profitable entry and exit points.
Included:
Bar coloring
3 signal variations w/ alerts
Loxx's Expanded Source Types
חפש סקריפטים עבור "stoch"

Mulitiple time frame Slow Stochastic JamilaThis is a very useful Multiple time frame Slow Stochastic for traders who which to entry and exit when the slow stochastic of the different time frame are all in sync.
How to use this indicator. Only entry long when the day, 3day, weekly, monthly stochastic are going up. Exit when the day or 3day stochastic reaches 80% level.

OMA-Filtered Kase Permission Stochastic [Loxx]OMA-Filtered Kase Permission Stochastic is a special implementation of Kase Permission Stochastic by Kase StatWare.
What is Kase StatWare?
Kase StatWare has been around since 1992 and is a technical analysis trading indicator package developed by the acclaimed market technician and former energy trader Cynthia A. Kase. StatWare’s self-optimizing indicators help professional and individual traders to form a precise and systematic approach to discretionary trading and trade risk management.
Kase StatWare creates subscription-based technical analysis tools mainly for Stocks and Futures trading which can be subscribed to at a monthly cost.
What is Kase Permission Stochastic?
The Kase Permission Stochastic is a momentum indicator that examines a synthetic longer bar length, that by default, is three (5x by default for this implementation here) times higher than the bar length it is plotted against.
Included
Alerts
Signals
Bar coloring

Double-Smoothed Stochastic QQE [Loxx]Double-Smoothed Stochastic QQE is a QQE indicator that uses a double-smoothed stochastic calculation for it's source input instead of traditional RSI.
What is the double-smoothed stochastic?
The Double Smoothed Stochastic indicator was created by William Blau. It applies Exponential Moving Averages (EMAs) of two different periods to a standard Stochastic %K. The components that construct the Stochastic Oscillator are first smoothed with the two EMAs. Then, the smoothed components are plugged into the standard Stochastic formula to calculate the indicator.'
What is Qualitative Quantitative Estimation (QQE)?
The Qualitative Quantitative Estimation (QQE) indicator works like a smoother version of the popular Relative Strength Index ( RSI ) indicator. QQE expands on RSI by adding two volatility based trailing stop lines. These trailing stop lines are composed of a fast and a slow moving Average True Range (ATR).
There are many indicators for many purposes. Some of them are complex and some are comparatively easy to handle. The QQE indicator is a really useful analytical tool and one of the most accurate indicators. It offers numerous strategies for using the buy and sell signals. Essentially, it can help detect trend reversal and enter the trade at the most optimal positions.
Included:
Loxx's Expanded Source Types
Alerts
Signals
Bar coloring
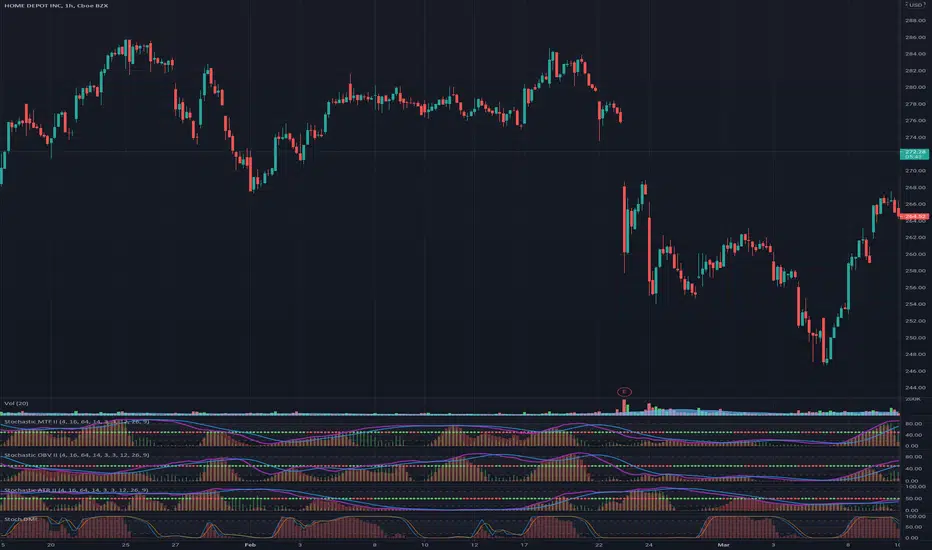
Stochastic OBV IIUses OBV to plot a stochastic graph. Incorporates the macd of obv and plots a stochastic of this macd. Additionally stochastic rsi of OBV is plotted in histograms.
The stochastic OBV is in the higher timeframe(current time frame * 4).
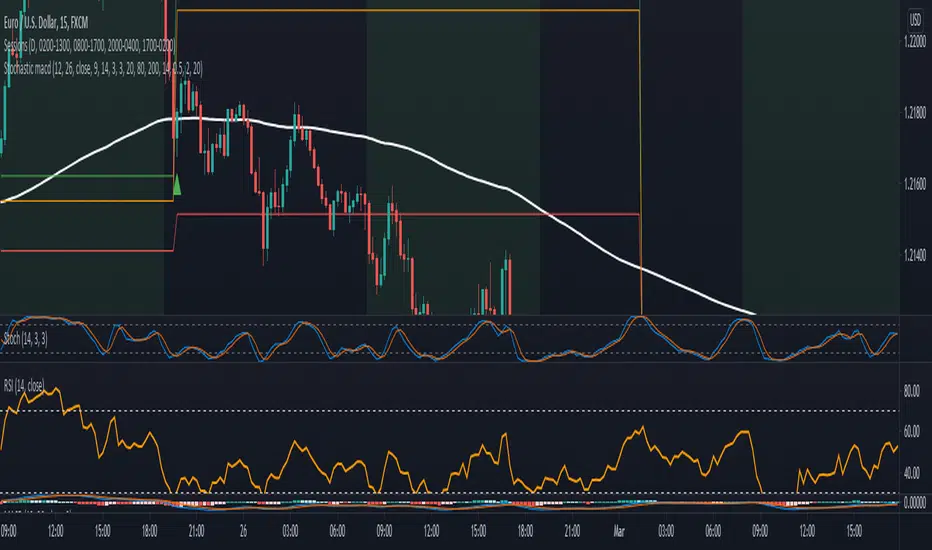
Stochastic with MACD filter + SL/TP + AlertsLong Arrow : close of the candle is above ema + Stochastic is oversold + MACD is below 0 + Stochastic cross up
Short Arrow : close of candle is below ema + Stochastic is overbought + MACD is above 0 + Stochastic cross down
Also added SL, 1:1 and TP where SL can be varied by ATR value and TP is set to 2:1 RR but it can be varied too.
It is not meant to take every single trade even though that might already be profitable.
For higher winrate look for the higher timeframe trend for example when trading the 15min look if the Daily 8ema is going up or down.
Also only take trades when there is either a hidden divergence on RSI or a smaller normal divergence.
The I take the normal divergenes alo when there is no higher high like an M or lower low for longs like a W these tend to work out pretty good too.
Alerts are in it too.
Have Fun :)
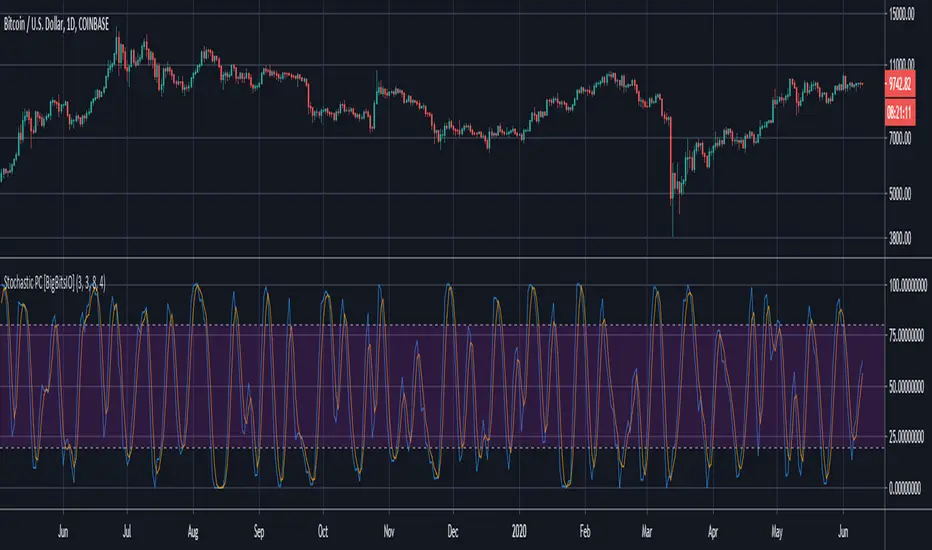
Stochastic PC [BigBitsIO]This script is a very simple stochastic calculation similar to Stochastic RSI that calculates a stochastic value of a moving average of the percentage price change. The purpose of the indicator is to find positive and negative volatility momentum peaks which might be able to help identify changes in trends. Like other stochastic indicators, it may be best used in combination with other indicators.
Explained:
- First gets the % change for the candle from open to close. Green candles produce positive values, red candles produce negative values.
- Then it creates a moving average of that number to try and reduce impacts of very large moves, although this can be changed with the super-fast smoothed length setting. Set it to 1 to remove all smoothing.
- After that, it creates a K value using a stochastic calculation based on the range of the price change moving average we created in the previous step. Set the smoothK to one to use a fast stochastic calculation, it is a slow stochastic calculation by default (3-period SMA of stochastic)
- Finally, to create the D value it calculates a 3-period SMA of the K value.
FAQ:
- Why is this script useful?
- This script can help identify the peaks and valleys of volatility momentum
DISCLAIMER: For educational and entertainment purposes only. Nothing in this content should be interpreted as financial advice or a recommendation to buy or sell any sort of security or investment including all types of crypto. DYOR, TYOB.
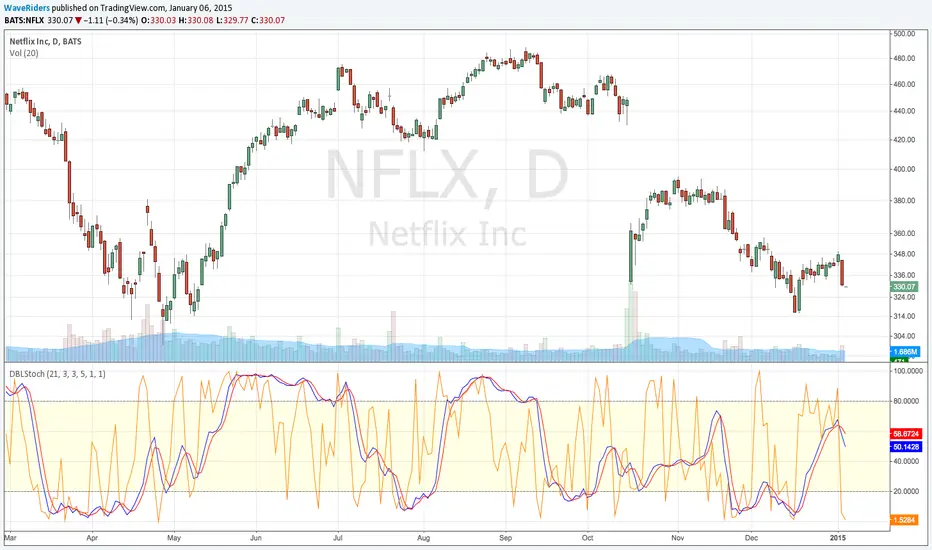
Double StochasticDouble Stochastic is use 2 Stochastic for monitoring price swing.
Slow Stochastic (21,3,3) for monitoring the swing of price cycle.
Fast Stochastic (5,1,1) for monitoring the swing in price ripple.
When 2 Stochastic run way from each other, separately , mean Price will move only retrace or rebound in ripple movement.
When 2 Stochastic Flip and Run break thru from overbought or oversold zone , mean Price will move to change in major direction
Useful for decision to hold position or take action
Such as Price move up and start decline, Slow Stochastic run above 80 and only Fast Stochastic swing down, mean Price just move retrace down. Price still has chance to flip and move up again. This will help we hold the Long Position or know where to open more Long position on price dip.
Or Price break down to support line and start rebound , Slow Stochastic run below 20 and only Fast Stochastic Swing Up , mean Price just move rebound to go down again. This will help we can hold Short Position or know where to open more Short position.
Wave Riders ...
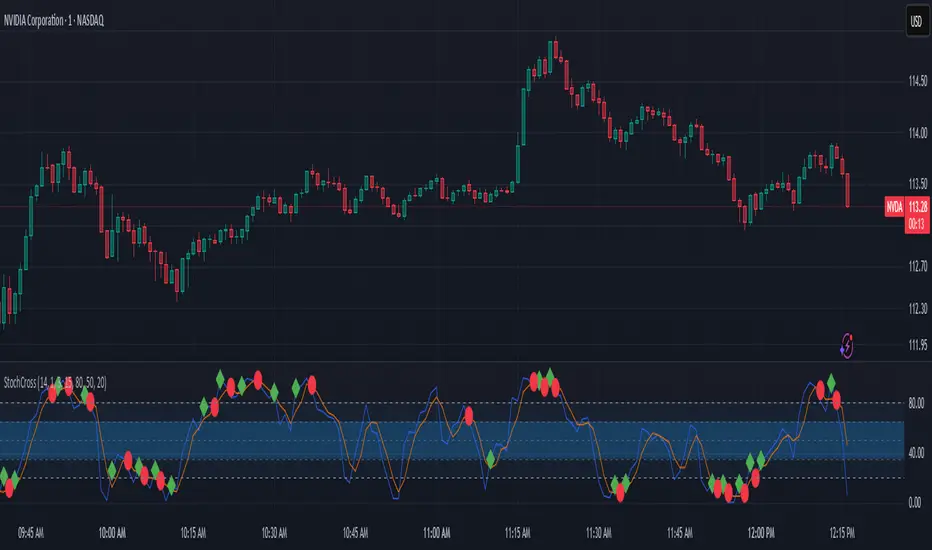
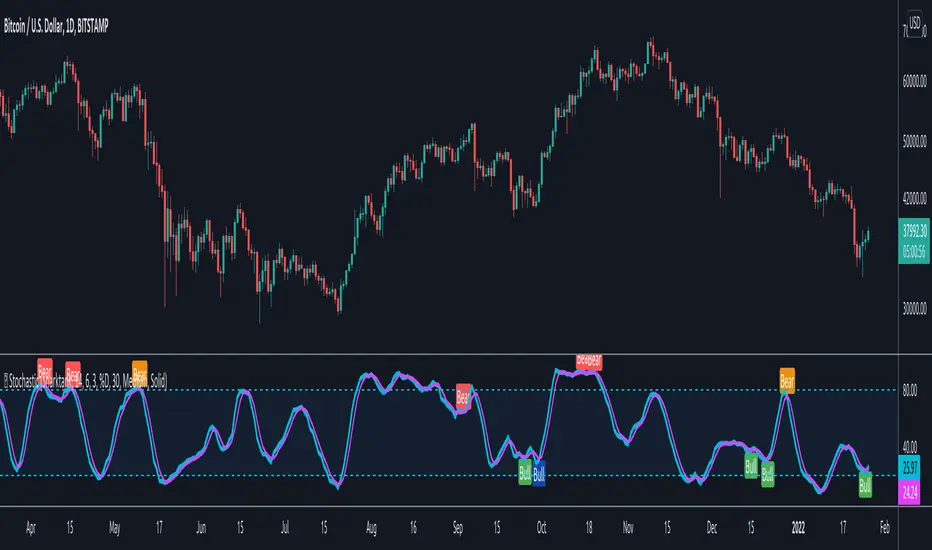
Stochastic w/ Crossovers and Deadspace FilterThis is my extremely useful modification of the classic Stochastic indicator. It includes clear signals of crossovers and crossunders of the K/D lines.
Additionally, I added a "deadspace" filter to remove plotting of signals in the middle of the range, which tend to be misleading.
This can be incredibly useful to find entries and trends, especially when using 2 instances of this indicator at different lengths (such as one of 14,1,3 and another of 28,3,6).
The deadspace filter works based on the middle line, so a value of 20 will not plot any crossovers between 30-70.
MarketSmith Stochasticversion=5
This version of the stochastic produces the identical stochastic as used in MarketSmith
The three primary differences from a classic stochastic are as follows:
1. Close values only
2. 5-day ema instead of 3-day simple moving averages for smoothing the fast and slow lines
3. Slow and fast lines are truncated to integer values
by Mike Scott
2023-09-11
Stochastic Momentum Index (SMI) Refurbished▮Introduction
Stochastic Momentum Index (SMI) Indicator is a technical indicator used in technical analysis of stocks and other financial instruments.
It was developed by William Blau in 1993 and is considered to be a momentum indicator that can help identify trend reversal points.
Basically, it's a combination of the True Strength Index with a signal line to help identify turning points in the market.
SMI uses the stochastic formula to compare the current closing price of an asset with the maximum and minimum price range over a specific period.
He then compares this ratio to a short-term moving average to create an indicator that oscillates between -100 and +100.
When the SMI is above 0, it is considered positive, indicating that the current price is above the short-term moving average.
When it is below 0, it is considered negative, indicating that the current price is below the short-term moving average.
Traders use the SMI to identify potential trend reversal points.
When the indicator reaches an extreme level above +40 or below -40, a trend reversal is possible.
Furthermore, traders also watch for divergences between the SMI and the asset price to identify potential trading opportunities.
It is important to remember that the SMI is a technical indicator and as such should be used in conjunction with other technical analysis tools to get a complete picture of the market situation.
▮ Improvements
The following features were added:
1. 7 color themes, for TSI, Signal and Histogram.
2. Possibility to customize moving average type for TSI/Signal.
3. Dynamic Zones.
4. Crossing Alerts.
5. Alert points on specific ranges.
5. Coloring of bars according to TSI/Signal/Histogram.
▮ Themes
Examples:
▮ About Dynamic Zones
'Most indicators use a fixed zone for buy and sell signals.
Here's a concept based on zones that are responsive to the past levels of the indicator.'
The concept of Dynamic Zones was described by Leo Zamansky ( Ph .D.) and David Stendahl, in the magazine of Stocks & Commodities V15:7 (306-310).
Basically, a statistical calculation is made to define the extreme levels, delimiting a possible overbought/oversold region.
Given user-defined probabilities, the percentile is calculated using the method of Nearest Rank.
It is calculated by taking the difference between the data point and the number of data points below it, then dividing by the total number of data points in the set.
The result is expressed as a percentage.
This provides a measure of how a particular value compares to other values in a data set, identifying outliers or values that are significantly higher or lower than the rest of the data.
▮ What to look for
1. Divergences/weakening of a trend/reversal:
2. Supports, resistances, pullbacks:
3. Overbought/Oversold Points:
▮ Thanks and Credits
- TradingView and PineCoders: for SMI and Moving Averages
- allanster: for Dynamic Zones

Adaptive-Lookback Stochastic [Loxx]Adaptive-Lookback Stochastic is an adaptive stochastic indicator.
The Adaptive lookback is truly a market-driven period input used to determine the variable lookback period for many different indicators, instead of a traditional, fixed figure.
It is based on the frequency of market swings - the time between swing highs or swing lows. A swing high is defined as two consecutive higher highs followed by two consecutive lower highs; a swing low is defined by two consecutive lower lows followed by two consecutive higher lows. As swing points typically accompany reversals, they occur more frequently in choppier and volatile markets than in trends.
Adaptive lookback period is determined as :
Determine the initial number of swing points (swing count parameter) to use in the calculation.
Count the number of price bars it takes for the n swing points to form.
Divide step 2 by step 1 and round the result.
As an addition, adjust the "speed" of the produced period using the speed parameter - the smaller the speed parameter, the "slower" the average, and vice versa
Included
Bar coloring
Loxx Expanded Source Types
3 types of signals: levels crosses, slope, and middle crosses
Alerts
Sharktank - Stochastic ExtendedThe Stochastic as you know it, but with a lot more features.
Options you can tweak:
* Length of the %K value.
* The smoothing of the %K value.
* The smoothing (called %D) for the smoothed %K value.
* Ability to show the original %K.
* Ability to turn of %D so you can take a look at the original Stochastic as it was created (by turning of the %K).
* Show the price at which the smoothed %K will cross the %D (if possible).
* Show both normal and hidden divergence on %K, smoothed %K or %D.
* Some coloring settings.
Premier Stochastic Oscillator (PSO) [andre_007]This is a improved version of Premier Stochastic Oscillator (PSO), coded by "LazyBear".
"The indicator was first introduced by technical analyst Lee Leibfarth in the August 2008 issue of the journal Technical Analysis of Stocks & Commodities".
Inprovements:
The script was update to version 4 of PineScript.
Added support for diferents times frames.
For example, now it's possible to stay in intraday and at same time see a weekly version of this indicator.
Possibility to customize the thresholds.
Introduction to indicator:
"Stochastic oscillators have long been used to help traders and investors identify areas where trend changes are likely.
Leibfarth developed the PSO to take advantage of a standard stochastic oscillator's strengths while enhancing it to become more reactive to market activity.
The result is a faster indicator that provides earlier signals for potential trend changes".
More info:
www.investopedia.com

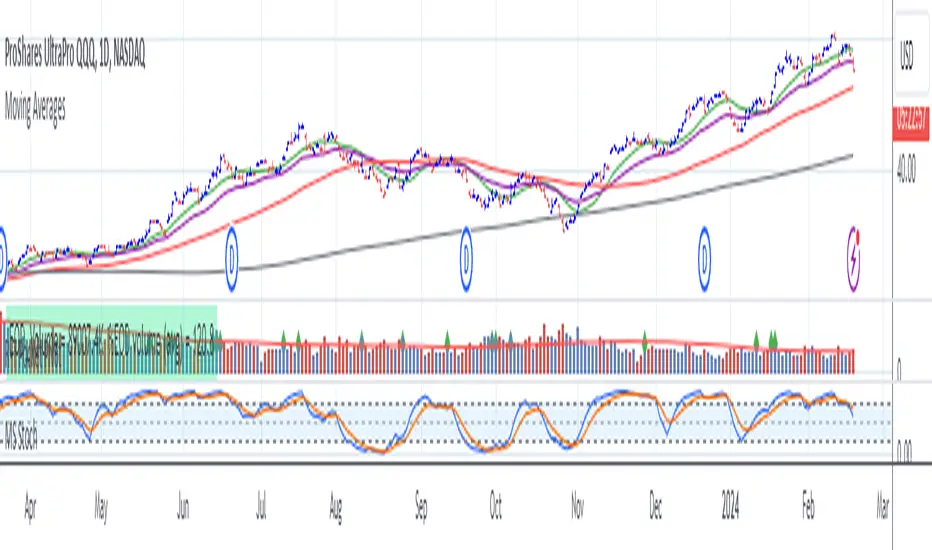
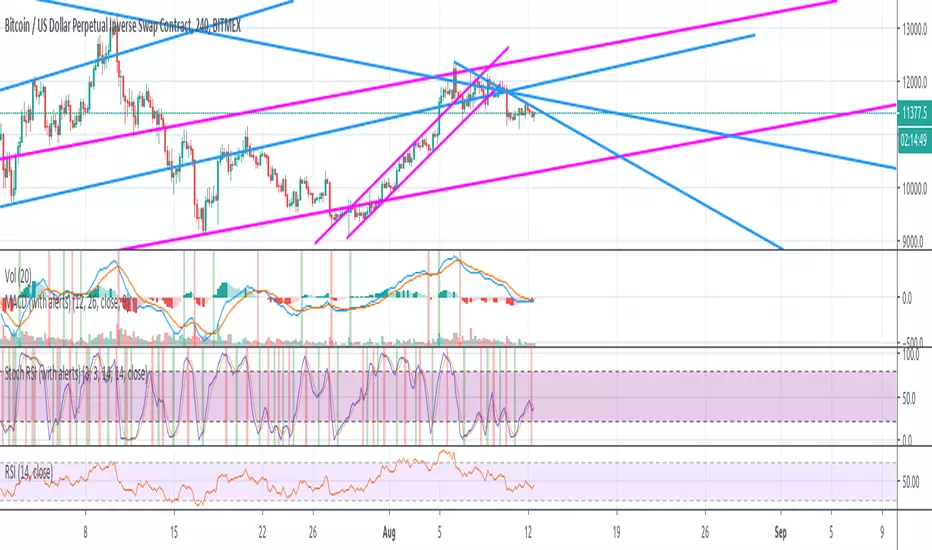
Stochastic 90 30 30This is a modified version of the KD indicator, in which %K is sma30 of 90-bar stochastic and %D is sma30 of %K. Instead of using %K as sma3 of 14- or 9-bar stochastic and %D as sma3 of %K, this modification reduces the sensitivity of the indicator, providing a better trading signal for a longer trading timeframe. The indicator also provides an entry signal when %K < 50 and %K crossovers %D.
The indicator provides the best signal when using together with the turbulence indicator.

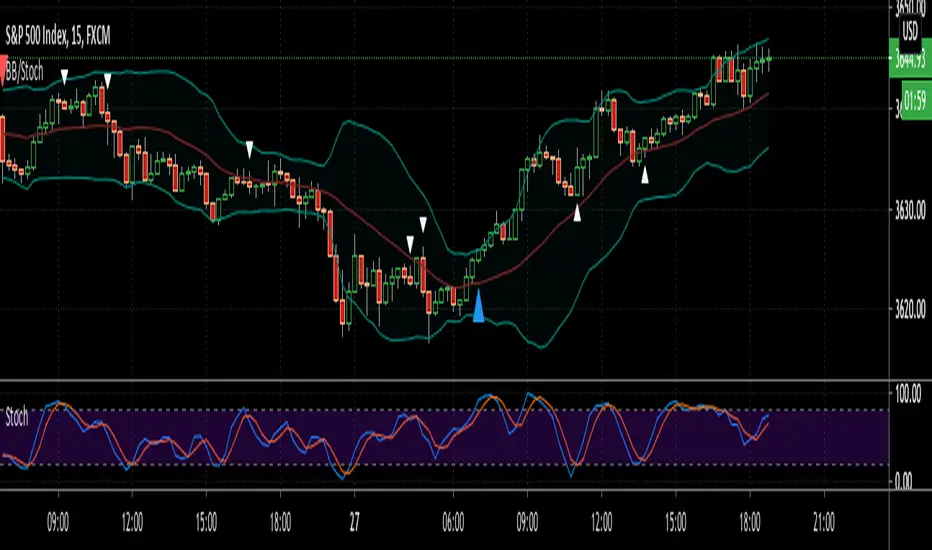
Simple Bollinger Band and stochastic oscillator strategy for SPXThis is a very simple Bollinger Band strategy with stochastic oscillator added. Main trend is determined by Band breakout while (5,3,3) stochastic crosses is used for additional entries. Alert function is configured as "one alert for any events", so that free users can set up and get alert for every events in the script. The following code segment can be manipulated as your needs, by removing or keeping "//" comment slashes etc. Entries should be above/below the signal bars and 7-8 points should be regarded as first target, trail the left. Good luck !
signal = bbupcross or bbdowncross //or add_long or add_short
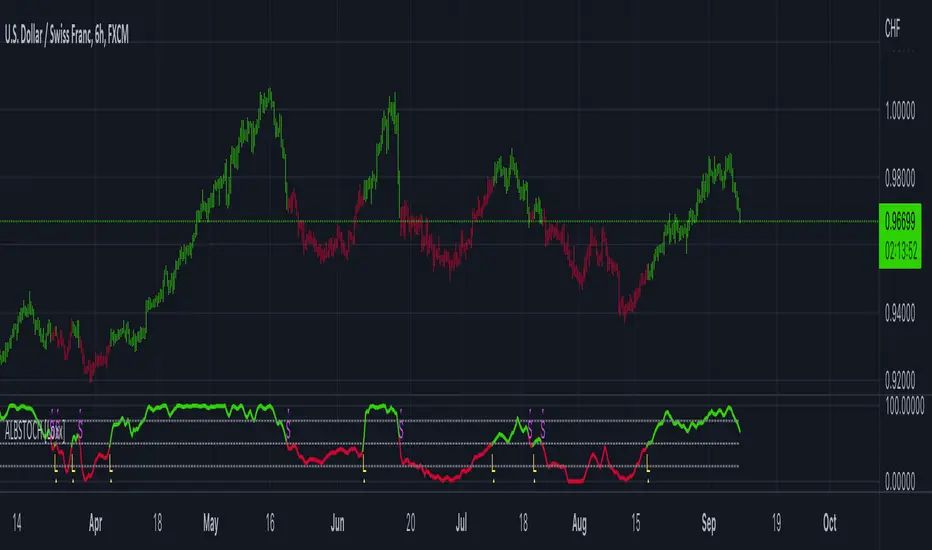
Doble stochastic oscillator fast and slowThis is a two stochastic in one indicator :
We have a normal stochastic, and a slower one in order to identify changes in the price movement.
At the same time I added more levels, so its easier visually to identify in each scenario we are.
The slower oscillator, also change color based on direction it has.
Green color = long direction - > buy
Red color = short direction - > sell

Stochastic / RSI (Wilder's [RMA] or Arnaud Legoux [ALMA])This script displays the Stochastic and Relative Strength Index ("RSI") indicators. Each indicator can be displayed standalone or shown together. The Stochastic indicator also has functionality to highlight overbought/oversold levels as well as relative placement of K and D. The RSI indicator can also be updated to utilize the Arnaud Legoux Moving Average ("ALMA") (vs. the standard Wilder's Moving Average).
I use based on default settings. ALMA RSI can help indicate extent of drop/rise from Stochastic overbought/oversold levels.
Recognition due to @kurtsmock for the work on validating the ALMA calculation (pinescript built-in function has slight deviation from original design) ---> LINK ().

Stochastic %BIt's a Stochastic indicator combined with Bollinger %B. This way you just need to check if it is above 1.0 or below 0.0 (Outside Bollinger Bands).

Stochastic RSI (with alerts)This is a modification of original Stochastic RSI oscillator, but with addition of highlighted death and golden crosses. It also allows you to receive alerts: "Stochastic RSI: Death cross on 4hours"
Hashem Extended Stochastic (V2)Extended Stochastic with All Zones. From Neutral to Danger Zones.
The Most Complete and Extended Stochastic Indicator.


