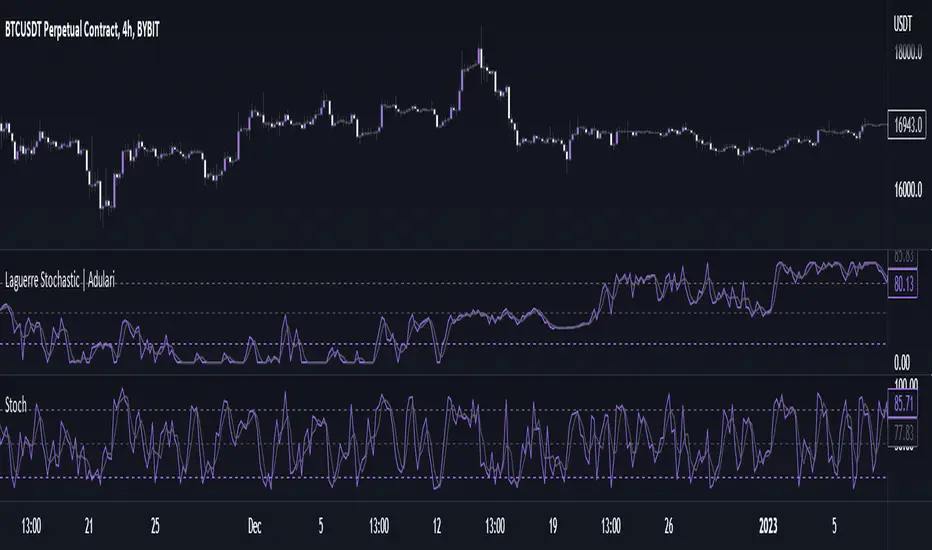
Laguerre Stochastic | AdulariDescription:
The Laguerre Stochastic is similar to a 4-period regular Stochastic, except that a Laguerre transform has been applied for price smoothing. The Laguerre transform is a mathematical technique that allows smooth indicators to be built using small amounts of data.
How do I use it?
Never use this indicator as standalone trading signal, it should be used as confluence.
When the value is above the middle line this shows the bullish trend is strong.
When the value is below the middle line this shows the bearish trend is strong.
When the value crosses above the upper line this indicates the trend may reverse downwards.
When the value crosses below the lower line this indicates the trend may reverse upwards.
When the value crosses above the signal this indicates the current bearish trend is getting weak and may reverse upwards.
When the value crosses below the signal this indicates the current bullish trend is getting weak and may reverse downwards.
Features:
Oscillator value indicating the difference between highs and lows fractioned by the close price.
%D value acting as a smoothed version of the %K.
Horizontal lines such as oversold, overbought and middle lines, indicating possible interest zones.
How does it work?
1 — Calculate regular Stochastic value.
2 — Apply the Laguerre transform.
3 — Calculate %D value by applying smoothing to the %K value.
חפש סקריפטים עבור "stoch"
Ribbon Relative Strength IndexDescription
Ribbon RSI is the base on of the original RSI.
In RSI (dark color) and RSI-base MA (light color), we added short (12-day) and long (26-day) periods to show these crossovers, including crossovers between the RSI and the RSI-base MA, We've also added a trend period (50-day) RSI section that shows this section in the background.
And because Stochastic is a momentum indicator as well. It is therefore included as a guide to support RSI in another way.
How to Setting
— You can adjust the Short (12 days), Long (26 days) and Trend (50 days) periods from Settings: Input page in the RSI Setting section.
— You can adjust the RSI-base MA interval (9 days) on the Settings: Input page in the MA Setting section.
— You can display the lines of RSI, RSI-base MA at Setting: Style in RSI…
— You can display the Stochastic lines on the Settings: Style page in the Stochastic…

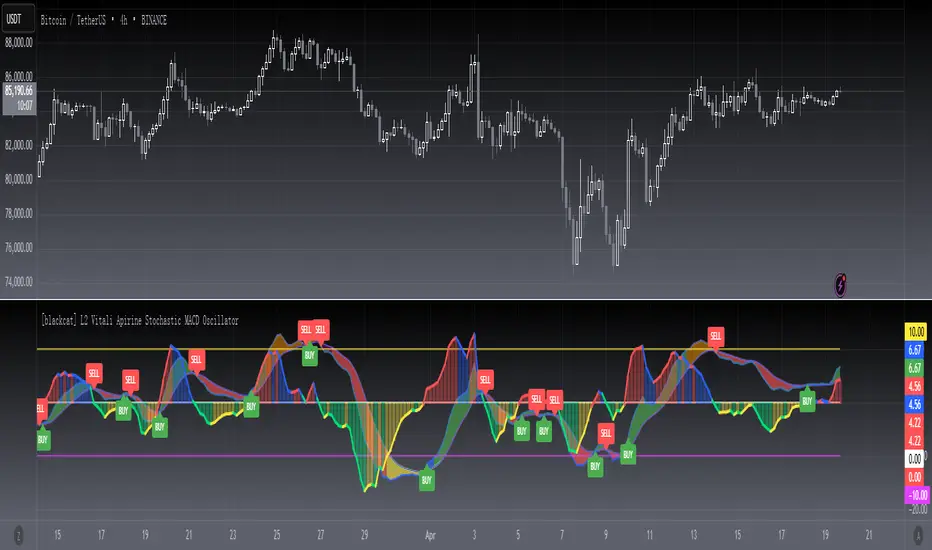
[blackcat] L2 Vitali Apirine Stochastic MACD OscillatorLevel 2
Background
Traders’ Tips of November 2019, the focus is Vitali Apirine’s article in the November issue, “The Stochastic MACD Oscillator”.
Function
In “The Stochastic MACD Oscillator” in this issue, author Vitali Apirine introduces a new indicator created by combining the stochastic oscillator and the MACD. He describes the new indicator as a momentum oscillator and explains that it allows the trader to define overbought and oversold levels similar to the classic stochastic but based on the MACD. The STMACD reflects the convergence and divergence of two moving averages relative to the high–low range over a set number of periods.
Remarks
This is a Level 2 free and open source indicator.
Feedbacks are appreciated.
KDJ stochastic indicatorThis is a special calculation of KDJ indicator. As you may know this is based on stochastic indicator. Stochastic indicator is a method to normalize a trending time serie (here price). the calculation of stochastic itself is a built in function in pine but it is straight forward:
In sudo code:
RSV for n days=(Cn-Ln)/(Hn-Ln)×100
In which, Cn is the closing price on the nth day; Ln is the lowest price in n days; Hn is the highest price in n days.
To calculate other indices K, D and J we use this formulas:
K = (2/3) * K + (1/3) * RSV
D = (2/3) * D + (1/3) * K
J = 3 * K - 2 * D
As you can see it is a recursive calculation. It means any value of the indices are affected by it's own previous value (and I'm passionate about recursive functions!) It may concern you that in the initial calculation there is no previous value and you are right. For the initial values we use value of 50 because it is an oscillator and the mean value is always 50 so we replace the first NAs with 50 using nz() function in pine.
After doing this calculations we reach to the smoothing section. I used simple moving averages, you may replace it with other more advanced smoothing techniqes like EMA or ALMA.
After I wrote this indicator I saw that it is a good indicator for reading divergences. As you can see I showed couple of these divergences to you on the chart. Notice that I analyzed divergence between price and J (very light green) line and not to K or D. I really appreciate any suggestion on this indicator and hope to improve it. The other ones present in the public library wasn't good and they differ a lot in the calculation and also the graphics doesn't look good.
Be free to change the parameter i saw these parameter are good to daily Bitcoin chart.

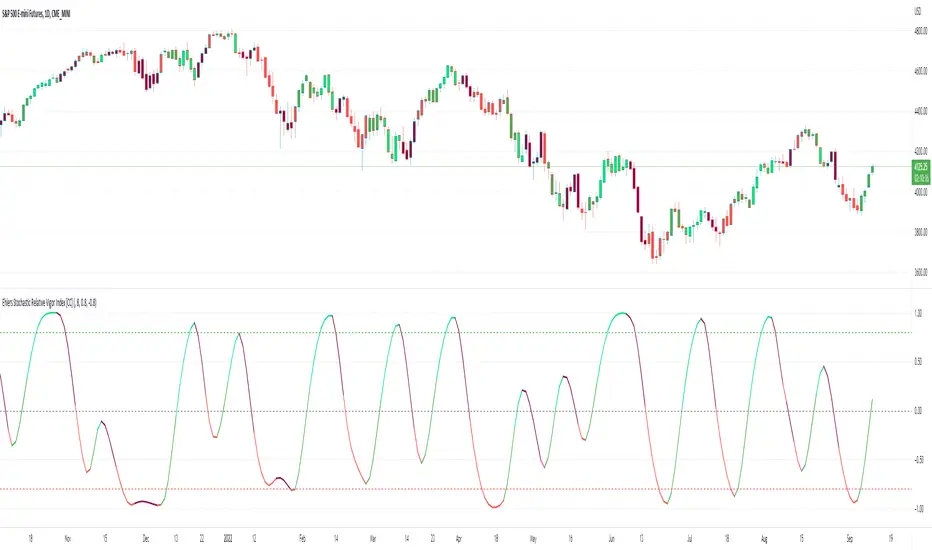
Ehlers Stochastic Relative Vigor Index [CC]The Stochastic Relative Vigor Index was created by John Ehlers (Cybernetic Analysis For Stocks And Futures pgs 84-89) and this of course is very similar to the Ehlers Fisher Stochastic Relative Vigor Index I just published. In hindsight I probably should have published this one first but just like with the other script this is a stochastic version of a Relative Vigor Index and I added some smoothing to make buy and sell signals clearer. There are several ways to identify buy and sell signals but generally in the long term it is a buy signal when the indicator is below the oversold line and is moving up and in the short term when the indicator is above it's trigger line which is what I coded the buy and sell signals to follow. Buy when the line is green and sell when it turns red.
Let me know if there are any other scripts you would like to see me publish!
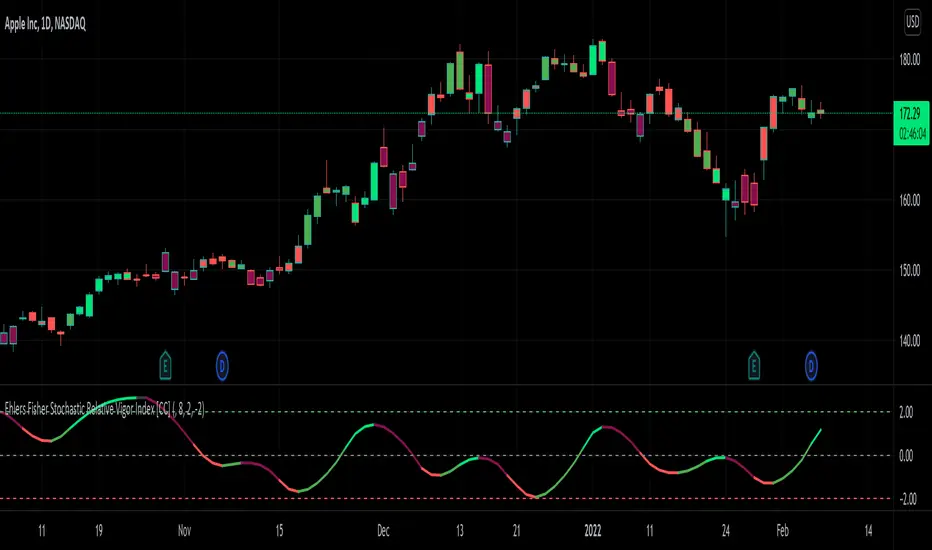
Ehlers Fisher Stochastic Relative Vigor Index [CC]The Fisher Stochastic Relative Vigor Index was created by John Ehlers (Cybernetic Analysis For Stocks And Futures pgs 101-104) and this is a many layered indicator created from his original Relative Vigor Index turned into a stochastic and then performing a Fisher transform on the results. I have included extra smoothing to provide clearer buy and sell signals as well as normal and strong buy and sell signals. As always strong signals are darker in color and normal signals are lighter in color. Buy when the line turns green and sell when it turns red.
Let me know if there are any other scripts you would like to see me publish!
Linear Stoch trendJust hybrid of Stoch RSI with linear regression trend indicator
to control linear regression -length set to 100 and deviation set to 0.5 (can be from 0 to any)
the stoch controlled by by the regukar way

CT Reverse Stochastic Momentum IndexIntroducing the Caretakers Reverse Stochastic Momentum Index .
According to Investopedia :
“The Stochastic Momentum Index (SMI) is a more refined version of the stochastic oscillator, employing a wider range of values and having a higher sensitivity to closing prices.”
The SMI was developed by William Blau and introduced in 1993 in an attempt to provide a more reliable indicator, less subject to false swings.
It calculates the distance of the current closing price as it relates to the median of the high/low range of price.
The SMI has a normal range of values between +100 and -100.
When the present closing price is higher than the median, or midpoint value of the high/low range, the resulting value is positive.
When the current closing price is lower than that of the midpoint of the high/low range, the SMI has a negative value.
I have reverse engineered the SMI formula to derive 2 functions.
One function calculates the chart price at which the SMI will reach a particular SMI scale value.
The second function calculates the chart price at which the SMI will crossover its signal line.
I have employed those functions here to give the price level where the SMI will equal :
Upper alert level ( default 40 )
Zero-Line
Lower alert level ( default -40 )
Signal line
The user can infer from these values that when closing prices cross the levels shown, the SMI will cross the indicated level or signal line.
If the price value is less than zero the value will show "impossible".
The advantage of knowing the exact prices that this will happen should give the user an additional edge and precision in risk management.
These crossover levels are displayed via an optional infobox with choice of user selected info.
There is an option to change the decimal places shown.
For easy and intuitive reading of the indicator when ….
SMI is above the signal line both the SMI and Signal line and the space between them is Green.
SMI is below the signal line both the SMI and Signal line and the space between them is Red.
SMI is above the Zeroline the space between them is Green.
SMI is below the Zeroline the space between them is Red.
Traditionally traders and analysts will consider:
Positives values above 40 indicate a bullish trend
Negative values below -40 indicate a bearish trend .
Common traditional ways to derive signals from the SMI :
When the SMI crosses above the zeroline, a buy signal is generated.
When the SMI crosses below the zeroline, a sell signal is generated.
When the SMI crosses below -40 and then moves back above it, a buy signal is generated.
When the SMI crosses above +40 and then moves back below it, a sell signal is generated.
When the SMI line crosses above the signal line. A signal to buy / take profit is generated
When the SMI line crosses below the signal line. A signal to sell / take profit is generated.
Traders also look for divergences between the SMI itself or the SMI histogram and price action.
The SMI is often used in conjunction with the Chande Momentum Oscillator or R squared indicator to determine overall market trendiness where the SMI is used to determine the direction of the trend, and also with volume indicators to show if the momentum carries significant selling or buying pressure.

(mab) Williams %R, RSI, Stochastic and Stochastic RSIThis indicator can display a Williams %R and a second oscillator at the same time. RSI , Stochastic or Stochastic RSI can be displayed as second oscillator. Williams %R is configured with 21 length by default and adds a 13 EMA on it (like used by TRI ). There is an option to display divergences on the oscillators.

[NLX-L2] Fisher Stochastic Center of Gravity (v4)- Fisher Stochastic Center of Gravity-
This is Fisher's Stochastic Center of Gravity converted to pine v4 by blackcat. A very powerful entry indicator!
The original was published by DasanC & EmpiricalFX and it's a very interesting take on FSCG.
All the credit for the indicator goes to the authors and inventor of FSCG, this is just a mod to be used with my NLX Modular Trading Framework .
- How to Use -
1. Add a Trend Indicator like Trend Index MTF to your chart
2. Add " Fisher Stochastic Center of Gravity" Indicator to your Chart and select the Trend Index MTF with Type L1 in the Settings as Source
2. Add the Backtest to your Chart and select the FSCG Signal with Type L2 as Source
- Alerts for Automated Trading -
See my signature below for more information. Contact me for the Alert module.

RSI, STOCHASTIC, KELTNER AND EMA CROSSES COMBINEDI have combined RSI and Stochastic but also added an keltner channel and then also two EMA's.
How the indicator works is the background turns green when the rsi and stochastic are below 20 and the keltner channel is below X and also your fast ema is below your slow ema and then vice versa for sell signals.
Feel free to leave a comment on what you think and what could be improved on it because i know their is some fine tuning to do and some improvement that can be made and I'm sure i'll be updating this myself.
All the variables are interchangable and the indicator has alert functionality.
[blackcat] L1 Stochastic J Price Action OscillatorLevel: 1
Background
The KDJ oscillator display consists of 3 lines (K, D and J - hence the name of the display) and 2 levels. K and D are the same lines you see when using the stochastic oscillator. The J line in turn represents the deviation of the D value from the K value. The convergence of these lines indicates new trading opportunities. Just like the Stochastic Oscillator, oversold and overbought levels correspond to the times when the trend is likely to reverse.
Function
L1 Stochastic J Price Action Oscillator with Long Strength Indicator use stochastic KDJ signal as input source and it combines with price action algorithm to form a brand-new oscillator which have less noise signal with a long signal strength indicator so as to alleviate inherent KDJ saturation issue.
Key Signal
cond --> buy signal condition from KDJ j value deduction
fastline --> fast line of new oscillator
slowline --> slow line of new oscillator
Pros and Cons
Pros:
1. it takes over KDJ's advantages
2. it can greatly reduce KDJ saturation issue
Cons:
1. no short entry signal is derived.
2. only long signal strength indicator is disclosed
Remarks
An improved version of KDJ with less satration observed.
Readme
In real life, I am a prolific inventor. I have successfully applied for more than 60 international and regional patents in the past 12 years. But in the past two years or so, I have tried to transfer my creativity to the development of trading strategies. Tradingview is the ideal platform for me. I am selecting and contributing some of the hundreds of scripts to publish in Tradingview community. Welcome everyone to interact with me to discuss these interesting pine scripts.
The scripts posted are categorized into 5 levels according to my efforts or manhours put into these works.
Level 1 : interesting script snippets or distinctive improvement from classic indicators or strategy. Level 1 scripts can usually appear in more complex indicators as a function module or element.
Level 2 : composite indicator/strategy. By selecting or combining several independent or dependent functions or sub indicators in proper way, the composite script exhibits a resonance phenomenon which can filter out noise or fake trading signal to enhance trading confidence level.
Level 3 : comprehensive indicator/strategy. They are simple trading systems based on my strategies. They are commonly containing several or all of entry signal, close signal, stop loss, take profit, re-entry, risk management, and position sizing techniques. Even some interesting fundamental and mass psychological aspects are incorporated.
Level 4 : script snippets or functions that do not disclose source code. Interesting element that can reveal market laws and work as raw material for indicators and strategies. If you find Level 1~2 scripts are helpful, Level 4 is a private version that took me far more efforts to develop.
Level 5 : indicator/strategy that do not disclose source code. private version of Level 3 script with my accumulated script processing skills or a large number of custom functions. I had a private function library built in past two years. Level 5 scripts use many of them to achieve private trading strategy.

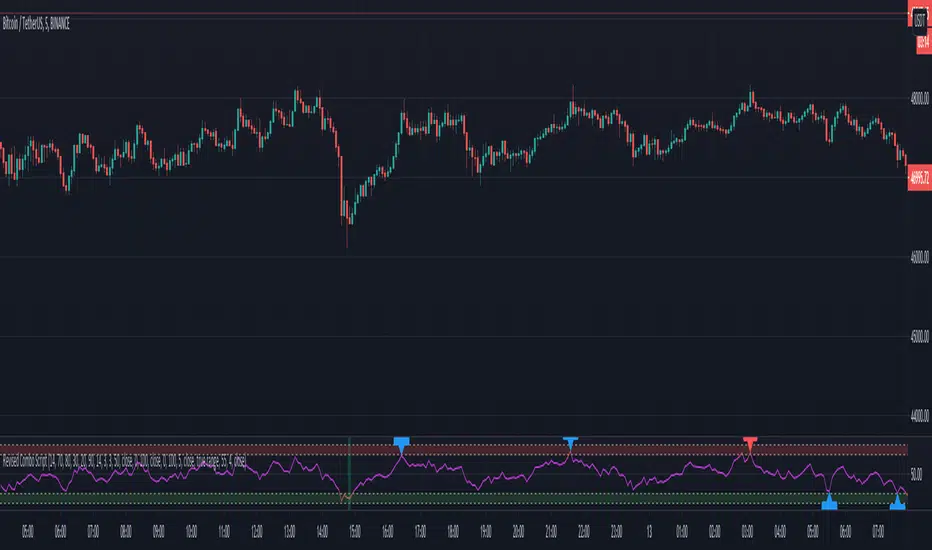
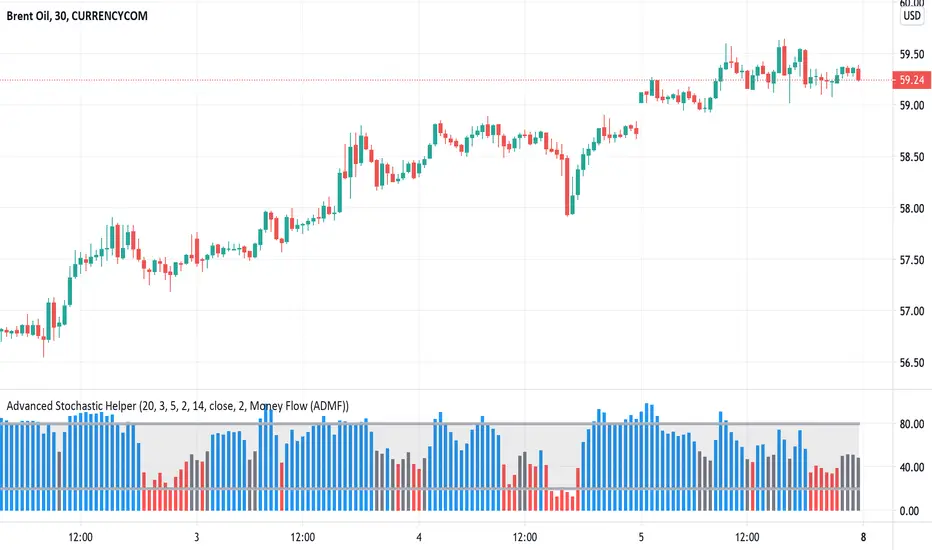
Advanced Stochastic HelperAdvanced Stochastic Helper is an Stochastic Oscillator combined with an multiple SMA source :
(Money Flow (ADMF), ASI and ADMF, Absolute Strength Index (ASI)). Blue (Bullish trend) and Red (Bearish trend) bar are the strength of the ob/os.Gray can announce a turnaround.
Also there is a MTF Trend Line based on time (1 week by default) at the bottom of the oscillator that can will help you to find historical trend too.
(line changing from blue for bullish trend and to red for bearish trend).
"Buy and Sell" alert for Stochastic available.
Great Stochastic RSIThis is the Great stochastic rsi that color the candles on green when the K% is above the the D% and red when the K% is below the D%.
Stochastic rsi is a momentum indicator and it should be used to indicate the direction of the market.
It can be used as confirmation of a buy signal when the market is showing higher high and higher lows and after a red colored candle there is a green candle.
As well it can be used as confirmation of a sell signal when the market is showing lower high and lower lows and after a green colored candle there is a red candle.
or it can be used as exit indicator when on uptrend after the green candles there is a red candle or on the downtrend after red candles there is a green candle.

Ehlers Fisher Stochastic Center Of Gravity [CC]The Fisher Stochastic Center Of Gravity Indicator was created by John Ehlers (Cybernetic Analysis For Stocks And Futures pg 95) and this is a combo cycle indicator mixed with a stochastic indicator. The idea is to capture the beginning of the cycle and ride it until the end. Buy when the indicator line is green and sell when it turns red.
This was a custom request so let me know if you would like to see me publish any other scripts or if you want something custom done!

Triple-StochasticShort-term Stochastic(green)
Mid-term Stochastic(Yellow)
Long-term Stochastic(fuchsia)
It moves greatly when all lines are aligned in the uppor zone or lower zone

PIP HUNTERSCR STOCH RSI SIGNALScript made in combination of Stoch and RSI, made by and for PIPHUNTERS on 03/10/2019
Stoch default values 10-3-3 higher band level 90, lower band level 10
RSI default value 14 color:blue

Featherlite RSI - Extra SensitiveFeatherlite RSI - Extra Sensitive
This is a combined relative strength index (RSI) ans stochastic RSI indicator set to the super sensitive period of 2 candles.
I use this setting particularly on higher timeframes such as M, W, D but can also be useful on 4h. However lower timeframes, will become to noisy.
If you compare to the standard setting of 14, you can see that the pump and dump structure is a lot more washed out
The RSI builds up slowly from its low point in 2015 to a single maximum in 2017. This is great for charting the longer cycle (interyear bull / bear), but is of little help for charting the intermediate swings. However, by increasing the sensitivity we can see when the RSI is maxing out on an intermonth basis. And indeed this matches the actual high points of the previous bull runs very well.
The indicator also includes a stochastic RSI indicator also set to the same candle period.
In practice it is always good to use a range of indicators to get a feel for what is going on. This is good for intermonth cycles on M and W timeframes. For longer cycles use the standard period setting of 14.

[Delphi] Power Tools OscillatorsFEATURES
- RSI
- Stochastic
//******************************************************************************
// Power Tools Oscillators
// Inner Version 1.0 04/12/2018
// Developer: iDelphi
//------------------------------------------------------------------------------
// 04/12/2018 Added RSI
// 04/12/2018 Added Stochastic
//******************************************************************************

Slow Stochastic + ADX exhaustationSlow stochastic with ADX exhaustation and sell/entry points as orange/green circles.
This is a script I remade from Marco Valente's "RSI Combo" and Oshri17 "Slow stochastic".
Credits and thanks to them for sharing, I just expanded the diversity ^^
Hope you enjoy phit! ;D
2xStochastic + RSI (two levels, colored)Great tool to find market tops, bottoms, S/R's and reversals.
Rsi has 2 customiseble overbought and oversold levels can show you extreme levels.
Slow Stochastic 1 (25 period) shows small price swings
Slow stochastic 2 (100 period) can show you a greater picture, are we reversing?
Why do you need Leguerre, Murrey, Kaufman oscilator 3000 when you can have old and trusted tool, that has been tweeked very nicely for any timeframe.
I use it in a variety of ways, let me show you some examples:
EXAMPLE 1 (RSI Extreme Level):
1) Find extreme oversold or overbought level that clearly reversed and plop S/R line there. BAM! We have a S/R line
2) Next time you know this line will mean something (Either it will hold, or it will be broken by a big candle) and you can trade it accordingly to Stochastic trading strategy
EXAMPLE 2 (Fibonacci Level finder):
Trading fibo? This can help!
1) Just like fibo trading, find good swing top and bottom
2) You know that price will reverse from 38.2, 50, 61.8, but where? I think this is self explanotory...

Fractal Resonance BarLazyBear's WaveTrend port has been praised for highlighting trend reversals with precision and punctuality (minimal lag). But strong "3rd Wave" trends can "embed" or saturate any oscillator flashing several premature crosses while stuck overbought/oversold. This happens when the trend stretches over a longer timescale than the oscillator's averaging window or filter time constant. Our solution: monitor many timescales. With Fractal Resonance Bar's rich color codings, strong wavefronts form across timescales and jump out like an approaching line of thunderclouds!
Fractal Resonance Bar color-codes the status of eight underlying stochastic oscillators, with each row averaging over twice the time of the row above.
Fractal Resonance Bar shifts its timescales along with your choice of main chart timescale:
1 minute chart: 1 minute through 128 minute (~2 hour) oscillators.
15 minute chart: 15 minute through 1920 minute (~32 hour) oscillators.
1 hour chart: 1 hour through 128 hour (~2 week) oscillators.
Daily chart: 1 day through 128 day (~4 month) oscillators.
The color map is configured as follows:
Hot Pink: Extreme Overbought (> 100%) rolled over to sell, but oscillators probably embedded with more upside (revert to Dark Green) possible after a pause.
Deep Red: Overbought (> 75%) crossover ripe for selling (validated when red spreads to timescales below).
Brown: Minor (< 75%) crossover sell from which could bounce back green or start a plunge toward gray/black.
Gray/Black: Mature (< -75%) sells turning full black in a plunge before the dawn.
Lime Green: Extreme Oversold (< -100%) and bouncing, though may yet bottom even lower.
Green: Oversold (< -75%) crossover ripe for buy. Green spreading to all timescales below will validate bottom is in.
Dark Green/Teal: Mature buy in overbought (> 75%) range, waiting for sell crossover to Hot Pink for a pause or correction.
White Stripes are Impulsive Trend Warning
Fractal Resonance Bar warns of oscillator embedding by showing white stripes when it detects strong, early surges in the timescale rows below.The white stripes usually accompany Hot Pink warning it's too early to go short, or Lime Green warning it's too early to go long.
Heeding these warnings will probably miss the exact top or bottom, but you're less likely to get overrun in a momentum move.
Usually the market gives us a second opportunity to short very close to the top or buy very close to the bottom after the warning white stripes have subsided.
NOTE: Recently rolled over Futures contracts may not have enough history for all oscillator calculations, in which case no bar colors will appear.
Tweakable Attributes
The default Channel Length, Stochastic Ratio Length and Lag Length work reasonably well on all timescales in our experience. Minor tweaks don't hurt but this may just overfit to a particular chart history.
We don't recommend changing the 75% Overbought and 100% Extreme Overbought default levels as these are ideal numbers relative to the underlying oscillator statistic calculations. But these settings can shift the color transition levels.
Embedded attribute controls the sensitivity/conservativeness of the white strip embedding detectors. Closer to 75 increases the warning sensitivity while closer to 100 decreases the aggressiveness of blocking white stripes.
Embed Separation also affects the white stripe sensitivity.
Row width increases each row's thickness to fill the available screen height you've afforded the bar.
