Eigenvector Centrality Drift (ECD) - Market State Network What is Eigenvector Centrality Drift (ECD)?
Eigenvector Centrality Drift (ECD) is a groundbreaking indicator that applies concepts from network science to financial markets. Instead of viewing price as a simple series, ECD models the market as a dynamic network of “micro-states”—distinct combinations of price, volatility, and volume. By tracking how the influence of these states changes over time, ECD helps you spot regime shifts and transitions in market character before they become obvious in price.
This is not another moving average or momentum oscillator. ECD is inspired by eigenvector centrality—a measure of influence in network theory—and adapts it to the world of price action, volatility, and volume. It’s about understanding which market states are “in control” and when that control is about to change.
Theoretical Foundation
Network Science: In complex systems, nodes (states) and edges (transitions) form a network. Eigenvector centrality measures how influential a node is, not just by its direct connections, but by the influence of the nodes it connects to.
Market Micro-States: Each bar is classified into a “state” based on price change, volatility, and volume. The market transitions between these states, forming a network of possible regimes.
Centrality Drift: By tracking the centrality (influence) of the current state, and how it changes (drifts) over time, ECD highlights when the market’s “center of gravity” is shifting—often a precursor to major moves or regime changes.
How ECD Works
State Classification: Each bar is assigned to one of N market micro-states, based on a weighted combination of normalized price change, volatility, and volume.
Transition Matrix: Over a rolling window, ECD tracks how often the market transitions from each state to every other state, forming a transition probability matrix.
Centrality Calculation: Using a simplified eigenvector approach, ECD calculates the “influence” score for each state, reflecting how central it is to the network of recent market behavior.
Centrality Drift: The indicator tracks the Z-score of the change in centrality for the current state. Rapid increases or decreases, or a shift in the dominant state, signal a potential regime shift.
Dominant State: ECD also highlights which state currently has the highest influence, providing insight into the prevailing market character.
Inputs:
🌐 Market State Configuration
Number of Market States (n_states, default 6): Number of distinct micro-states to track.
3–4: Simple (Up/Down/Sideways)
5–6: Balanced (recommended)
7–9: Complex, more nuanced
Price Change Weight (price_weight, default 0.4):
How much price movement defines a state. Higher = more directional.
Volatility Weight (vol_weight, default 0.3):
How much volatility defines a state. Higher = more regime focus.
Volume Weight (volume_weight, default 0.3):
How much volume defines a state. Higher = more participation focus.
🔗 Network Analysis
Transition Matrix Window (transition_window, default 50): Lookback for building the state transition matrix.
Shorter: Adapts quickly
Longer: More stable
Influence Decay Factor (influence_decay, default 0.85): How much influence propagates through the network.
Higher: Distant transitions matter more
Lower: Only immediate transitions matter
Drift Detection Sensitivity (drift_sensitivity, default 1.5): Z-score threshold for significant centrality drift.
Lower: More signals
Higher: Only major shifts
🎨 Visualization
Show Network Visualization (show_network, default true): Background color and effects based on network structure.
Show Centrality Score (show_centrality, default true): Plots the current state’s centrality measure.
Show Drift Indicator (show_drift, default true): Plots the centrality drift Z-score.
Show State Map (show_state_map, default true): Dashboard showing all state centralities and which is dominant.
Color Scheme (color_scheme, default "Quantum"):
“Quantum”: Cyan/Magenta
“Neural”: Green/Blue
“Plasma”: Yellow/Pink
“Matrix”: Green/Black
Color Schemes
Dynamic gradients reflect the current state’s centrality and drift, using your chosen color palette.
Background network effect: The more central the current state, the more intense the background.
Centrality and drift lines: Color-coded for clarity and regime shift detection.
Visual Logic
Centrality Score Line: Plots the influence of the current state, with glow for emphasis.
Drift Indicator: Histogram of centrality drift Z-score, green for positive, red for negative.
Threshold Lines: Dotted lines mark the drift sensitivity threshold for regime shift alerts.
State Map Dashboard: Top-right panel shows all state centralities, highlights the current and dominant state, and visualizes influence with bars.
Information Panel: Bottom-left panel summarizes current state, centrality, dominant state, drift Z-score, and regime shift status.
How to Use ECD
Centrality Score: High = current state is highly influential; low = state is peripheral.
Drift Z-Score:
Large positive/negative = rapid change in influence, regime shift likely.
Near zero = stable network, no major shift.
Dominant State: The state with the highest centrality is “in control” of the market’s transitions.
State Map: Use to see which states are rising or falling in influence.
Tips:
Use fewer states for simple markets, more for nuanced analysis.
Watch for drift Z-score crossing the threshold—these are your regime shift signals.
Combine with your own system for confirmation.
Alerts:
ECD Regime Shift: Significant centrality drift detected—potential regime change.
ECD State Change: Market state transition occurred.
ECD Dominance Shift: Dominant market state has changed.
Originality & Usefulness
ECD is not a mashup or rehash of standard indicators. It is a novel application of network science and eigenvector centrality to market microstructure, providing a new lens for understanding regime shifts and market transitions. The state network, centrality drift, and dashboard are unique to this script. ECD is designed for anticipation, not confirmation—helping you see the market’s “center of gravity” shift before price action makes it obvious.
Chart Info
Script Name: Eigenvector Centrality Drift (ECD) – Market State Network
Recommended Use: Any asset, any timeframe. Tune parameters to your style.
Disclaimer
This script is for research and educational purposes only. It does not provide financial advice or direct buy/sell signals. Always use proper risk management and combine with your own strategy. Past performance is not indicative of future results.
See the market as a network. Anticipate the shift in influence.
— Dskyz , for DAFE Trading Systems
חפש סקריפטים עבור "track"

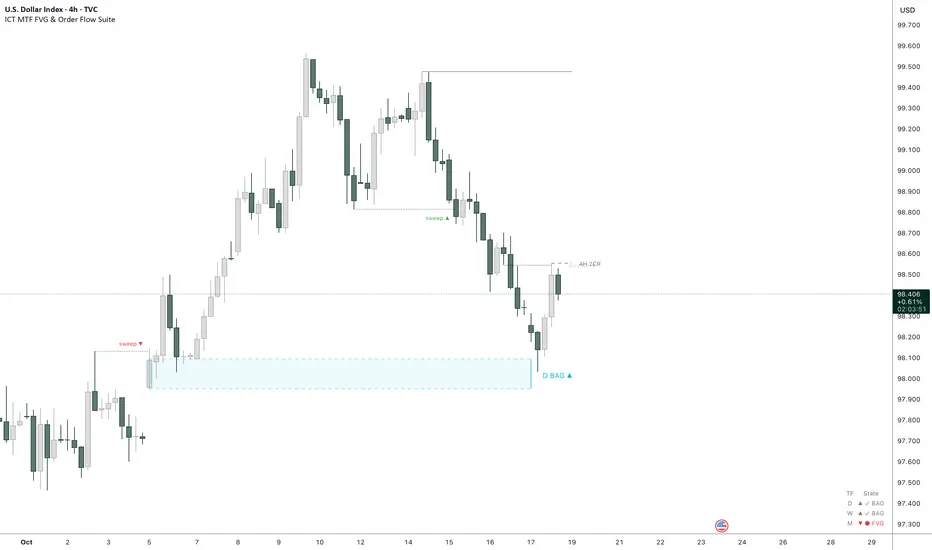
Magic Touch Line DetectorSummary of the Magic Touch Line Detector Script:
Purpose:
The Magic Touch Line Detector script is designed to identify significant price points in the market by analyzing candlestick wicks and bodies. It plots lines based on the detected wicks, classifying them as either ascending or descending. The script tracks how frequently price touches these lines and highlights the "most touched" lines for both ascending and descending categories. This script is particularly useful for traders looking to identify key price levels and trends over time.
How It Works:
Wick and Body Detection:
The script starts by analyzing the highs and lows of candlestick wicks relative to their bodies over a user-defined lookback period. A significant wick is identified based on a specified wick-to-body ratio and a deviation threshold measured against the Average True Range (ATR).
Line Creation:
Once a significant upper or lower wick is detected, the script calculates unconventional highs and lows (i.e., points that differ from the absolute highs and lows of the lookback period). Lines are then drawn from these unconventional price points using the slope between the detected wick and the current bar, ensuring a smooth extension.
Line Refinement and Touch Tracking:
As new bars are added, the script tracks how often the price touches the previously drawn lines. The number of touches each line receives is counted and updated in real-time, and the script ensures that only the most touched line is highlighted.
Highlighting and Labeling:
For each category (ascending and descending), the most touched line is identified and given special highlighting with thicker lines and different colors. Labels are also generated to show the number of touches that the most touched line has received. Old labels are cleared to avoid clutter.
Explanation of the Settings:
Lookback Period for Highs and Lows:
This sets the number of bars the script will use to detect the highest highs and lowest lows. A larger lookback period gives the script a broader context to work with, potentially identifying more significant price points.
Minimum Wick-to-Body Ratio:
This ratio determines what qualifies as a "significant" wick. It compares the length of the wick to the body of the candle. A higher ratio means that only wicks that are much longer than the candle body will be considered significant.
Price Deviation Threshold (in ATR multiples):
This setting controls how much price deviation from the ATR is required for a wick to be deemed significant. It acts as a filter to reduce noise by ignoring smaller wicks that are within normal price movements.
Line Touch Tolerance Factor (ATR multiple):
When checking if a price touches a line, the script uses this setting to define how close the price must be to the line to count as a "touch." This tolerance is a multiplier of the ATR, allowing for some flexibility in what is considered a touch.
Price Difference Threshold:
This defines the minimum price difference required to plot a line. If the price difference between the high and low of a detected wick is too small, the script can avoid plotting a line for insignificant moves.
Slope Adjustment Multiplier:
This multiplier adjusts the slope of the lines that are drawn from detected price points. It affects the length and angle of the lines, allowing users to control how far and at what angle the lines should extend across the chart.
Customization Options:
Show Ascending/Descending Lines:
These toggles allow users to decide whether ascending (bullish) or descending (bearish) lines should be shown on the chart.
Line Color, Style, and Width (for Ascending and Descending Lines):
These settings give users control over how the lines appear visually. You can customize the color, style (solid, dashed, dotted), and width of both ascending and descending lines.
Most Touched Line Color:
Users can define a different color for the "most touched" line, which is automatically identified by the script. This setting helps highlight the line that has been interacted with the most by the price.
How to Use the Script:
Setup the Lookback Period and Deviation Filters:
Start by setting the lookback period and the filters for wick-to-body ratio and deviation threshold. These settings help control the script's sensitivity to market movements.
Refine the Tolerance and Slope:
Adjust the line touch tolerance and slope adjustment multiplier to control how closely the script tracks price touches and how the lines are extended on the chart.
Customize Visuals:
Once the lines are being drawn, customize the colors, styles, and widths to ensure the lines are easy to read on your chart. You can also decide if you want to display both ascending and descending lines or focus on just one.
By setting up the script based on these inputs and parameters, you can get a real-time view of significant price levels and how often the price interacts with them, helping you make more informed trading decisions.

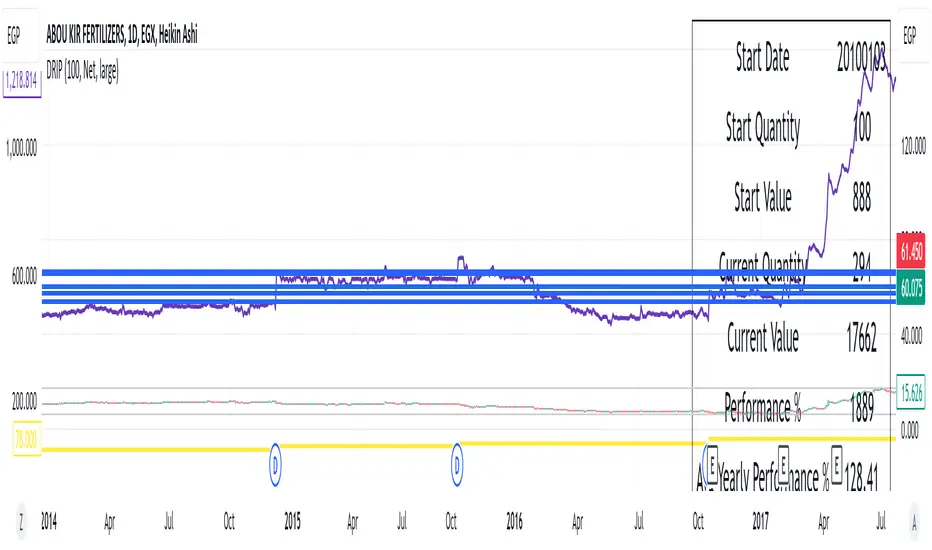
DRIP Yearly PerformanceOverview: The DRIP Yearly Performance indicator is designed for long-term investors using Dividend Reinvestment Plans (DRIP). This script calculates both the total and average yearly performance of an asset, factoring in the reinvestment of dividends over time. It provides key insights into portfolio growth by tracking the number of accumulated units from dividend reinvestment and how this impacts overall performance.
Key Features:
Dividend Reinvestment (DRIP) Calculation: Automatically adjusts the number of units held by reinvesting dividends, enhancing the calculation of total returns.
Custom Start Date: Choose a custom start date to begin tracking performance from a specific time period, allowing for more tailored performance analysis.
Performance Metrics: Displays key metrics such as the initial investment value, current value, total performance percentage, and the average yearly performance, all in an easy-to-read table format.
Visual Representation: Plots accumulated units and overall performance on the chart, with customizable colors for clarity.
Inputs Explained:
Start Quantity: Define the initial number of units (shares) held at the start of the investment.
Dividend Type: Choose between tracking Net or Gross dividends for reinvestment purposes. Net is always better unless you have a special case and you need to base your calculations on gross.
Start Date: Select a custom date to begin tracking performance. This allows users to focus on performance from any historical point.
Table Size: Customize the size of the text in the performance table to suit your visual preferences.
Performance Line Color: Choose the color of the performance plot line that tracks the value of your investment over time.
Accumulator Line Color: Customize the color of the line that tracks the accumulated units (shares) due to reinvested dividends.
Who Can Benefit: This indicator is ideal for long-term investors and dividend growth investors who want to measure their investment returns over time while factoring in the effects of dividend reinvestment.
Use Cases:
Tracking Dividend Impact: See how reinvesting dividends enhances your overall portfolio value.
Custom Performance Analysis: Set a custom start date to analyze performance from a specific point in time.
Visualizing Growth: Use the chart's plots to visually track your growing number of shares (units) and overall performance.
Range & Trend (Zeiierman)█ Overview
Range & Trend (Zeiierman) is a trend-first mapping of price that fuses an adaptive Range & Trend Line, a Trend Buffer (noise gate), a volatility-aware Trend Tracker, and optional Range Levels & Candles to reveal where trend is establishing, compressing, or handing off to a ranged regime.
Execution is guided by graded Buy/Sell labels (Regular / Plus / Strong), structural HH/HL & LL/LH markers with optional Peak Profit readouts, and a multi-TF Timeframe Scanner for alignment.
⚪ Why This One Is Unique
Unlike single-source trend lines, this version layers two orthogonal stabilizers:
a Range & Trend core that adapts its band size to volatility and dispersion, and
a dynamic smoothing buffer that dampens insignificant fluctuations, ensuring only meaningful trend movements affect signal output.
Signals are graded (Regular / Plus / Strong) based on contextual conditions, allowing traders to gauge the conviction behind each trend event. Range Candles add regime context by coloring bars only when a statistically consistent range structure forms, highlighting potential consolidation or transitional market phases. A lightweight Timeframe Scanner completes the workflow, broadcasting alignment from intraday to daily without adding chart clutter.
█ Main features
⚪ Range & Trend Line – Signal Generator
Adaptive directional mapping forms the foundation of the system. It highlights the active trend through color transitions and generates graded Buy/Sell labels (Regular / Plus / Strong) to reflect the strength of confirmation. The line responds dynamically to volatility, revealing when momentum is expanding, stabilizing, or reversing.
Unlike typical reactive signal tools, this model isolates only the most strong and meaningful trend transitions — those with the structural weight to establish or extend a new long-term directional phase. Each signal represents a filtered, high-conviction shift rather than a short-term fluctuation.
⚪ Trend Buffer (Noise Gate)
A precision filter that smooths the core trend output and suppresses false flips caused by short-term noise. It enhances visual consistency and provides the confirmation layer used to promote Regular signals to Plus strength when agreement occurs between buffer and core.
⚪ Trend Tracker
A trailing validation line that tracks directional health and trend persistence. It advances only in the direction of the active move, creating an adaptive stop-like reference. Tracker alignment helps identify trend exhaustion and contributes to Strong-grade signal confirmation.
⚪ Range Levels & Candles
Contextual zones that identify periods of compression or balance. When a valid range forms, candles are shaded within it, distinguishing ranging environments from trending conditions. These zones help anticipate breakouts and define natural support and resistance areas.
⚪ Live Structure (HH/HL & LL/LH with Peak Profit)
Displays real-time structural evolution — Higher Highs/Lows during uptrends and Lower Highs/Lows during downtrends. The optional Peak Profit label shows performance since the last regime change, offering an immediate view of current trend efficiency.
⚪ Timeframe Scanner
A compact multi-timeframe alignment panel that visualizes bullish or bearish trend states across user-selected intervals. It provides fast confirmation of directional consensus, helping traders act only when the broader structure supports their chosen bias.
█ How to Use
⚪ Range & Trend Line – Signal Generator
The Range & Trend Line is the core signal engine — its color shifts mark confirmed directional changes. This is where the system produces the graded Buy/Sell signals shown as ▲ / ▼ labels. Each grade reflects how many internal layers agree at the moment of signal creation:
Regular (▲ / ▼) – Triggered by a confirmed flip in the Range & Trend core. It appears when the base trend direction changes and is the earliest signal of potential reversal.
Plus (▲ + / ▼ +) – Requires the Trend Buffer to confirm the same direction. This upgrade indicates stronger trend agreement and higher reliability.
Strong (▲ ++ / ▼ ++) – These are high-conviction continuation signals and typically occur after structural confirmation.
How to trade them: Regular signals provide early awareness; Plus signals suggest confirmation; Strong signals mark trend maturity or high-probability continuations. Always trade in the direction of the prevailing trend. Use the Trend Buffer or Live Structure to confirm the dominant directional bias before acting on a signal.
⚪ Support and Resistance
The Range & Trend Line and the Buffer Line can act as dynamic support and resistance zones. Price often reacts around these levels, confirming whether the current move is continuing or losing strength.
Look for confirmation or rejection signals near these lines. Reactions around them often mark key decision points within the active trend.
⚪ Range Levels & Candles
Highlights when price enters structured consolidation zones. Candle coloring activates only inside validated ranges, helping to identify areas that show the typical characteristics of a ranging market. These zones visually separate balanced conditions from active trends and provide context for potential transitions.
Watch how price reacts around the upper and lower range levels. Look for false or confirmed breakouts, and expect price to move between these boundaries until a clear breakout develops. Range edges can also serve as practical entry or stop zones.
█ How It Works
⚪ Range & Trend Core
The main engine that defines the chart’s directional trend line. It adapts to changing market conditions, showing a smooth and reliable view of trend strength and direction.
Calculation: Builds a range-adaptive structure whose width adjusts with current volatility. The core moves toward new highs or lows but limits pullbacks to avoid false shifts. Several smoothing methods work together to create a steady, low-lag trend path.
⚪ Trend Buffer (Noise Gate)
A stabilizing layer that keeps the main trend line steady when price noise increases. It improves visual clarity and helps confirm true direction before a trend update appears.
Calculation: Uses a feedback-based update that reacts more when movement is strong and less when noise dominates. This lets the buffer ignore minor fluctuations while staying responsive to real trend changes.
⚪ Trend Tracker
A support line that follows the main move and helps confirm when a trend remains intact. It also serves as a guide for managing active positions.
Calculation: Applies a one-way trailing system that only moves in the direction of the trend. The offset adjusts with volatility, keeping a consistent distance that tightens or widens with market energy.
⚪ Buy/Sell Signal Engine (Regular / Plus / Strong)
The signal system that classifies entries by strength and confirmation level. It reacts to real-time trend changes while filtering weak reversals.
Calculation: Detects state flips in the Range & Trend Core, checks for agreement with the buffer, and rates each signal by historical pattern support. Higher-grade signals appear only when several layers confirm continuation strength.
⚪ Range Levels & Candles
Identifies short-term balance zones and highlights candles within those areas. These zones show where price pauses before the next directional move.
Calculation: Finds upper and lower range limits based on recent highs and lows, confirming only when several bars form a stable zone. Candle colors and level lines extend slightly forward to show likely reaction areas.
⚪ Swing Points & Peak Profit
Marks key turning points and measures performance since the last reversal. It helps track the strength and duration of each movement.
Calculation: Keeps a short memory of recent pivots and updates only when a new high or low replaces the last one. The percent distance from the last flip to the current bar defines the live Peak Profit reading.
⚪ Timeframe Scanner & Alert Aggregator
Combines directional data from multiple timeframes into a single view. Alerts trigger only when all selected timeframes agree.
Calculation: Gathers the trend state from each timeframe, converts it to a simple up or down value, and compares the results. When every layer matches your chosen direction, one clear, high-confidence alert is sent.
-----------------
Disclaimer
The content provided in my scripts, indicators, ideas, algorithms, and systems is for educational and informational purposes only. It does not constitute financial advice, investment recommendations, or a solicitation to buy or sell any financial instruments. I will not accept liability for any loss or damage, including without limitation any loss of profit, which may arise directly or indirectly from the use of or reliance on such information.
All investments involve risk, and the past performance of a security, industry, sector, market, financial product, trading strategy, backtest, or individual's trading does not guarantee future results or returns. Investors are fully responsible for any investment decisions they make. Such decisions should be based solely on an evaluation of their financial circumstances, investment objectives, risk tolerance, and liquidity needs.
סקריפט בתשלום

TradeChartist Plug and Trade™TradeChartist Plug and Trade is an extremely useful indicator that can be connected to almost any Study script (not a Strategy) on Trading View (with an Oscillatory or Non-Oscillatory Signal plot) to generate Trade Signals with Stop Loss plot, user set or automatic Target plots and create Alerts based on Past Performance, determined by Past Gains/Drawdowns for each Trade. The indicator is packed with a lot of features including TradeChartist's signature Dashboard and Real-time Gains Tracker, Automatic Targets Generator, Take Profit recommendation, option to paint price bars based on Trade/Price Trend, 3 types of Stop Loss plots to choose from, with option for user to set fixed Target to take profits.
1. How does ™TradeChartist Plug and Trade connect to another Study script/indicator signal?
Plug and Trade is elegantly designed with simplicity in mind, without compromising on functionality, so any trader - beginner to advanced, can just plug an external signal to the indicator with ease by just following these simple steps.
Add to price chart, the Indicator along with the signal plot to be tested and assessed for performance.
Plug the signal into ™TradeChartist Plug and Trade by choosing it from the Plug Signal Here drop-down.
Choose Signal type as Oscillatory if signal oscillates between set values or crosses a certain value periodically (Example: RSI, CCI, TRIX etc that are mostly not overlayed on Price chart and may be in a separate pane from price chart as it may not fit on Price scale), Choose Signal Type as Non Oscillatory if the signal can be plotted on price scale and Trades are normally generated when price crosses above or below it (Moving Averages, SAR indicators like SuperTrend, etc.).
For oscillators, default Oscillator value for Trade Signals is 0 as most Oscillators have 0 as their mid point. The value can be changed if the Signal doesn't oscillate with 0 as its mid point. For example, if the connected Signal is RSI, the values can be changed to Upper and Lower band values to generate Trade Signals.
Plot the Signal on chart if the signal is Non Oscillatory.
2. How can the plugged Signal's performance be assessed using ™TradeChartist Plug and Trade and subsequently used for generating Trade Entries and to create Alerts?
Once the Signal is plugged into the indicator based on steps above, Plug and Trade automatically plots the Trade entries based on the Signal type.
Plot Trade Entries after Bar Close from settings can be checked for signals that do not confirm until bar close. By doing this, repainting can be avoided for most signals and true performance can be assessed. Also, alerts can be created using Once Per Bar rather than Once Per Bar Close .
The real-time Gains Tracker and Dashboard are useful in tracking gains and other useful indicator values like RSI, Stoch, ATR and EMA in real-time with price movement.
Enabling Past Performance from settings will plot Maximum Gains achieved and Maximum Drawdown for each trade as labels . Trading View only plots finite number of labels and old labels are deleted automatically. But to access past performance beyond the last available label, bar replay can be used.
User can choose from 3 types of Stop Losses from the settings - Fixed %, Trailing % and ATR Stop Loss namely and a Fixed TP % to create plots on price chart and to create alerts.
If the user prefers automatic targets based on Trade entries, Recommend Targets can be enabled from the settings. The automatic targets are generated at the time of Trade Entry, along with Target prices and % which turn green when hit.
Each BUY and SELL Trade are tracked in its entirety and the highest high since BUY and lowest low since SELL are plotted on the price chart and also displayed on the Plug and Play Dashboard
Choppiness can be easily spotted if there are numerous Past Performance labels or several Trade Entries around a short timeframe on chart. This may mean that the signal needs smoothing or may not be suitable for the asset to trade on the chart timeframe. Suitability of a Study script for the asset can be determined in many ways using this indicator.
3. What other features are included in ™TradeChartist Plug and Trade?
Enabling Spot Price Bars to take Profit option from settings automatically plots $ sign above/below candles where Profit taking is recommended or Stop Loss moved to secure profits/reduce loss.
Enabling Paint Price Bars with Trade Trend paints price bars with colors that help picture Trade/Price trend. Trend spotting using this works best with (bars/hollow candles/candles with no border) on dark background.
Both features work on Price chart even without any Signal plugged in.
===================================================================================================================
Example Charts using different Signals plugged into ™TradeChartist Plug and Trade
1. RSI Signal (Oscillatory) plugged in with >60 for BUYs and <40 for SELLs - BTC-USDT on 1hr
2. PowerTracer Signal (Oscillatory) plugged in - GBP-USD 1hr
3. 55 period VWMA Signal (Non Oscillatory) plugged in - ADA-USDT 4hr
4. RSI Signal (Oscillatory) plugged in with >70 for BUYs and <30 for SELLs - SPX 1hr with Trailing SL - 3% and TP - 2%
===================================================================================================================
This is not a free to use indicator. Get in touch with me (PM me directly if you would like trial access to test the indicator)
Premium Scripts - Trial access and Information
Trial access offered on all Premium scripts.
PM me directly to request trial access to the scripts or for more information.
===================================================================================================================

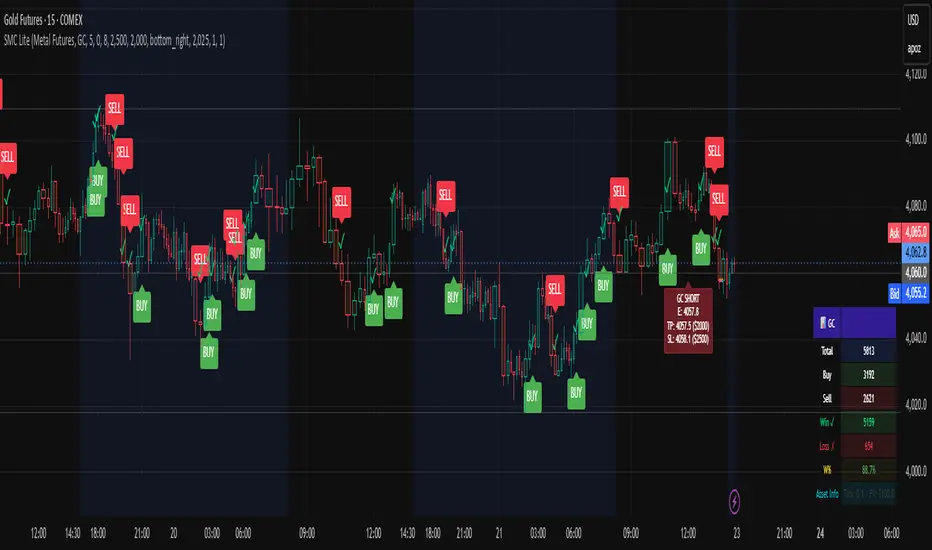
RAFA's SMC Killer LITEWhat is the SMC Killer?
The Smart Money Concepts (SMC) Killer is a trading indicator that identifies high-probability entry points using three proven strategies:
Break of Structure (BOS) - Trades when price breaks key support/resistance levels
Fair Value Gap (FVG) - Enters when price fills gaps in the market
Order Blocks (OB) - Entry from institutional order clusters (optional display)
This indicator automatically:
✅ Calculates correct entry, take-profit, and stop-loss levels for your asset
✅ Tracks win/loss statistics in real-time
✅ Works on 30+ different futures contracts
✅ Adapts tick size and point value automatically
Asset Selection
Supported Assets
The indicator supports all major futures contracts:
Equity Futures:
ES (E-mini S&P 500)
NQ (E-mini NASDAQ 100)
YM (Mini Dow Jones)
NKD (Nikkei 225)
EMD (E-mini Midcap 400)
RTY (Russell 2000)
Currency Futures:
6A (Australian Dollar)
6B (British Pound)
6C (Canadian Dollar)
6E (Euro FX)
6J (Japanese Yen)
6S (Swiss Franc)
6N (New Zealand Dollar)
Agricultural Futures:
HE (Lean Hogs)
LE (Live Cattle)
GF (Feeder Cattle)
ZC (Corn)
ZW (Wheat)
ZS (Soybeans)
ZM (Soybean Meal)
ZL (Soybean Oil)
Energy Futures:
CL (Crude Oil)
QM (Mini Crude Oil)
NG (Natural Gas)
QG (E-mini Natural Gas)
HO (Heating Oil)
RB (RBOB Gasoline)
Metal Futures:
GC (Gold)
SI (Silver)
HG (Copper)
PL (Platinum)
PA (Palladium)
QI (E-mini Silver)
QO (E-mini Gold)
Micro Futures:
MES (Micro E-mini S&P 500)
MYM (Micro E-mini Dow Jones)
MNQ (Micro E-mini NASDAQ)
M2K (Micro Russell 2000)
MGC (E-Micro Gold)
M6A (E-Micro AUD/USD)
M6E (E-Micro EUR/USD)
MCL (Micro Crude Oil)
How to Select Your Asset
Open the indicator settings (click ⚙️)
Go to ASSET SELECT section
Select Asset Category (e.g., "Metal Futures")
Enter Select Asset Symbol (e.g., "GC" for Gold)
Click OK
The indicator will automatically load the correct:
✅ Tick size
✅ Point value
✅ Risk/reward calculations
Settings Configuration
ASSET SELECT Group
Asset Category: Choose from 6 categories
Select Asset Symbol: Enter symbol (ES, GC, CL, etc.)
STRUCTURE Group
Show Swing Structure: Display swing highs/lows
Swing Length: Bars used for pivot detection (default: 5)
Build Sweep: Show sweep formations (default: ON)
What it does: Identifies the market trend and key turning points
Teal/Green bars = Uptrend
Orange/Red bars = Downtrend
FVG Group
Enable FVG Entry: Use Fair Value Gap strategy
FVG Threshold: Sensitivity filter (default: 0)
What it does: Detects gaps in price action that indicate imbalance
Lower threshold = More signals
Higher threshold = Fewer, high-quality signals
RISK Group
Show Bracket: Display entry/TP/SL lines
Units/Contracts: Number of contracts to trade (default: 6)
Stop Loss ($): Risk amount per trade (default: $250)
Target ($): Profit target per trade (default: $1,000)
Example: If you select ES with $250 stop loss:
The indicator calculates: 250 ÷ (6 contracts × $50 per point) = 0.83 points
Your stop loss line appears 0.83 points below entry
TABLE Group
Show Statistics: Display results table
Position: Table location (default: top_right)
Year: Start tracking from this year
Month: Start tracking from this month
Day: Start tracking from this day
Trading Signals
BUY Signal 🟢
When you see a green "BUY" label below a candle:
Price is breaking higher (Break of Structure)
OR price is filling a gap (Fair Value Gap)
The indicator plots three lines:
Green line = Entry price
Lime/bright green line = Take Profit level
Red line = Stop Loss level
Action: Consider entering a LONG position at market or entry price
SELL Signal 🔴
When you see a red "SELL" label above a candle:
Price is breaking lower (Break of Structure)
OR price is filling a gap (Fair Value Gap)
The indicator plots three lines:
Red line = Entry price
Magenta/pink line = Take Profit level
Orange line = Stop Loss level
Action: Consider entering a SHORT position at market or entry price
Signal Confirmation
✅ Wait for confirmation - Only trade signals on confirmed (closed) bars
✅ Check the trend - Look at candle colors (green uptrend, orange downtrend)
✅ Risk/reward ratio - TP should be at least 2x your SL risk
Risk Management
Position Sizing Example
Trading Gold (GC) with ES Settings:
Units: 6 contracts
Stop Loss: $250
Target: $1,000
Tick Size: 0.1 (automatic for GC)
Point Value: $100 per point (automatic for GC)
Risk per trade: $250
Reward per trade: $1,000
Risk/Reward Ratio: 1:4 (Excellent!)
Stop Loss Strategy
Always place your stop loss below/above the entry lines
The red/orange line shows exactly where to place SL
Never move your stop loss against the trade (unless scaling)
Use hard stops - set them immediately upon entry
Take Profit Strategy
Take profits at the lime/magenta line (TP level)
Consider taking partial profits at 50% of target
Let remaining 50% run to full target
Use trailing stops if price moves in your favor
Risk Per Trade
Formula: (Stop Loss $) ÷ (Units × Point Value)
Example for ES:
Stop Loss: $250
Units: 6
Point Value: $50
Risk per point: 250 ÷ (6 × 50) = 0.83 points
Reading the Chart
Visual Elements
Candle Colors:
🟩 Green/Teal = Uptrend (higher highs and higher lows)
🟥 Orange/Red = Downtrend (lower highs and lower lows)
Signal Labels:
BUY (Green) = Long entry opportunity
SELL (Red) = Short entry opportunity
Bracket Lines:
Entry Line (Solid) = Your entry price
TP Line (Bright color) = Take profit target
SL Line (Red/Orange) = Stop loss level
Success Markers:
✓ (Green checkmark) = Trade hit TP (WIN)
✗ (Red X) = Trade hit SL (LOSS)
Statistics Table
What Each Column Means
📊 ← Current asset being traded
├── Total: Total signals generated (buys + sells)
├── Buy: Number of buy signals
├── Sell: Number of sell signals
├── Win ✓: Trades that hit take profit
├── Loss ✗: Trades that hit stop loss
├── W%: Win rate percentage (wins ÷ total trades)
└── Asset Info: Tick size and point value
Example Reading
📊 ES
Total: 15
Buy: 8
Sell: 7
Win ✓: 10
Loss ✗: 5
W%: 66.7%
Asset Info: Tick: 0.25 | PV: $50
This means:
15 total signals since tracking started
10 wins, 5 losses
66.7% win rate (Professional level!)
Trading ES with 0.25 tick and $50 point value
Trading Examples
Example 1: Gold (GC) Long Trade
Setup:
Asset: Metal Futures → GC
Stop Loss: $150
Target: $600
Units: 2 contracts
What happens:
You see a BUY label on a green candle
Entry line at 2050.0
TP line at 2050.6 (0.6 points higher = $600 profit)
SL line at 2049.85 (0.15 points lower = $150 loss)
Risk/Reward: 1:4 ✅
Trade Result:
Price moves to 2050.6 → Label shows ✓ = WIN
Table updates: Wins increases by 1, Win% increases
Example 2: Crude Oil (CL) Short Trade
Setup:
Asset: Energy Futures → CL
Stop Loss: $500
Target: $2,000
Units: 1 contract
What happens:
You see a SELL label on a red candle
Entry line at 78.50
TP line at 77.50 (1.00 lower = $1,000 profit)
SL line at 79.00 (0.50 higher = $500 loss)
Risk/Reward: 1:2 ✅
Trade Result:
Price drops to 77.50 → Label shows ✓ = WIN
Table updates: Wins increases by 1, Win% increases
Example 3: E-mini S&P (ES) Day Trading
Setup:
Asset: Equity Futures → ES
Stop Loss: $250
Target: $1,000
Units: 6 contracts
Swap Length: 5 (default)
Enable FVG: ON
Morning Session:
See BUY at 5860.25 (swing break)
Hit TP at 5861.08 = WIN ✓
Table shows: Total 1, Buy 1, Win 1, W% 100%
See SELL at 5861.50 (FVG entry)
Hit SL at 5860.67 = LOSS ✗
Table shows: Total 2, Sell 1, Win 1, L% 50%
By end of day: 4 wins, 1 loss, 80% win rate
Troubleshooting
Issue 1: No signals appearing
Solution:
Check if both Show Bracket is ON
Check if Enable FVG Entry is ON
Try changing Swing Length (lower = more signals)
Ensure you're on a 1-hour or higher timeframe
Check chart has enough data (scroll left to see history)
Issue 2: Signals appear but no entry lines
Solution:
Confirm Show Bracket is toggled ON
Check Stop Loss ()andTarget() and Target (
)andTarget() are reasonable amounts
Ensure your Units value is not 0
Try refreshing the chart
Issue 3: Asset not recognized
Solution:
Check spelling of symbol (ES, not E-S)
Verify asset is in the supported list
Check you're in the correct category
Try closing and reopening the chart
Issue 4: Wrong stop loss/target levels
Solution:
Verify correct asset is selected
Check Units setting matches your position size
Verify Stop Loss ($) and Target ($) amounts
Look at Asset Info in table to confirm tick size
Manually calculate: SL $ ÷ (Units × Point Value) = Points
Issue 5: Statistics table not showing
Solution:
Toggle Show Statistics OFF then back ON
Try changing Table Position
Refresh the chart
Check that Show Table is enabled in settings
Issue 6: Indicator acting "heavy" or laggy
Solution:
Turn off Show Swing Structure if not needed
Turn off Show Bracket if reviewing historical trades
Reduce chart's data window (don't load entire years)
Refresh the chart
Pro Tips 🚀
Tip 1: Start with Micro Futures
Micro contracts (MES, MNQ, MCL) have lower cost
Perfect for learning the strategy
Same quality signals, smaller risk
Tip 2: Trade During Peak Hours
Equity Futures: 9:30-16:00 ET (Regular session)
Energy: 18:00-16:00 CT (After hours active)
Metals: 18:00-17:00 CT (Most liquid)
Currencies: 5:00 PM - 4:00 PM ET (24-5 market)
Tip 3: Combine Timeframes
Look for entry on 1-hour chart
Confirm on 15-minute chart
Execute on 5-minute breakout
More confluence = higher probability
Tip 4: Track Your Trades
Keep notes on WIN/LOSS trades
Identify patterns in your losses
Adjust settings based on performance
Use Win% table to monitor improvement
Tip 5: Risk Management First
Never risk more than 2% of account per trade
Respect your stop loss (don't move it)
Take profits when levels are hit
Be patient for high-probability setups
Tip 6: Adjust for Market Conditions
Trending markets: Increase Swing Length (6-8)
Choppy markets: Decrease Swing Length (2-4)
Low volatility: Reduce Stop Loss $
High volatility: Increase Target $
Quick Reference Card
────────────────────────────────────────────────────
SMC KILLER QUICK START ─────────────────────────────────────────────────────
│ 1. Select Asset Category & Symbol
│ 2. Set Units (contracts)
│ 3. Set Stop Loss ($) - your max risk
│ 4. Set Target ($) - your profit goal
│ 5. Wait for BUY (green) or SELL (red) signal
│ 6. Place entry at the entry line
│ 7. Place stop at the red/orange line
│ 8. Place take-profit at the lime/magenta line
│ 9. Close trade when line closes (✓ or ✗)
│ 10. Review statistics and adjust next trade
└─────────────────────────────────────────────────────
BUY Signal = Break Higher OR Fill Gap = LONG
SELL Signal = Break Lower OR Fill Gap = SHORT
Green candles = Uptrend
Orange candles = Downtrend
✓ = Win (took profit)
✗ = Loss (hit stop)
Support & Updates
Check settings are correct for your asset
Ensure adequate chart data is loaded
Test on demo account first
Start with smallest position size
Track performance over 20+ trades
Sessions & ORB Pro | Bifrost InstituteSessions & ORB Pro | BI
Professional Session Analysis and Opening Range Breakout Tracker
This advanced indicator provides comprehensive session tracking and Opening Range Breakout (ORB) analysis across multiple global trading sessions. Designed for intraday traders, this tool helps identify key support and resistance levels, session volatility patterns, and potential breakout opportunities.
Overview
Session-based trading is crucial for understanding market behavior, as different global sessions (US, European, Asian) exhibit distinct characteristics in terms of volatility, volume, and price action. This indicator allows traders to:
Identify Session Highs and Lows: Track the boundaries of each trading session to spot key support/resistance levels
Monitor Opening Range Breakouts: Capture the first 5, 15, or 30 minutes of major exchange openings to identify early directional bias
Analyze Multi-Session Patterns: View up to 4 concurrent or sequential sessions with full historical data
Customize Visual Analysis: Tailor colors, styles, and overlays for each session independently
Key Features
Multi-Session Support
Configure up to 4 independent trading sessions (US, Europe, Asia, Custom)
Fully customizable session times with timezone support (UTC offset, Chart timezone, or Exchange timezone)
Daylight Savings Time adjustment for accurate session timing
Session range boxes with adjustable transparency and outline styles
Historical session tracking (1-20 previous sessions)
Opening Range Breakout (ORB)
Track Opening Range for major exchanges: NYSE, LSE, TSE, TSX, ASX, HKEX, SSE
Configurable ORB periods: 5-minute, 15-minute, or 30-minute ranges
Visual ORB boxes with customizable colors and outline styles
ORB High/Low lines with optional extension beyond session close
Individual color control for each session's ORB
Session Analytics
Session High/Low: Horizontal lines marking the session's price extremes
Trendline: Linear regression trendline showing session directional bias
Mean: Session average price for mean reversion analysis
VWAP: Volume-weighted average price for institutional level analysis
Range Boxes: Visual representation of each session's price range
Advanced Customization
Individual Color Pickers: Set unique colors for each overlay type per session
Line Styles: Choose between Solid, Dashed, or Dotted for all line types
Label Options: Customize labels to show Date (d/M), Day of Week (ddd), and/or Price
Extend Options: Extend Session H/L and ORB lines beyond current bar
Outline Styles: Independent control of Range and ORB outline appearance
Information Dashboard
Optional real-time dashboard displaying:
Session Status: Open/Closed indicator for each session
Trend: R² correlation coefficient showing directional strength
Volume: Cumulative session volume
σ (Sigma): Session standard deviation for volatility analysis
Range: Session High, Low, and Range in points
ORB: Opening Range High, Low, and Range in points
Dashboard is fully customizable with toggleable columns and adjustable size/position.
Flexible Configuration
Time Zone Management: Three modes for precise session timing
Historical Display: Show/hide previous sessions for cleaner charts
Label Customization: Independent label size and content options for Session H/L vs ORB
Range Settings: Adjustable transparency, outlines, and label positioning
Use Cases
Session Traders: Identify when specific markets are most active and volatile
ORB Traders: Capture early session momentum and breakout opportunities
Support/Resistance: Use session highs/lows as key price levels
VWAP Strategies: Track institutional activity through session VWAP
Multi-Market Analysis: Monitor overlap between global trading sessions
Default Configuration
The indicator comes pre-configured with US (NYSE), Europe (LSE), and Asia (TSE) sessions, making it immediately useful for forex, indices, and global equity traders. Session D is available for custom session requirements.
Perfect for day traders, scalpers, and swing traders who rely on session-based analysis and institutional order flow.

Volume Scope Pro - Order Flow Volume Analysis V1.01Volume Scope Pro — Order Flow Volume Analysis
Overview
Volume Scope Pro is a multi-faceted volume analysis indicator that separates volume into buy (up) and sell (down) components to reveal hidden order flow dynamics. It aggregates lower timeframe volume data to estimate buying vs. selling pressure on each bar, calculates the volume delta (buy volume minus sell volume) per bar, and highlights where price action diverges or converges with volume flow. The indicator provides visual output in the form of an on-chart table and chart markers, helping traders identify potential distribution (selling into strength) and absorption (buying into weakness) events, as well as support/resistance zones derived from volume extremes.
Volume Settings
• Global Volume Period – An integer (default 100) defining the shared lookback window (in bars) for all volume-based calculations. This period is used for identifying volume extrema and computing cumulative volume statistics. A larger period considers more history for averages and sums, while a smaller period focuses on recent bars.
• Use Custom Lower Timeframe – A boolean (default true) that lets you override the automatic choice of lower timeframe for volume breakdown. If enabled, the indicator will use the specific lower timeframe you provide (see next setting) to fetch intrabar volume data. If disabled, the script chooses a lower timeframe based on the chart’s resolution (for example, 1-second for second charts, 1-minute for other intraday charts, 5-minute for daily charts, etc.).
• Lower Timeframe – A timeframe input (default 15S, i.e. 15-second intervals) specifying the lower interval to request for up/down volume calculation. This is the resolution at which the script breaks each chart bar’s volume into buying vs. selling volume. Fifteen seconds is the default as it provides a fine-grained intrabar look on most charts. This setting only takes effect if Use Custom Lower Timeframe is true; otherwise, it is ignored in favor of the automatic timeframe resolution.
Table Display Settings
• A dropdown option that adjusts the text size used in the on-chart data table (Tiny, Small, Normal, Large, Huge; default: Tiny). The default Tiny setting is selected because many traders use the indicator on mobile devices where screen space is limited. If you are using a larger display such as a laptop, desktop, or tablet, you may increase the font size to your preference for improved readability.
• Table Font Color – A color picker for the table text (default is a shade of blue, #0068e6). All text in the table will be rendered in this color. You can change it to improve contrast against your chart background or personal preference.
• Time Offset (hours) – An integer offset in hours (default 3) applied to the current time display in the table. This shifts the real-time clock readout from UTC by the specified number of hours in the table’s header. For example, setting 0 uses UTC, while a value of 3 (default) shows local time for UTC+3. Negative values are allowed for time zones behind UTC. This does not affect any calculations – it only adjusts the displayed clock for user convenience.
Trend Line & Pivot Settings
• Pivot Left and Pivot Right – Integers (default 5 each) controlling the sensitivity of pivot high/low detection. A pivot high is identified when the price high of a bar is greater than the highs of the Pivot Left bars to its left and Pivot Right bars to its right. Similarly, a pivot low is a bar whose low is lower than the lows of the surrounding bars on its left and right as defined by these values. Smaller values make the pivots more local and frequent, while larger values require more significant swings.
• Pivot Count – An integer (default 5) specifying the number of recent pivot points to track. The indicator will remember up to this many pivot highs and pivot lows each, and use them for drawing trend lines. When the count is exceeded, the oldest pivot points are dropped to focus on the most recent ones.
• Lookback Length – An integer (default 100) defining the number of bars over which trend lines are extended and within which pivot points are considered relevant. Essentially, this is the length of the window (in bars) in which the detected pivots and their connecting trend lines will be shown. Trend lines will start at the beginning of this lookback window and end at the latest bar, updating as new bars form.
• High Trend Line Color / Low Trend Line Color – Color inputs for the drawn trend lines connecting pivot highs and pivot lows, respectively (both default to orange #ff7b00). High trend lines typically slope downwards (connecting recent highs), and low trend lines slope upwards (connecting recent lows). You can change these colors to visually distinguish the two or to fit your chart theme.
• Trend Line Thickness – An integer (default 2) setting the stroke width of the pivot trend lines. Higher values make the lines thicker and more prominent.
• Trend Line Style – A string option (default dashed, options: solid, dashed, dotted) determining the line style for both high and low trend lines. For example, choosing “dotted” will draw the trend lines as a series of dots. This purely affects the appearance and has no impact on calculations.
Support/Resistance (S/R) Zone Settings
• SR Lookback Length – An integer (default 100) that defines how many completed bars are scanned for support/resistance zone detection based on volume extrema. The indicator examines this many bars behind the latest bar (the current bar is excluded to avoid repaint issues) to find extreme buying and selling volume points that form the zones. A larger value means a longer historical window for finding significant volume-based zones.
• Projection Bars – An integer (default 26, range 0–200) specifying how far into the future to extend the S/R zone lines. When set above 0, the horizontal lines marking the zones will project to the right of the latest bar by the given number of bars. This helps anticipate where the zones lie ahead of current price. A value of 0 confines the zone markings to past bars only.
• Resistance Zone Color / Support Zone Color – Color inputs for the drawn zones identified as resistance and support (defaults are red for resistance and teal for support). These colors apply to both the zone’s border lines and its background fill (with adjustable transparency, see below).
• Resistance Line Width / Support Line Width – Integers (default 2 each, range 1–5) setting the line thickness for the top and bottom boundaries of the resistance zone and support zone, respectively. For example, if Resistance Line Width is 3, the drawn lines at the top and bottom of the resistance zone will be thicker than the default.
• Resistance Fill Transparency / Support Fill Transparency – Integers in percentage (default 90 each, range 0–100) controlling the opacity of the colored shading that fills the zone area. 0% means fully opaque (solid color fill), and 100% means fully transparent (no fill color). The default of 90% is very transparent, just lightly coloring the zone area for subtlety. Adjust these to highlight the zones more prominently or to make them nearly invisible, depending on preference.
Overbought/Oversold (OB/OS) Voting Settings
• Enable OB/OS Voting – A boolean (default true) that turns on the overbought/oversold “voting” module. When enabled, the indicator evaluates standard technical indicators (RSI, Stochastic, CCI, etc.) to determine if the market is overbought (OB) or oversold (OS). Each indicator contributes an OB or OS “vote” based on its classic threshold (for example, RSI > 70 is an OB vote, RSI < 30 is OS). The module aggregates these votes to identify consensus extreme conditions.
• Enable Volume Confirmation Filter – A boolean (default true) that requires volume confirmation for OB/OS signals. If enabled, an overbought condition will only be confirmed if there is unusually high sell volume at the same time, and an oversold condition will only confirm with unusually high buy volume. In practice, this means even if indicators vote OB/OS, the script will only mark it as confirmed when volume is spiking in the opposite direction of price (signaling distribution for OB or absorption for OS). This filter helps ensure that OB/OS signals align with significant volume imbalance, indicating potential involvement of larger market participants.
• Enable Dynamic ATR Threshold – A boolean (default true) that adjusts the overbought/oversold trigger threshold dynamically based on volatility (ATR). When true, the voting threshold or confirmation conditions may be eased or tightened depending on recent volatility, as measured by the Average True Range. In higher volatility environments, this can prevent premature OB/OS signals by requiring more extreme indicator readings.
• Enable OB/OS Sync Window – A boolean (default true) that allows an OB or OS condition to remain valid for a short window of bars. If enabled, once an OB or OS state is triggered, it can persist for a user-defined number of bars (see Bars for Hit Sync Window) even if not all indicators remain in agreement every single bar. This helps to capture a cluster of OB/OS signals as one event rather than flickering on and off.
• Volume Average Period – An integer (default 3) specifying how many recent bars of volume to average when determining “unusually high” volume for confirmation. The script calculates the average buy volume and sell volume over this many bars; then the Volume Spike Ratio inputs (below) are applied to decide if current volume is significantly above average. For example, with a period of 3, the buy/sell volume of the last 3 bars are averaged to use as a baseline.
• Minimum Vote Count for OB/OS – An integer (default 3) setting the minimum number of indicators that must agree on overbought or oversold to consider it a valid signal. If fewer than this number signal OB (or OS) at the same time, the condition is ignored. A higher threshold makes the OB/OS signal rarer but more robust (requiring broader agreement among indicators).
• Bars for Hit Sync Window – An integer (default 1) controlling the size of the synchronization window (mentioned above) in bars. If an OB/OS condition is identified, it remains “active” for this many subsequent bars, allowing slightly delayed volume confirmation or indicator agreement to still count as part of the same event. For example, with a value of 2, if an OB signal occurs on one bar and the volume spike confirmation happens on the next bar, the module will treat it as a continuous event and still flag it.
• ATR Adjustment Factor – A float (default 14, step 1.0) used when Dynamic ATR Threshold is enabled. This factor influences how much ATR-based volatility adjustment is applied to the OB/OS vote threshold or confirmation criteria. A larger number might increase tolerance in volatile conditions. (Note: 14 here likely corresponds to an ATR period internally, not a direct multiplier of ATR value. It effectively adjusts sensitivity but does not need frequent change.)
• Overbought: Sell Volume Spike Ratio – A float (default 1.5) that sets the multiple of average sell volume required to confirm an Overbought condition. If the current sell volume is at least this factor times the recent average sell volume (over the Volume Average Period), and indicators are signaling OB, then an Overbought state is confirmed. For instance, the default 1.5 means sell volume must be 150% or more of its average to validate an OB signal. This ensures that an overbought label is only shown when there’s evidence of heavy selling (distribution) accompanying the price being overbought.
• Oversold: Buy Volume Spike Ratio – A float (default 2.0) setting the multiple of average buy volume required to confirm an Oversold condition. With the default 2.0, the current buy volume needs to be at least 200% of its recent average for an OS signal to confirm. This indicates strong buying interest (absorption) when price is in an oversold state. Typically, oversold conditions with significant buy volume could precede upward reversals.
• Source – A price source input (default close) for OB/OS calculations. This is the series value passed into the 20 indicator calculations (RSI, Stoch, etc.). By default it uses closing price, but advanced users can change it (for example, to an HLC3 or other composite) if desired. Generally, leaving it as close is standard.
Indicator Calculations and Logic
Volume Data Aggregation and Delta Calculation
At the core of Volume Scope Pro is the separation of total volume into up-volume (buying) and down-volume (selling) on each bar. This is achieved by requesting lower timeframe data using TradingView’s built-in requestUpAndDownVolume() function. Specifically, for each chart bar, the script gathers volume from a lower timeframe interval (e.g., 15-second bars) that fits within the higher timeframe bar. It sums the volume of all lower-TF sub-bars where price moved up (buy volume) vs. down (sell volume), providing an estimate of how much of the volume was transacted at the ask (buys) versus at the bid (sells). The resulting values are stored as upVolume and downVolume for the current bar, and the volume delta is computed as deltaVolume = upVolume – downVolume. By default, the script ensures upVolume and downVolume are treated as absolute magnitudes, while deltaVolume can be positive or negative indicating net buy or sell dominance.
If Use Custom Lower Timeframe is disabled, the indicator automatically chooses an appropriate lower timeframe based on the chart’s resolution. This adaptive logic uses 1-second intervals for charts in seconds, 1-minute for intraday minutes, 5-minute for daily charts, and 60-minute for anything higher, ensuring that up/down volume can be computed across various chart periods. If even finer resolution is needed or the user prefers a specific timeframe (e.g., 15S), enabling the custom option allows that override.
Coverage:
Because not all historical bars will have lower timeframe data available (especially if looking far back or on certain assets/timeframes), the script tracks how many bars actually received a valid up/down volume calculation. Each bar with non-na deltaVolume is counted toward a coverage total . This coverage count is displayed in the table (as “Coverage: X Bars”) to inform the user how many bars in the dataset had full volume breakdown data. It also serves a technical purpose: certain moving averages or calculations are “gated” to only output values when enough data points exist. For example, a 20-bar average of buy volume will not be shown until at least 20 bars with volume data are present; until then it returns NA to avoid misleading results. This gating mechanism is implemented via helper functions that check coverage before computing moving averages or sums. In practice, if you apply the indicator to a fresh chart or after changing the lower timeframe setting, you may see “NA” placeholders for some values until sufficient bars accumulate.
Volume Averages and Recent Change Indicators
For both buy and sell volume, the script computes short-term and medium-term averages to contextualize the current bar’s activity. Specifically, it calculates a 3-bar simple moving average and a 20-bar simple moving average of upVolume and downVolume (these lengths are fixed and chosen to represent a fast vs. slow window). These averages are shown in the table to compare against the current volume:
• The “Buy Current Amount” is the current bar’s buy volume, shown in an engineered format (e.g., 1.25K for 1,250) for readability. Directly below it (in the same cell via a newline) is “Avg : (3 | 20)”, which lists the 3-bar average buy volume and 20-bar average buy volume. Each average value is followed by an arrow marker:
an upward arrow 🔼 means the current buy volume is higher than that average, whereas a downward arrow 🔻 means the current buy volume is lower than that average. These markers give a quick visual cue – for instance, a 🔼 next to the (3) average indicates a volume spike in the very short term (current bar’s buy volume exceeds the recent 3-bar norm). If not enough data exists to compute an average, “NA” is displayed with the window in parentheses (e.g., “NA (20)” if fewer than 20 bars of coverage). The same format is used for Sell volume, where “Sell Current Amount” is the current bar’s sell volume with its own 3-bar and 20-bar averages and markers.
In addition to the short/medium term averages, the script also computes a “global” average buy volume and sell volume over the full Global Volume Period (using a slightly different approach). It first finds the proportion of buy vs sell over that window (summing all upVolume and downVolume over L = Global Volume Period bars) and then multiplies that ratio by the average total volume on the chart timeframe. This yields an implied average buy volume and sell volume for the global window (taking into account that the chart’s own volume may differ from summed LTF volume due to how the LTF data is sampled). These global averages are used internally (for example, in the OB/OS volume filter logic) but are not explicitly printed in the table. Instead, the table provides a more direct insight: the Positive Δ Sum and Negative Δ Sum (explained later) show accumulated buying vs selling pressure over the lookback period.
Price and Volume Trend Convergence/Divergence
Volume Scope Pro analyzes the short-term and medium-term trends of price and volume to identify convergence or divergence between price movement and buy/sell activity. This is done by calculating the angle of linear regression (slope in degrees) for price and for volume over the same two windows (3 bars and 20 bars). In essence, it fits a line through the last 3 closes and measures its angle, and similarly fits lines through the last 3 buy-volume values, last 3 sell-volume values, and repeats for 20 bars. The angles for price vs. volume are then compared:
• For the buy side, the indicator computes the price angle (θ) over 3 bars and 20 bars, and the buy-volume angle over 3 and 20 bars. These are displayed in the table under a “Buy Volume Trend” row. For example, it might show: “Price θ: 12.5° (3) | 5.0° (20)” on one line and “BuyVol θ: 8.0° (3) | 2.0° (20)” on the next. Each angle is given in degrees (θ symbol) with one decimal precision. A positive angle means an uptrend (price or volume increasing), and a negative angle means a downtrend over that window.
• After listing the angles, a convergence/divergence label is shown for each window: either Convergent or Divergent for the 3-bar window and similarly for the 20-bar window. This indicates whether price and buy volume are moving in the same direction (convergent) or opposite directions (divergent). For instance, if price’s 3-bar trend is up (positive slope) but buy-volume’s 3-bar trend is down (negative slope), that would be Divergent (3), signaling a short-term anomaly (price rising on falling buy volume). Conversely, if both price and buy volume are rising together over 20 bars, that shows Convergent (20), indicating buy volume is supporting the uptrend. These convergence/divergence labels help identify potential early warning signs: divergence may precede a reversal or indicate that an observed price move lacks volume support.
The same analysis is done for the sell side. The table’s “Sell Volume Trend” row lists “Price θ: ... | ...” and “SellVol θ: ... | ...” for 3 and 20 bars , followed by labels showing whether price vs. sell volume trends are convergent or divergent over those periods. For example, if price is trending down (negative angle) while sell volume is also trending down, they are Convergent (both indicating selling pressure in line with price drop). If price is falling but sell volume trend is up, that’s Divergent – price decrease accompanied by increasing sell volume could indicate aggressive selling (potential capitulation or acceleration of downtrend). On the other hand, price falling with decreasing sell volume might suggest selling is drying up (potential for a bottom). These nuances can be gleaned from the convergence/divergence outputs.
All angle calculations use a normalized linear regression slope converted to degrees for easy interpretation. The use of a short (3) and longer (20) window provides a quick glance at immediate vs. recent trend alignment. In the table, the angles and convergence labels are organized in two lines for buy and two lines for sell to clearly separate the information.
Volume Delta and Cumulative Delta Sums
The Volume Delta (Δ) for the current bar is a key metric showing the net difference between buy and sell volume. In the table, it appears as a single-line entry like “Delta: 5.2K” (for example) in the volume delta row. The value is formatted with K/M/B suffix if large, and it is colored green if positive (indicating net buying pressure) or red if negative (net selling pressure), with a neutral color if essentially zero. This coloring provides instant visual feedback: a green Delta means buyers dominated that bar, whereas a red Delta means sellers dominated. The delta number itself helps gauge the magnitude of that dominance. For instance, “Delta: 1.5M” in green would signify a very large imbalance of buying volume on that bar. This row gives a per-bar order flow insight complementing the price action of the candle.
To assess the broader context, the indicator also computes cumulative delta sums over the Global Volume Period. It separately accumulates all positive delta values and all negative delta values within the lookback window (e.g., 100 bars). The results are shown in the table as two lines: Positive Δ Sum and Negative Δ Sum, each followed by a number. These represent the total volume imbalance accumulated in each direction over the window. For example, a Positive Δ Sum of 20K means that, summing all bars in the window where buy > sell volume, buyers were ahead by a total of 20,000 volume (volume units) in that period. Similarly, a Negative Δ Sum of 15K would mean sellers were ahead by 15,000 volume in other bars. These sums give a sense of who is in control over the recent horizon: if Positive Δ Sum greatly exceeds Negative Δ Sum, the market has seen net accumulation (buying) in the lookback; if the reverse, net distribution (selling). The values are shown in a neutral text color (since they are not inherently “good” or “bad”) and are formatted with K/M suffixes as needed. They can help confirm trends or identify subtle shifts – for instance, if price is flat but Positive Δ Sum is growing rapidly, it might indicate stealth accumulation even without price movement.
Support/Resistance Zone Detection from Volume Extremes
Volume Scope Pro identifies key support and resistance areas by analyzing how volume behaved in recent price movements. Zones are derived from points where buying or selling activity became unusually strong or unusually weak—areas that often act as reaction levels in future price action.
A high-activity region is highlighted as a Resistance Zone, showing where strong participation previously slowed upward movement.
A low-activity region forms a Support Zone, indicating price levels where the market tended to stabilize or absorb pressure.
These zones are displayed as horizontal regions projected forward on the chart, with customizable colors and styling. Their upper and lower boundaries are shown in the on-chart table, where the indicator also notes whether each zone currently acts as support or resistance based on price position.
🟥 Resistance Zone based on
Buy/Sell Amount: 1.2345 ~ 1.2500
This indicates a resistance zone between roughly 1.2345 and 1.2500 (the bottom and top of that zone). “Buy/Sell Amount” here refers to the fact that this zone was computed from extreme buy/sell volume events, and the values are the zone’s price range. Likewise, a support zone line would be prefixed with 🟩 and show its range. These zones give a unique volume-based perspective on support and resistance, complementing traditional price-based levels.
Pivot-Based Trend Lines
The indicator draws adaptive trendlines by tracking recent swing highs and swing lows. Whenever the market forms meaningful pivots, the tool connects these points to outline the active upward and downward trend structure. A line drawn through recent highs generally acts as a dynamic resistance guide, while a line drawn through lows often behaves as a rising support boundary.
As market structure evolves, the trendlines update automatically, keeping the analysis aligned with the most recent swings. The color, thickness, and style of these lines are fully customizable. At any moment, you may see one line tracking the upper structure and one line tracking the lower structure, helping identify potential breakout areas or trend-channel behavior without manual drawing.
Overbought/Oversold Voting and Volume Signals
Volume Scope Pro includes an Overbought/Oversold engine that evaluates market exhaustion by combining technical momentum signals with real volume behavior. Instead of relying on a single indicator, the system draws from a broad set of classical oscillators, creating a multi-layer confirmation approach.
The tool aggregates signals from a group of well-known indicators and identifies when several of them simultaneously reach extreme levels. When enough of these indicators align, the condition is considered overbought or oversold. To refine these readings, an optional volume filter checks whether buying or selling pressure is unusually strong at the same time.
• Overbought (OB) is highlighted only when technical exhaustion coincides with elevated sell volume.
• Oversold (OS) appears when oversold readings align with strong buy volume.
When confirmed, the indicator places clear visual markers on the chart:
• OB – potential topping conditions supported by heavy selling.
• OS – potential bottoming conditions supported by strong buying.
• Distribution (↑P ↑S) – price rising while selling pressure increases.
• Absorption (↓P ↑B) – price falling while buyers absorb the move.
• Combined signals (OB+DIST or OS+ABS) highlight the strongest forms of exhaustion.
These markings help traders quickly recognize areas where momentum is fading and volume behavior becomes important. While they do not predict exact turning points, they often appear during phases where the market prepares for a shift, consolidation, or slowing trend.
Usage Notes and Interpretation
Volume Scope Pro provides a detailed view into the internal dynamics of market volume, which can greatly aid analysis when used appropriately. Here are some important considerations and best practices:
• Data Availability (Coverage): The accuracy and utility of this indicator depend on the availability of lower timeframe data for the instrument. On very high timeframe charts (weekly/monthly) or illiquid symbols, the automatic lower timeframe (like 1 minute or 5 minutes) might not retrieve full historical intrabar data, resulting in limited coverage. This is indicated in the “Coverage: X Bars” readout. If coverage is low, many of the volume-based values (especially 20-bar averages or global sums) may show “NA” or be unrepresentative until more data accumulates. It’s often best to use this indicator on active symbols and reasonable timeframes (e.g., 1h, 4h, 1D with a few months of data or lower) to ensure plenty of sub-bar data is available. If needed, you can reduce the Global Volume Period to focus on a smaller window that has full coverage, or experiment with a different Lower Timeframe that might have more data available (for example, using 1min instead of 15s on very long histories).
• Interpreting Volume Delta and Trends: A key value to watch is the Delta (Δ) and how it changes. For instance, if price is making new highs but Δ is decreasing or negative, it indicates bearish divergence – fewer buyers are supporting the move, or sellers might be increasingly active (distribution). Conversely, price making new lows while Δ becomes less negative or turns positive is a bullish divergence, implying sellers are exhausting and buyers are stepping in (absorption). The convergence/divergence rows quantitatively highlight these situations. Use them as alerts to investigate further rather than automatic trade signals. For example, a divergent 20-bar trend (price up, buy volume down) doesn’t mean price will immediately reverse, but it does warrant caution as the rally may be on weak footing.
• Support/Resistance Zones: The volume-derived S/R zones offer levels that might not be obvious from price alone. They often pinpoint areas where the tug-of-war between buyers and sellers was most extreme (resistance zone) or where the market had a lull in volume (support zone). Treat these zones as you would conventional support/resistance: price may react when revisiting them. A common use is to watch how price behaves upon approaching a highlighted zone – for instance, if price rallies into a red resistance zone and you see volume delta start to flip negative, it could strengthen the case that the zone is indeed acting as resistance due to renewed selling. The zones update once a new volume extreme enters or exits the lookback window, so they are relatively static during most recent price action, shifting only when a significantly larger volume spike happens or the oldest bar in the window moves out. They are also non-repainting for completed bars (the algorithm excludes the current bar for zone calculation to avoid repaint issues). Keep in mind these zones are horizontal areas; they do not guarantee a reversal, but they mark where supply or demand was notably strong in the past, which is useful context.
• Trend Lines and Pivots: The automatic trend lines drawn from pivot highs and lows can help visualize short-term price channels or triangles. They update in real-time as new pivots form. Use them as guidance for potential breakout or breakdown levels – e.g., if price breaks above a descending high line, that could indicate a bullish breakout from the recent down trend. The pivot detection sensitivity (Pivot Left/Right) can be tuned: higher values will only draw lines across more significant swings, whereas lower values will catch minor swings too. Adjust according to the volatility of the asset (more volatile assets might need larger pivot settings to filter noise). The trend lines are an auxiliary feature in this volume tool, meant to save time drawing those lines manually for recent swings. They work best when recent pivots are clear; in choppy conditions with many equal highs/lows, you might see the lines adjust frequently.
• OB/OS Voting Signals: The overbought/oversold markers (OB, OS, distribution, absorption) are perhaps the most actionable signals from this script, but they should not be used in isolation. They effectively combine momentum and volume analysis. A prudent approach is to confirm these signals with price action or other analysis:
• An “OB” (Overbought) marker suggests a probable short opportunity or at least to be cautious with longs. When you see OB, check if it aligns with other factors: Is price at a known resistance or a volume zone? Is there a bearish candlestick pattern? Multiple OB signals in a cluster (with or without “DIST”) could indicate a topping process – you might wait for price to start rolling over before acting.
• An “OS” (Oversold) marker points to a potential long opportunity or caution with shorts. Look for confluence such as the price being at a support zone, a bullish divergence in delta, or a reversal candle. Sometimes one OS by itself might just lead to a small bounce in an ongoing downtrend, but a series of OS/ABS signals could mark a accumulation phase.
• Distribution (↑P↑S) and Absorption (↓P↑B) markers can appear even without full OB/OS votes. These warn of stealthy behavior: e.g., Distribution triangles showing up during a steady uptrend might precede larger profit-taking drops. Absorption triangles in a downtrend might precede a relief rally. They are early warnings – pay attention if they start to cluster or coincide with known S/R levels.
• The combined labels OB+DIST and OS+ABS are stronger alerts since they mean both the indicators and volume are screaming extreme. These are relatively rarer; when they appear, the likelihood of at least a short-term reversal is higher. Still, disciplined risk management is essential as markets can remain overbought/oversold longer than expected.
• No Guarantees & Context: It’s important to emphasize that none of these outputs guarantee a price will move in a certain direction. They highlight conditions that historically often precede moves. Volume Scope Pro should be used as an informational tool to augment your analysis. For example, you might use it to confirm a breakout (volume delta turning strongly positive on a price break) or to spot divergence (price making a new high but Δ Sum not increasing). Always consider the broader context: trend direction, higher timeframe signals, fundamental news, etc. A bullish signal in a strong downtrend may only yield a minor correction, and a bearish signal in a roaring uptrend might just be a pause.
• Avoiding Over-Optimization: The indicator comes with many inputs. It might be tempting to tweak them frequently, but it’s recommended to start with defaults and adjust only if you understand the effect. For instance, if you increase Minimum Vote Count for OB/OS, you’ll get fewer but more conservative signals – you might miss early warnings. Changing Volume Spike Ratios alters how sensitive the volume filter is – lower ratios give more signals (even on modest volume rises) but risk false alarms. Use these settings to tailor the indicator to the asset or timeframe (e.g., a very high-volume asset might justify a higher spike ratio). The defaults have been chosen to suit a wide range of scenarios reasonably well.
• Performance and Chart Load: Volume Scope Pro does heavy processing by requesting a lower timeframe and calculating many values. On some platforms, loading this indicator might be slightly slower or consume more memory. It’s invite-only and not open-source, which means the calculations happen behind the scenes. If you experience any slowness, you can try using a less granular lower timeframe (e.g., 1min instead of 15s) or reduce the Global Volume Period to lighten the load. Generally it runs efficiently, but be mindful if stacking it with many other complex indicators.
In summary, Volume Scope Pro provides a set of volume-centric insights: from basic buy/sell volume split and delta, to trend alignment, to volume-profile S/R levels, to multi-indicator OB/OS warnings with volume validation. It adheres strictly to providing factual, data-driven information with no predictive guarantees. Traders can utilize this tool to observe where large buyers or sellers might be operating (“smart money”), detect when volume behavior contradicts price (a sign of potential reversals), and identify hidden support and resistance zones. All these pieces of information, when combined with sound strategy and risk management, can improve decision-making. Always remember to use this indicator as one part of a comprehensive analysis.

DCA Percent SignalOverview
The DCA Percent Signal Indicator generates buy and sell signals based on percentage drops from all-time highs and percentage gains from lowest lows since ATH. This indicator is designed for pyramiding strategies where each signal represents a configurable percentage of equity allocation.
Definitions
DCA (Dollar-Cost Averaging): An investment strategy where you invest a fixed amount at regular intervals, regardless of price fluctuations. This indicator generates signals for a DCA-style pyramiding approach.
Gann Bar Types: Classification system for price bars based on their relationship to the previous bar:
Up Bar: High > previous high AND low ≥ previous low
Down Bar: High ≤ previous high AND low < previous low
Inside Bar: High ≤ previous high AND low ≥ previous low
Outside Bar: High > previous high AND low < previous low
ATH (All-Time High): The highest price level reached during the entire chart period
ATL (All-Time Low): The lowest price level reached since the most recent ATH
Pyramiding: A trading strategy that adds to positions on favorable price movements
Look-Ahead Bias: Using future information that wouldn't be available in real-time trading
Default Properties
Signal Thresholds:
Buy Threshold: 10% (triggers every 10% drop from ATH)
Sell Threshold: 30% (triggers every 30% gain from lowest low since ATH)
Price Sources:
ATH Tracking: High (ATH detection)
ATL Tracking: Low (low detection)
Buy Signal Source: Low (buy signals)
Sell Signal Source: High (sell signals)
Filter Options:
Apply Gann Filter: False (disabled by default)
Buy Sets ATL: False (disabled by default)
Display Options:
Show Buy/Sell Signals: True
Show Reference Lines: True
Show Info Table: False
Show Bar Type: False
How It Works
Buy Signals: Trigger every 10% drop from the all-time highest price reached
Sell Signals: Trigger every 30% increase from the lowest low since the most recent all-time high
Smart Tracking: Uses configurable price sources for signal generation
Key Features
Configurable Thresholds: Adjustable buy/sell percentage thresholds (default: 10%/30%)
Separate Price Sources: Independent sources for ATH tracking, ATL tracking, and signal triggers
Configurable Signals: Uses low for buy signals and high for sell signals by default
Optional Gann Filter: Apply Gann bar analysis for additional signal filtering
Optional Buy Sets ATL: Option to set ATL reference point when buy signals occur
Visual Debug: Detailed labels showing signal parameters and values
Usage Instructions
Apply to Chart: Use on any timeframe (recommended: 1D or higher for better signal quality)
Risk Management: Adjust thresholds based on your risk tolerance and market volatility
Signal Analysis: Monitor debug labels for detailed signal information and validation
Signal Logic
Buy signals are blocked when ATH increases to prevent buying at peaks
Sell signals are blocked when ATL decreases to prevent selling at lows
This ensures signals only trigger on subsequent bars, not the same bar that establishes new reference points
Buy Signals:
Calculate drop percentage from ATH to buy signal source
Trigger when drop reaches threshold increments (10%, 20%, 30%, etc.)
Always blocked on ATH bars to prevent buying at peaks
Optional: Also blocked on up/outside bars when Gann filter enabled
Sell Signals:
Calculate gain percentage from lowest low to sell signal source
Trigger when gain reaches threshold increments (30%, 60%, 90%, etc.)
Always blocked when ATL decreases to prevent selling at lows
Optional: Also blocked on down bars when Gann filter enabled
Limitations
Designed for trending markets; may generate many signals in sideways/ranging markets
Requires sufficient price movement to be effective
Not suitable for scalping or very short timeframes
Implementation Notes
Signals use optimistic price sources (low for buys, high for sells), these can be configured to be more conservative
Gann filter provides additional signal filtering based on bar types
Debug information available in data window for real-time analysis
Detailed labels on each signal show ATH, lowest low, buy level, sell level, and drop/gain percentages

Livermore's Pyramiding Trading - 3Commas [SwissAlgo]
📊 J. LIVERMORE'S PYRAMIDING TRADING - 3Commas Integrated
A Trading Approach Inspired by Jesse Livermore's Position Building Principles
━━━━━━━━━━━━━━━━━━━━━━━━━━━━━━━━━━━━━━━━━━━
DISCLAIMER
This indicator is an educational tool based on historical trading principles. Past performance is not indicative of future results. Trading involves substantial risk of loss. Only trade with capital you can afford to lose. You are responsible for all trading decisions.
━━━━━━━━━━━━━━━━━━━━━━━━━━━━━━━━━━━━━━━━━━━
📚 WHO WAS JESSE LIVERMORE?
Jesse Livermore (1877-1940) was one of the greatest traders in history.
His core insight: "Most traders do everything backward."
♦ "They deploy all capital at once" → Livermore entered with a small fraction of his capital (he started with a 'test position' to validate his trade idea and waited for market confirmation to deploy more, building positions in steps = "pyramiding")
♦ "They average down" (DCA) → Livermore added to trades showing good results only, and never to losing trades, as the trend kept aligning with his trade idea
♦ "They use arbitrary % stops" → Livermore exited when structure appeared broken (he trailed his stop loss to try to protect unrealized profit - if any)
♦ "They take profits too early or set arbitrary TP%" → Livermore let trades showing positive results run until proven wrong (trial take profit)
💬 "I always made money when I was sure I was right before I began. What beat me was not having enough brains to stick to my own game."
— Jesse Livermore
This indicator tries to translate his principles into a SYSTEMATIC FRAMEWORK :
BO = Base Order (first order, base of the pyramid)
PO = Pyramid Orders (additional layers of capital deployed as long as the 'tape' does not invalidate the trade idea)
♦ Test First (BO - 20%) - Small entry to test your idea. If wrong, lose small. If right, can consider pyramiding into strength.
♦ Build Position Size (PO1-3 - 80%) - Add only as trend unfolds favorably (the indicator uses specific Fibonacci levels to track milestones - 0.618, 1.0, 1.272 - and looks for strong confluence among price, volume, trend, momentum, break of resistance/support levels to suggest and trigger actions: entries, exit)
♦ Attempt to Protect Capital - Dynamic stops: the indicator trails the stop loss, to try to protect potential gains from previous steps (if any)
♦ Discipline - Trades fire only when ALL conditions align
━━━━━━━━━━━━━━━━━━━━━━━━━━━━━━━━━━━━━━━━━━━
🎯 INDICATOR FEATURES
You map 3 points on the chart → The indicator generates a systematic trading plan structure based on your wave analysis.
✓ Auto-detects trade direction: Uptrend wave (A➚B➘C) = Long signals | Downtrend wave (A➘B➚C) = Short signals
✓ Entry/exit prices: BO, PO1, PO2, PO3, and dynamic EXIT (trailing stop)
✓ Real-time condition monitoring: Live ✓/✗ checks for each order (price closes + volume + trend + pivot breaks + candle quality + sequence)
✓ Visual trade execution: Green labels mark entries (BO/PO1/PO2/PO3), red labels mark EXIT
✓ Optional 3Commas automation: JSON webhooks for hands-free execution via Signal Bots
⏰ Recommended Timeframes: 1H, 4H, Daily
(Lower timeframes like 15m/5m produce excessive noise and false signals)
💬 "Watch the market leaders, the stocks that have led the charge. That is where the action is and where the money is made."
— Jesse Livermore
━━━━━━━━━━━━━━━━━━━━━━━━━━━━━━━━━━━━━━━━━━━
⚙️ SETUP IN 3 STEPS
🟡 STEP 1: Map Your Wave (Points A → B → C)
Identify a completed wave pattern:
For LONGS:
♦ Point A = Swing low (wave start)
♦ Point B = Swing high (impulse end)
♦ Point C = Pullback low (retrace end - where next wave may begin)
For SHORTS:
♦ Point A = Swing high (wave start)
♦ Point B = Swing low (impulse end)
♦ Point C = Pullback high (retrace end - where next wave may begin)
How to set points:
Settings → Enter dates manually OR drag the vertical lines directly on the chart (easier - just click and drag the pre-mapped A/B/C lines)
Requirements (auto-validated by code):
✓ All dates must be in the past (Point C = completed retrace, not forming)
✓ Clear impulse A→B (minimum 5% move)
✓ Clear retrace B→C (minimum 3% pullback)
───────────────────────────────────────────
🟡 STEP 2: Set Budget & Allocation
Settings → "TRADE PARAMETERS"
♦ Total Budget: $10,000 (example - capital for THIS trade only, not your entire account)
♦ Allocation (must total 100%):
BO = 20% ($2,000) - test position
PO1 = 25% ($2,500) @ Fib 0.618
PO2 = 30% ($3,000) @ Fib 1.0
PO3 = 25% ($2,500) @ Fib 1.272
💬 "It was never my thinking that made big money for me. It was always my sitting. Men who can both be right and sit tight are uncommon."
— Jesse Livermore
───────────────────────────────────────────
🟡 STEP 3: Monitor Your Trade Plan Table
The table (top-right corner) has 4 sections that guide your execution:
BUDGET DEPLOYMENT
♦ Trigger prices for each order (BO auto-calculated at 0.5 Fib between B-C)
♦ Dollar amount per entry
♦ Fibonacci level assigned to each PO
ENTRY/EXIT CONDITIONS
Each column (BO, PO1, PO2, PO3) shows live status (✓ or ✗) for:
♦ Price: 2 consecutive closes (BO) | 3 consecutive closes (POs)
♦ Volume: OBV directional alignment OR volume spike above average
♦ Trend: Normal or Strong Bull/Bear (no entries in Uncertain trend)
♦ Pivot: Nearest resistance (longs) or support (shorts) broken
♦ Clean Candle: Momentum without reversal wicks <30% (POs only)
♦ Sequence: Prior order must have fired first (POs only - no skipping levels)
TRIGGERED?
Shows execution status for each order (✓ = fired, ✗ = waiting)
If using 3Commas: ✓ confirms JSON alert was sent to your bot for real execution
VALIDATIONS
✓ Green = All checks passed, setup is valid
⚠️ Yellow = Warning (e.g., budget doesn't equal 100%, deep retrace)
✗ Red = Error (e.g., dates in wrong order, invalid wave structure)
⚠️ Wait for ALL ✓✓✓✓✓ (or ✓✓✓✓✓✓) to align in a column before that order fires at bar close
💬 "The game of speculation is the most uniformly fascinating game in the world. But it is not a game for the stupid, the mentally lazy, the person of inferior emotional balance, or the get-rich-quick adventurer."
— Jesse Livermore
━━━━━━━━━━━━━━━━━━━━━━━━━━━━━━━━━━━━━━━━━━━
📊 CHART VISUALS - READING THE INDICATOR
Fibonacci Extension Lines
After mapping A-B-C, horizontal lines extend to the right:
♦ Solid green/red lines = Active PO entry levels (0.618, 1.0, 1.272)
♦ Dotted gray lines = Reference Fib levels used for exit tracking (2.0, 2.618, 3.0, etc.)
♦ Labels on right = Show level and price: "Fib 0.618 / $67,324 "
Entry/Exit Price Lines
♦ Thick green line (longs) / red line (shorts) = BO entry price with direction label
♦ Dashed red line = Current EXIT price (your trailing stop loss - appears after BO fires and moves as price extends)
Trade Execution Labels
Visual confirmation when orders fire on the chart:
♦ Green labels (below/above candles) = BO, PO1, PO2, PO3 entries executed
♦ Red label = EXIT triggered (position closed)
Trend Strength Indicator (EMA Line)
The thick colored line shows real-time trend status:
♦ Bright lime = Strong bullish trend
♦ Light green = Normal bullish trend
♦ Bright red = Strong bearish trend
♦ Light red = Normal bearish trend
♦ Gray = Uncertain/weak trend (no entries fire in this state)
Entries require at least Normal trend strength aligned with your trade direction.
💬 "I never argue with the tape. Getting sore at the market doesn't get you anywhere."
— Jesse Livermore
━━━━━━━━━━━━━━━━━━━━━━━━━━━━━━━━━━━━━━━━━━━
🔧 ENTRY LOGIC - TECHNICAL DETAILS
💬 "The big money was never made in the buying or the selling. The big money was made in the waiting."
— Jesse Livermore
───────────────────────────────────────────
🟢 BASE ORDER (BO) - TEST POSITION
BO Price Calculation
Auto-calculated at the 0.5 Fibonacci retracement between Point B and Point C
Formula: (Price B + Price C) / 2
Why this level?
♦ Midpoint between impulse end (B) and retrace end (C)
♦ Breakout above/below suggests retrace may be complete
♦ Designed to help position BO below all Fib extensions (to control sequence issues)
───────────────────────────────────────────
BO Entry Conditions - ALL 5 Must Align:
1️⃣ PRICE: 2 Consecutive Closes Beyond BO
♦ Longs: close > BO AND close > BO
♦ Shorts: close < BO AND close < BO
♦ Why: Designed to confirm breakout commitment and filter fakeouts
2️⃣ TREND: Normal OR Strong Trend Aligned
♦ Detection: 18-period EMA + ADX/DMI + higher timeframe slope
♦ States: Strong Bull/Bear (ADX>30), Normal Bull/Bear (price vs EMA), Uncertain
♦ Confirmation: Requires 3 consecutive bars in the same state (to reduce flip-flop)
♦ BO accepts: Normal OR Strong (you're testing early, basic alignment sufficient)
3️⃣ PIVOT: Nearest Resistance/Support Broken
♦ Storage: 60 most recent pivot highs/lows (dynamic lookback per timeframe)
♦ Longs: Nearest pivot HIGH above BO → must break with 2 closes
♦ Shorts: Nearest pivot LOW below BO → must break with 2 closes
♦ Price Discovery: If no pivot exists beyond BO = auto-pass
♦ Why: Aims to confirm momentum has overcome previous rejection zones
4️⃣ VOLUME: OBV Aligned OR Spike
♦ Directional OBV: OBV > 20-EMA (longs) OR OBV < 20-EMA (shorts)
♦ OR Volume Spike: Current volume > 20-period SMA
♦ Why: Checks for institutional participation signals
5️⃣ VALIDATIONS: Setup Valid (✅)
♦ Dates valid (A < B < C, all in past)
♦ Wave structure valid (min 5% impulse, min 3% retrace)
♦ Budget allocation = 100%
♦ Prices detected at all points
⚠️ BO fires once per bar close. Flag set permanently until trade resets.
───────────────────────────────────────────
🔺 PYRAMID ORDERS (PO1-3) - PYRAMIDING INTO STRENGTH
💬 "Never buy a stock because it has had a big decline from its previous high. The big money was never made in the stock market by buying on declines."
— Jesse Livermore
PO Price Calculation
Fixed Fibonacci extensions from Point C:
Formula: Price C ± (Impulse Range × Fib Level)
Where: Impulse Range = |Price B - Price A|
Default Levels:
♦ PO1 @ Fib 0.618 (Golden Ratio)
♦ PO2 @ Fib 1.000 (Full impulse repeat)
♦ PO3 @ Fib 1.272 (Fibonacci sequence extension)
───────────────────────────────────────────
PO Entry Conditions - ALL 6 Must Align (STRICTER):
1️⃣ PRICE: 3 Consecutive Closes Beyond PO
♦ Longs: close > PO AND close > PO AND close > PO
♦ Shorts: close < PO AND close < PO AND close < PO
♦ Why: Higher conviction needed when adding capital (3 vs 2 closes for BO)
2️⃣ TREND: Same as BO
Normal OR Strong trend must remain aligned with trade direction
3️⃣ PIVOT: Per-Level Pivot Break
♦ Each PO checks its OWN nearest pivot (not shared with BO)
♦ Same 2-close break requirement
♦ PO3 Exception: Price discovery allowed (no pivot required if already profitable)
4️⃣ VOLUME: Same as BO
Sustained confirmation required (not weakening)
5️⃣ CLEAN CANDLE: <30% Reversal Wick (NEW)
♦ Filter: Uses ATR(14) - candles < ATR auto-pass (consolidation noise)
♦ Longs: Upper wick < 30% of candle range (no rejection at top)
♦ Shorts: Lower wick < 30% of candle range (no rejection at bottom)
♦ Why: Don't pyramid into weakness/rejection - only add on clean momentum
♦ Not checked for BO: Test position tolerates some wick risk
6️⃣ SEQUENCE: Prior Order Fired
♦ PO1 requires: BO fired
♦ PO2 requires: PO1 fired
♦ PO3 requires: PO2 fired
♦ Why: No skipping levels - disciplined building only
───────────────────────────────────────────
⚙️ KEY DIFFERENCE:
BO (20% capital) = Lighter requirements, testing your idea early
POs (80% capital) = Stricter requirements, adding only to confirmed winners
♦ BO: 2 closes | POs: 3 closes
♦ BO: No candle check | POs: Clean candle required
♦ BO: Independent | POs: Sequential (must follow order)
♦ BO: No price discovery | PO3: Allows price discovery when profitable
💬 "Profits always take care of themselves, but losses never do. The speculator has to ensure himself against considerable losses by taking the first small loss."
— Jesse Livermore
━━━━━━━━━━━━━━━━━━━━━━━━━━━━━━━━━━━━━━━━━━━
🚪 EXIT LOGIC - TECHNICAL DETAILS
🔴 EXIT PHILOSOPHY
The indicator uses TWO INDEPENDENT EXIT TRIGGERS (whichever fires first):
1) Structural Breakdown
Price breaks through the EXIT level with confirmation
2) Trend Reversal
Trend flips against your position AND price breaks EXIT level
Why two methods?
♦ Structure = price-based protection (hard stop)
♦ Trend = momentum-based exit (early warning when market character changes)
♦ Combined: Exit either when proven wrong (structure) or when conditions no longer favor your direction (trend)
───────────────────────────────────────────
🔴 EXIT PRICE CALCULATION
The EXIT price (your stop loss) adjusts dynamically based on position size:
BEFORE PO3 Fires (Fixed Stops):
♦ BO only = Stop at Point C (small position, tight stop near entry)
♦ PO1 fired = Stop at Fib 0.5 (moved to breakeven zone)
♦ PO2 fired = Stop at Fib 0.786 (protecting partial profits)
AFTER PO3 Fires (Trailing Stops):
♦ Tracking: Monitors the highest Fib reached (longs) or the lowest Fib reached (shorts)
♦ Placement: EXIT moves 1-2 Fib levels below the highest (longs) or above the lowest (shorts)
♦ Example: Price reaches Fib 2.618 → EXIT trails up to Fib 2.0
♦ Purpose: Designed to protect accumulated profits while allowing room for normal pullbacks
💬 "It never was my thinking that made the big money for me. It was always my sitting. Men who can both be right and sit tight are uncommon."
— Jesse Livermore
───────────────────────────────────────────
🔴 EXIT CONDITIONS
Exit Speed (Based on Risk Exposure):
♦ Full position (PO3 fired) = 1 close required (fast exit - more capital at risk)
♦ Partial position (BO/PO1/PO2 only) = 2 closes required (confirmation - less urgency)
METHOD 1: Structural Breakdown
Price violates the EXIT level with clean momentum:
For Longs:
♦ Price closes BELOW EXIT level (1 or 2 closes depending on position size)
♦ Clean candle required (lower wick < 50% of range - no false breakdown)
For Shorts:
♦ Price closes ABOVE EXIT level (1 or 2 closes depending on position size)
♦ Clean candle required (upper wick < 50% of range - no false breakout)
Why clean candle check?
Designed to reduce exits on wicks/fakeouts. If there's a large reversal wick (>50%), it suggests buyers/sellers are defending the level - not a true breakdown.
METHOD 2: Trend Reversal
Market character shifts against your position:
For Longs:
♦ Trend shifts from Bull → Normal Bear OR Strong Bear
♦ AND price breaks below EXIT level (same close requirements)
For Shorts:
♦ Trend shifts from Bear → Normal Bull OR Strong Bull
♦ AND price breaks above EXIT level (same close requirements)
Why this matters?
♦ Proactive exit before structural stop is hit
♦ If the trend that confirmed your entries reverses, the setup is invalidated
♦ Livermore principle: Exit when market proves you wrong, don't wait for max pain
───────────────────────────────────────────
⚠️ EXIT BEHAVIOR
♦ Fires once per bar close (same as entries)
♦ Resets all tracking after exit (ready for fresh trade setup)
♦ Clears flags: boSignalFired, po1/po2/po3SignalFired, highestFib/lowestFib tracking
♦ If using 3Commas: Sends exit_long or exit_short JSON (market order closes 100% position)
💬 "I never argue with the tape. Getting sore at the market doesn't get you anywhere."
— Jesse Livermore
━━━━━━━━━━━━━━━━━━━━━━━━━━━━━━━━━━━━━━━━━━━
🤖 3COMMAS AUTOMATION (OPTIONAL)
💬 "There is the plain fool, who does the wrong thing at all times everywhere, but there is also the Wall Street fool, who thinks he must trade all the time."
— Jesse Livermore
Automation designed to help remove emotion and support disciplined execution.
───────────────────────────────────────────
⚡ QUICK SETUP IN 5 STEPS
STEP 1: Create Your Signal Bots
You need 2 SEPARATE BOTS (one for Longs, one for Shorts):
Go to 3Commas → Bots → Create Bot → Select "Signal Bot"
Basic Settings:
♦ Bot Name: "Livermore Long - " (example: "Livermore Long - BTCUSDT")
♦ Exchange: Your connected exchange
♦ Trading Pair: Must match TradingView chart exactly
♦ Strategy: Custom Signal
♦ Direction: LONG (for first bot) or SHORT (for second bot)
♦ Max Active Deals: 1
⚠️ CRITICAL SETTINGS:
Entry Orders:
♦ Toggle ON: "Entry Orders"
♦ Volume per Order: "Send in webhook, quote"
♦ Why: This lets the indicator control exact $ amounts per order (BO=$2K, PO1=$2.5K, etc.)
♦ If you skip this: Orders will use wrong sizes and break your allocation plan
Exit Orders:
♦ Toggle ON: "Exit Orders"
♦ Volume per Order: "100 Position %"
♦ Why: Closes your entire position when EXIT signal fires
♦ Toggle OFF: "Take Profit" (managed by indicator)
♦ Toggle OFF: "Stop Loss" (managed by indicator)
Click "Start Bot" for both Long and Short bots.
───────────────────────────────────────────
STEP 2: Get Your Bot Credentials
For EACH BOT (Long and Short):
♦ Open the bot → Click "Orders" tab
♦ Scroll down to "Webhook Messages" section
♦ Copy these 3 values:
bot_uuid (long string like: a362cbcf-7e68-4379-a83d-ae6e47dba656)
secret (very long token starting with: eyJhbGciOiJ...)
webhook URL (refer to 3commas to get exact webhook - signal bots)
Note: The secret is usually the same for both bots, but the bot_uuid is different.
───────────────────────────────────────────
STEP 3: Enter Credentials in Indicator
Back in TradingView:
♦ Open indicator Settings
♦ Find section: "1️⃣ INTEGRATE 3COMMAS"
♦ Paste:
Long = Your Long bot UUID
Short = Your Short bot UUID
Secret = Your secret token (same for both)
♦ Click "OK"
The indicator now has everything needed to build JSON payloads.
───────────────────────────────────────────
STEP 4: Create TradingView Alert
This alert bridges TradingView → 3Commas. ONE ALERT HANDLES ALL SIGNALS (BO, PO1, PO2, PO3, EXIT).
How to create:
♦ Right-click chart → "Add Alert" (or click clock icon)
♦ Condition: Select this indicator from dropdown
♦ Trigger: "Any alert() function call"
♦ Alert Name: "Livermore Pyramiding - "
♦ Message: Leave default (indicator sends its own JSON)
♦ Webhook URL: Paste your 3Commas webhook URL from Step 2
♦ ⚠️ Alert Frequency: "Once Per Bar Close" (CRITICAL - controls duplicate orders)
♦ Expiration: Open-ended (or set specific date)
♦ Click "Create"
───────────────────────────────────────────
STEP 5: Test Before Going Live
🧪 NEVER TEST WITH REAL CAPITAL FIRST. Use one of these methods:
Test 1: Check Bot Status
♦ 3Commas → Bots → Both bots show "Active" (green)
♦ Click into each bot → Orders tab → Should say "Waiting for signal"
Test 2: Verify Alert Active
♦ TradingView → Alerts panel (bell icon)
♦ Your alert should show "Active" status
Test 3: Paper Trade / Tiny Position
♦ Use 3Commas paper mode if available, OR
♦ Set Total Budget to $10-50 for first real test
♦ Map a wave that's about to trigger
♦ Watch if orders actually appear on 3Commas
Test 4: Check JSON Format
♦ When alert fires → TradingView Alerts → Click your alert
♦ Look at "History" or "Log"
♦ Verify JSON has: bot_uuid, secret, action, price, amount
───────────────────────────────────────────
🛠️ COMMON ISSUES & SOLUTIONS
✗ Problem: Orders not appearing on 3Commas
Possible causes:
♦ Wrong webhook URL → Must be exact 3Commas URL (check for typos)
♦ Bot paused → Check bot status must be "Active" (green)
♦ Wrong bot UUID → Verify you copied Long UUID for longs, Short UUID for shorts
♦ Secret mismatch → Double-check secret is correct
♦ Exchange API issues → Verify exchange connection in 3Commas settings
How to debug:
♦ 3Commas → Your Signal Bot → Orders tab
♦ Look for "Rejected Signals" section
♦ Should show error messages if webhook failed
───────────────────────────────────────────
✗ Problem: Orders executing at wrong prices
Possible causes:
♦ Limit order not filled → Price gapped through your level before order filled
♦ Slippage on exits → Exits use market orders (intentional - speed over exact price)
♦ Exchange minimums → Some exchanges have minimum order sizes
Solution:
♦ Entries use limit orders (wait for exact price - may not fill if price gaps)
♦ Exits use market orders (prioritize fast execution when structure breaks)
♦ This is INTENTIONAL DESIGN following Livermore's principle: exit when proven wrong
───────────────────────────────────────────
✗ Problem: PO orders firing out of sequence or skipping
Possible causes:
♦ Alert not set to "Once Per Bar Close" → Change alert frequency setting
♦ Multiple alerts running → Delete old/duplicate alerts for this indicator
♦ Conditions changed mid-bar → Indicator only fires at bar close (protective feature)
Solution:
♦ Keep only 1 active alert per indicator instance
♦ Always use "Once Per Bar Close" frequency
♦ Wait for full bar to close before signals can fire
───────────────────────────────────────────
✗ Problem: Bot not closing position on EXIT
Possible causes:
♦ Exit order setting wrong → Check bot settings
♦ Wrong JSON action → Should be "exit_long" or "exit_short"
♦ No position open → Can't close what doesn't exist
Solution:
♦ Verify: Bot Settings → Exit Orders → Volume per Order = "100 Position %"
♦ Check alert history for correct JSON payload
♦ If stuck: Manually close position in 3Commas, then fix settings
♦ Delete and recreate alert if JSON format is wrong
───────────────────────────────────────────
🔒 SECURITY BEST PRACTICES
♦ Never share bot UUID or Secret - Treat them like passwords
♦ Use restricted API keys - Limit to specific pairs, disable withdrawals
♦ Start small - Test with $10-50 first, scale up only after success
♦ Monitor first trades - Don't set-and-forget immediately
♦ Delete old alerts - If you change A/B/C points, delete old alert and create new one
───────────────────────────────────────────
📊 PREFER MANUAL TRADING?
Skip 3Commas entirely and use the indicator for planning only:
♦ Watch Trade Plan table for ✓✓✓✓✓ alignment
♦ Manually place limit orders at displayed prices
♦ Manually move stop loss as EXIT price updates
♦ Manually close when EXIT signal fires
Benefits: Full control, no API concerns, can override based on context
Drawbacks: Must watch chart constantly, emotions can interfere, may miss signals
───────────────────────────────────────────
✅ FINAL CHECKLIST BEFORE LIVE TRADING
✓ Both Signal Bots created (Long + Short)
✓ Entry Orders: Volume = "Send in webhook, quote"
✓ Exit Orders: Volume = "100 Position %"
✓ Take Profit and Stop Loss disabled in bots
✓ Bot UUIDs and Secret entered in indicator
✓ TradingView alert created with correct webhook
✓ Alert frequency = "Once Per Bar Close"
✓ Alert status shows "Active"
✓ Tested with small amounts successfully
✓ Trade Plan table shows ✅ (no validation errors)
✓ Understand your risk per trade
Once all checked: You're ready for automated pyramiding execution.
━━━━━━━━━━━━━━━━━━━━━━━━━━━━━━━━━━━━━━━━━━━
💡 KEY REMINDERS - BEFORE YOU TRADE
💬 "The speculator's chief enemies are always boring from within. It is inseparable from human nature to hope and to fear."
— Jesse Livermore
───────────────────────────────────────────
⚠️ COMMON MISTAKES (AVOID THESE)
Mapping Incomplete Waves
♦ Point C must be in the PAST (completed retrace, not currently forming)
♦ Don't map a wave that's still developing - wait for confirmation
♦ Minimum requirements: 5% impulse (A→B), 3% retrace (B→C)
Ignoring Validation Warnings
♦ Never create alerts when status shows ✗ (red) or ⚠️ (yellow)
♦ Fix all errors first: dates in order, budget = 100%, valid wave structure
♦ Common issues: dates in future, Point C above B (longs) or below B (shorts)
Premature Manual Entries
♦ Don't enter just because price touched the level
♦ Wait for ALL ✓✓✓✓✓ (or ✓✓✓✓✓✓) to align in Trade Plan table
♦ Patience pays - partial confluence = partial edge = higher risk of losing trades
Wrong Timeframe Selection
♦ Avoid: 15m, 5m, 1m (too much noise, false signals)
♦ Use: 1H, 4H, Daily (cleaner structure, better confluence)
♦ Lower timeframes require faster decisions and produce more whipsaws
Over-Risking Capital
♦ Trade budget ≠ Account size
♦ Never risk capital you can't afford to lose
♦ One bad trade should NOT destroy your account
───────────────────────────────────────────
✅ LIVERMORE PRINCIPLES IN ACTION
Confirmation > Prediction
♦ Don't predict where price will go
♦ Wait for price to INDICATE direction via pivots + volume + trend
♦ Test first (BO 20%), build only when confirmed (POs 80%)
💬 "A man must believe in himself and his judgment if he expects to make a living at this game."
Pyramid on Strength, Never Weakness
♦ Add only when: 3 closes + clean candles + volume + pivot breaks
♦ Never average down (DCA into losers)
♦ If BO wrong, take small loss fast - don't hope and add more
💬 "Never buy a stock because it has had a big decline from its previous high."
Respect Market Structure
♦ Pivots = where smart money previously acted (support/resistance)
♦ Breaking them = momentum overcoming barriers
♦ Entering before pivot break = entering into known rejection zones
Trend is Your Friend
♦ Never pyramid against the trend
♦ If trend shifts to Uncertain or reverses → no new entries
♦ Exit when trend proves you wrong (don't fight it)
💬 "I never argue with the tape. Getting sore at the market doesn't get you anywhere."
Discipline > Emotion
♦ Can't "almost" have all conditions met
♦ Either 100% aligned (all ✓) or you wait
♦ No exceptions, no "this time is different"
♦ Automation designed to help remove emotion - consider using 3Commas
💬 "It never was my thinking that made the big money for me. It always was my sitting."
───────────────────────────────────────────
🎯 FINAL THOUGHT
This indicator is a SYSTEMATIC FRAMEWORK, not a magic solution. It translates Livermore's century-old principles into actionable rules:
♦ Test small, build big
♦ Add to winners, cut losers fast
♦ Let structure guide exits
♦ Stay disciplined when emotions scream
The market will test your patience, discipline, and conviction. The indicator aims to reduce guesswork - but YOU still need to:
♦ Find valid wave structures
♦ Choose appropriate market conditions
♦ Size positions properly
♦ Accept losses as part of the game
💬 "The game of speculation is the most uniformly fascinating game in the world. But it is not a game for the stupid, the mentally lazy, the person of inferior emotional balance, or the get-rich-quick adventurer."
— Jesse Livermore

Range Stats with Sweeps + Time Analysis + BiasRange Stats with Sweeps + Time Analysis + Bias
Advanced range-based trading analysis with comprehensive sweep detection, time-based probability modeling, and intelligent bias calculation for institutional-grade market insights.
Overview
Range Stats with Sweeps + Time Analysis + Bias is a sophisticated Pine Script indicator designed for professional traders who demand precision in range-based market analysis. This comprehensive tool combines traditional range level analysis with advanced sweep detection algorithms, time-based probability modeling, and dynamic bias calculation to provide institutional-quality insights into market behavior patterns.
Core Features
Multi-Timeframe Range Analysis
Automatic or manual timeframe selection with intelligent defaults
Comprehensive range level calculation including High, Low, Open, 75%, EQ (50%), and 25% retracements
Dynamic period detection supporting both traditional timeframes and custom session-based analysis
Real-time range updates with historical data preservation
Advanced Sweep Detection System
Configurable sweep validation with customizable bar confirmation periods
Optional wick-based sweep requirements for enhanced precision
Segment-based sweep tracking dividing periods into three analytical zones
Real-time sweep markers with probability-enhanced labeling
Comprehensive Bias Calculation Framework
Intelligent range bias determination based on price action relative to range boundaries
Dynamic bias tracking with bullish, bearish, and neutral state identification
Historical bias performance statistics with hit rate analysis
Optimal Trade Entry (OTE) box generation based on current bias and displacement analysis
Time-Based Probability Analysis
Formation time tracking for high and low levels with customizable time buckets
Sweep probability calculation based on exact formation timing
Multiple time range displays including Full 24H, Extended Trading, US Market, EU Market, and Asia Market sessions
Custom session configuration with intelligent session-based level detection
Professional Visualization System
Customizable line styles, colors, and transparency settings for all range levels
Segment projection lines for period structure visualization
Comprehensive probability tables with real-time statistics
Time-enhanced labels showing formation times and sweep probabilities
Technical Implementation
Range Detection Logic
The system employs sophisticated algorithms to identify range boundaries using either traditional timeframe-based detection or custom session-based analysis. Range levels are calculated with mathematical precision, providing 75%, 50%, and 25% retracement levels based on period high-low ranges.
Sweep Analysis Framework
Advanced sweep detection monitors price action for liquidity grabs above highs and below lows, with configurable validation periods ensuring sweep authenticity. The system tracks sweep occurrences across three distinct period segments, enabling granular probability analysis.
Bias Calculation Engine
The intelligent bias system analyzes price behavior relative to range boundaries, considering factors such as wick interactions, close positioning, and directional momentum. This generates dynamic bias signals that adapt to changing market conditions.
Time-Based Modeling
Sophisticated time bucket analysis tracks formation times for range extremes, building comprehensive probability models that identify optimal trading windows based on historical performance patterns.
Configuration Options
Core Settings
Automatic or manual timeframe selection with comprehensive options
Global timezone support with major market timezone presets
Configurable label sizing and time format preferences
Advanced sweep validation parameters with wick-based options
Range Level Customization
Individual control over all range level displays and styling
Custom color schemes with transparency controls
Line style selection including solid, dashed, and dotted options
Adjustable line widths for enhanced visual hierarchy
Advanced Features
Segment projection line configuration for period structure analysis
Bias calculation toggle with OTE box generation
Sweep extreme probability tracking with period extreme analysis
Comprehensive sweep marker system with probability labeling
Time Analysis Configuration
Multiple time bucket options including 20-minute, 1-hour, 2-hour, and custom session buckets
Flexible time range displays optimized for different trading sessions
Custom session configuration with intelligent session-based level detection
Advanced table positioning and sizing options
Trading Applications
Range-Based Strategy Development
Identify key support and resistance levels within established ranges, analyze retracement probabilities for optimal entry timing, and utilize segment-based analysis for precise trade planning.
Sweep-Based Trading
Monitor liquidity grab events with high-probability retracement targets, track sweep occurrences across different period segments, and leverage time-based sweep probability for enhanced timing.
Bias-Driven Analysis
Utilize dynamic bias calculation for directional trade alignment, implement OTE box strategies for institutional-style entries, and monitor bias shifts for trend change identification.
Time-Based Optimization
Optimize trade timing using formation time probability analysis, focus on high-probability time windows for specific market behaviors, and customize analysis for preferred trading sessions.
Technical Specifications
Built on Pine Script v6 with advanced optimization techniques
Comprehensive data collection with intelligent memory management
Real-time probability calculation with historical data preservation
Multi-session support with custom timezone handling
Professional-grade visualization with institutional styling
Important Considerations
This indicator is designed for experienced traders familiar with range-based analysis and institutional trading concepts. Optimal performance requires adequate historical data for probability calculation accuracy. Users should ensure proper timeframe and session configuration alignment with their trading strategy.
Disclaimer
This indicator is provided for educational and informational purposes only. It does not constitute financial advice, investment recommendations, or trading signals. All trading decisions should be based on your own analysis, risk tolerance, and financial situation. Past performance does not guarantee future results. Trading involves substantial risk of loss and is not suitable for all investors. The probability statistics and bias calculations are based on historical data and may not predict future market behavior. Always conduct thorough research and consider consulting with qualified financial professionals before making trading decisions.
Copyright
© 2025 OmarxQQQ. All rights reserved. This Pine Script indicator and its associated documentation are protected by copyright law. Unauthorized reproduction, distribution, or modification is prohibited. This code is subject to the terms of the Mozilla Public License 2.0.
Range Stats with Sweeps + Time Analysis + Bias - Professional range analysis with institutional-grade probability modeling.
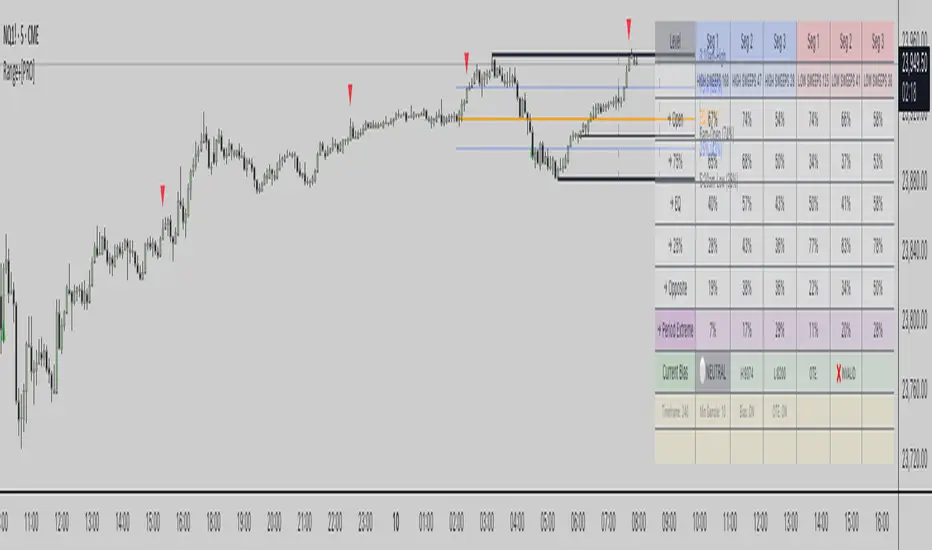
BK AK-SILENCER (P8N)🚨Introducing BK AK-SILENCER (P8N) — Institutional Order Flow Tracking for Silent Precision🚨
After months of meticulous tuning and refinement, I'm proud to unleash the next weapon in my trading arsenal—BK AK-SILENCER (P8N).
🔥 Why "AK-SILENCER"? The True Meaning
Institutions don’t announce their moves—they move silently, hidden beneath the noise. The SILENCER is built specifically to detect and track these stealth institutional maneuvers, giving you the power to hunt quietly, execute decisively, and strike precisely before the market catches on.
🔹 "AK" continues the legacy, honoring my mentor, A.K., whose teachings on discipline, precision, and clarity form the cornerstone of my trading.
🔹 "SILENCER" symbolizes the stealth aspect of institutional trading—quiet but deadly moves. This indicator equips you to silently track, expose, and capitalize on their hidden footprints.
🧠 What Exactly is BK AK-SILENCER (P8N)?
It's a next-generation Cumulative Volume Delta (CVD) tool crafted specifically for traders who hunt institutional order flow, combining adaptive volatility bands, enhanced momentum gradients, and precise divergence detection into a single deadly-accurate weapon.
Built for silent execution—tracking moves quietly and trading with lethal precision.
⚙️ Core Weapon Systems
✅ Institutional CVD Engine
→ Dynamically measures hidden volume shifts (buying/selling pressure) to reveal institutional footprints that price alone won't show.
✅ Adaptive AK-9 Bollinger Bands
→ Bollinger Bands placed around a custom CVD signal line, pinpointing exactly when institutional accumulation or distribution reaches critical extremes.
✅ Gradient Momentum Intelligence
→ Color-coded momentum gradients reveal the strength, speed, and silent intent behind institutional order flow:
🟢 Strong Bullish (aggressive buying)
🟡 Moderate Bullish (steady accumulation)
🔵 Neutral (balance)
🟠 Moderate Bearish (quiet distribution)
🔴 Strong Bearish (aggressive selling)
✅ Silent Divergence Detection
→ Instantly spots divergence between price and hidden volume—your earliest indication that institutions are stealthily reversing direction.
✅ Background Flash Alerts
→ Visually highlights institutional extremes through subtle background flashes, alerting you quietly yet powerfully when market-moving players make their silent moves.
✅ Structural & Institutional Clarity
→ Optional structural pivots, standard deviation bands, volume profile anchors, and session lines clearly identify the exact levels institutions defend or attack silently.
🛡️ Why BK AK-SILENCER (P8N) is Your Edge
🔹 Tracks Institutional Footprints—Silently identifies hidden volume signals of institutional intentions before they’re obvious.
🔹 Precision Execution—Cuts through noise, allowing you to execute silently, confidently, and precisely.
🔹 Perfect for Traders Using:
Elliott Wave
Gann Methods (Angles, Squares)
Fibonacci Time & Price
Harmonic Patterns
Market Profile & Order Flow Analysis
🎯 How to Use BK AK-SILENCER (P8N)
🔸 Institutional Reversal Hunting (Stealth Mode)
Bearish divergence + CVD breaking below lower BB → stealth short signal.
Bullish divergence + CVD breaking above upper BB → quiet, early long entry.
🔸 Momentum Confirmation (Silent Strength)
Strong bullish gradient + CVD above upper BB → follow institutional buying quietly.
Strong bearish gradient + CVD below lower BB → confidently short institutional selling.
🔸 Noise Filtering (Patience & Precision)
Neutral gradient (blue) → remain quiet, wait patiently to strike precisely when institutional activity resumes.
🔸 Structural Precision (Institutional Levels)
Optional StdDev, POC, Value Areas, Session Anchors clearly identify exact institutional defense/offense zones.
🙏 Final Thoughts
Institutions move in silence, leaving subtle footprints. BK AK-SILENCER (P8N) is your specialized weapon for tracking and hunting their quiet, decisive actions before the market reacts.
🔹 Dedicated in deep gratitude to my mentor, A.K.—whose silent wisdom shapes every line of code.
🔹 Engineered for the disciplined, quiet hunter who knows when to wait patiently and when to strike decisively.
Above all, honor and gratitude to Gd—the ultimate source of wisdom, clarity, and disciplined execution. Without Him, markets are chaos. With Him, we move silently, purposefully, and precisely.
⚡ Stay Quiet. Stay Precise. Hunt Silently.
🔥 BK AK-SILENCER (P8N) — Track the Silent Moves. Strike with Precision. 🔥
May Gd bless every silent step you take. 🙏

[FS] Time & Cycles Time & Cycles
A comprehensive trading session indicator that helps traders identify and track key market sessions and their price levels. This tool is particularly useful for forex and futures traders who need to monitor multiple trading sessions.
Key Features:
• Multiple Session Support:
- London Session
- New York Session
- Sydney Session
- Asia Session
- Customizable TBD Session
• Session Visualization:
- Clear session boxes with customizable colors
- Session labels with adjustable visibility
- Support for sessions crossing midnight
- Timezone-aware calculations
• Price Level Tracking:
- Daily High/Low levels
- Weekly High/Low levels
- Previous session High/Low levels
- Customizable history depth for each level type
• Customization Options:
- Adjustable colors for each session
- Customizable border styles
- Label visibility controls
- Timezone selection
- History level depth settings
• Technical Features:
- High-performance calculation engine
- Support for multiple timeframes
- Efficient memory usage
- Clean and intuitive visual display
Perfect for:
• Forex traders monitoring multiple sessions
• Futures traders tracking market hours
• Swing traders identifying key session levels
• Day traders planning their trading hours
• Market analysts studying session patterns
The indicator helps traders:
- Identify active trading sessions
- Track session-specific price levels
- Monitor market activity across different time zones
- Plan trades based on session boundaries
- Analyze price action within specific sessions
Note: This indicator is designed to work across all timeframes and is optimized for performance with minimal impact on chart loading times.

lib_smcLibrary "lib_smc"
This is an adaptation of LuxAlgo's Smart Money Concepts indicator with numerous changes. Main changes include integration of object based plotting, plenty of performance improvements, live tracking of Order Blocks, integration of volume profiles to refine Order Blocks, and many more.
This is a library for developers, if you want this converted into a working strategy, let me know.
buffer(item, len, force_rotate)
Parameters:
item (float)
len (int)
force_rotate (bool)
buffer(item, len, force_rotate)
Parameters:
item (int)
len (int)
force_rotate (bool)
buffer(item, len, force_rotate)
Parameters:
item (Profile type from robbatt/lib_profile/32)
len (int)
force_rotate (bool)
swings(len)
INTERNAL: detect swing points (HH and LL) in given range
Parameters:
len (simple int) : range to check for new swing points
Returns: values are the price level where and if a new HH or LL was detected, else na
method init(this)
Namespace types: OrderBlockConfig
Parameters:
this (OrderBlockConfig)
method delete(this)
Namespace types: OrderBlock
Parameters:
this (OrderBlock)
method clear_broken(this, broken_buffer)
INTERNAL: delete internal order blocks box coordinates if top/bottom is broken
Namespace types: map
Parameters:
this (map)
broken_buffer (map)
Returns: any_bull_ob_broken, any_bear_ob_broken, broken signals are true if an according order block was broken/mitigated, broken contains the broken block(s)
create_ob(id, mode, start_t, start_i, top, end_t, end_i, bottom, break_price, early_confirmation_price, config, init_plot, force_overlay)
INTERNAL: set internal order block coordinates
Parameters:
id (int)
mode (int) : 1: bullish, -1 bearish block
start_t (int)
start_i (int)
top (float)
end_t (int)
end_i (int)
bottom (float)
break_price (float)
early_confirmation_price (float)
config (OrderBlockConfig)
init_plot (bool)
force_overlay (bool)
Returns: signals are true if an according order block was broken/mitigated
method align_to_profile(block, align_edge, align_break_price)
Namespace types: OrderBlock
Parameters:
block (OrderBlock)
align_edge (bool)
align_break_price (bool)
method create_profile(block, opens, tops, bottoms, closes, values, resolution, vah_pc, val_pc, args, init_calculated, init_plot, force_overlay)
Namespace types: OrderBlock
Parameters:
block (OrderBlock)
opens (array)
tops (array)
bottoms (array)
closes (array)
values (array)
resolution (int)
vah_pc (float)
val_pc (float)
args (ProfileArgs type from robbatt/lib_profile/32)
init_calculated (bool)
init_plot (bool)
force_overlay (bool)
method create_profile(block, resolution, vah_pc, val_pc, args, init_calculated, init_plot, force_overlay)
Namespace types: OrderBlock
Parameters:
block (OrderBlock)
resolution (int)
vah_pc (float)
val_pc (float)
args (ProfileArgs type from robbatt/lib_profile/32)
init_calculated (bool)
init_plot (bool)
force_overlay (bool)
track_obs(swing_len, hh, ll, top, btm, bull_bos_alert, bull_choch_alert, bear_bos_alert, bear_choch_alert, min_block_size, max_block_size, config_bull, config_bear, init_plot, force_overlay, enabled, extend_blocks, clear_broken_buffer_before, align_edge_to_value_area, align_break_price_to_poc, profile_args_bull, profile_args_bear, use_soft_confirm, soft_confirm_offset, use_retracements_with_FVG_out)
Parameters:
swing_len (int)
hh (float)
ll (float)
top (float)
btm (float)
bull_bos_alert (bool)
bull_choch_alert (bool)
bear_bos_alert (bool)
bear_choch_alert (bool)
min_block_size (float)
max_block_size (float)
config_bull (OrderBlockConfig)
config_bear (OrderBlockConfig)
init_plot (bool)
force_overlay (bool)
enabled (bool)
extend_blocks (simple bool)
clear_broken_buffer_before (simple bool)
align_edge_to_value_area (simple bool)
align_break_price_to_poc (simple bool)
profile_args_bull (ProfileArgs type from robbatt/lib_profile/32)
profile_args_bear (ProfileArgs type from robbatt/lib_profile/32)
use_soft_confirm (simple bool)
soft_confirm_offset (float)
use_retracements_with_FVG_out (simple bool)
method draw(this, config, extend_only)
Namespace types: OrderBlock
Parameters:
this (OrderBlock)
config (OrderBlockConfig)
extend_only (bool)
method draw(blocks, config)
INTERNAL: plot order blocks
Namespace types: array
Parameters:
blocks (array)
config (OrderBlockConfig)
method draw(blocks, config)
INTERNAL: plot order blocks
Namespace types: map
Parameters:
blocks (map)
config (OrderBlockConfig)
method cleanup(this, ob_bull, ob_bear)
removes all Profiles that are older than the latest OrderBlock from this profile buffer
Namespace types: array
Parameters:
this (array type from robbatt/lib_profile/32)
ob_bull (OrderBlock)
ob_bear (OrderBlock)
_plot_swing_points(mode, x, y, show_swing_points, linecolor_swings, keep_history, show_latest_swings_levels, trail_x, trail_y, trend)
INTERNAL: plot swing points
Parameters:
mode (int) : 1: bullish, -1 bearish block
x (int) : x-coordingate of swing point to plot (bar_index)
y (float) : y-coordingate of swing point to plot (price)
show_swing_points (bool) : switch to enable/disable plotting of swing point labels
linecolor_swings (color) : color for swing point labels and lates level lines
keep_history (bool) : weater to remove older swing point labels and only keep the most recent
show_latest_swings_levels (bool)
trail_x (int) : x-coordinate for latest swing point (bar_index)
trail_y (float) : y-coordinate for latest swing point (price)
trend (int) : the current trend 1: bullish, -1: bearish, to determine Strong/Weak Low/Highs
_pivot_lvl(mode, trend, hhll_x, hhll, super_hhll, filter_insignificant_internal_breaks)
INTERNAL: detect whether a structural level has been broken and if it was in trend direction (BoS) or against trend direction (ChoCh), also track the latest high and low swing points
Parameters:
mode (simple int) : detect 1: bullish, -1 bearish pivot points
trend (int) : current trend direction
hhll_x (int) : x-coordinate of newly detected hh/ll (bar_index)
hhll (float) : y-coordinate of newly detected hh/ll (price)
super_hhll (float) : level/y-coordinate of superior hhll (if this is an internal structure pivot level)
filter_insignificant_internal_breaks (bool) : if true pivot points / internal structure will be ignored where the wick in trend direction is longer than the opposite (likely to push further in direction of main trend)
Returns: coordinates of internal structure that has been broken (x,y): start of structure, (trail_x, trail_y): tracking hh/ll after structure break, (bos_alert, choch_alert): signal whether a structural level has been broken
_plot_structure(x, y, is_bos, is_choch, line_color, line_style, label_style, label_size, keep_history)
INTERNAL: plot structural breaks (BoS/ChoCh)
Parameters:
x (int) : x-coordinate of newly broken structure (bar_index)
y (float) : y-coordinate of newly broken structure (price)
is_bos (bool) : whether this structural break was in trend direction
is_choch (bool) : whether this structural break was against trend direction
line_color (color) : color for the line connecting the structural level and the breaking candle
line_style (string) : style (line.style_dashed/solid) for the line connecting the structural level and the breaking candle
label_style (string) : style (label.style_label_down/up) for the label above/below the line connecting the structural level and the breaking candle
label_size (string) : size (size.small/tiny) for the label above/below the line connecting the structural level and the breaking candle
keep_history (bool) : weater to remove older swing point labels and only keep the most recent
structure_values(length, super_hh, super_ll, filter_insignificant_internal_breaks)
detect (and plot) structural breaks and the resulting new trend
Parameters:
length (simple int) : lookback period for swing point detection
super_hh (float) : level/y-coordinate of superior hh (for internal structure detection)
super_ll (float) : level/y-coordinate of superior ll (for internal structure detection)
filter_insignificant_internal_breaks (bool) : if true pivot points / internal structure will be ignored where the wick in trend direction is longer than the opposite (likely to push further in direction of main trend)
Returns: trend: direction 1:bullish -1:bearish, (bull_bos_alert, bull_choch_alert, top_x, top_y, trail_up_x, trail_up): whether and which level broke in a bullish direction, trailing high, (bbear_bos_alert, bear_choch_alert, tm_x, btm_y, trail_dn_x, trail_dn): same in bearish direction
structure_plot(trend, bull_bos_alert, bull_choch_alert, top_x, top_y, trail_up_x, trail_up, hh, bear_bos_alert, bear_choch_alert, btm_x, btm_y, trail_dn_x, trail_dn, ll, color_bull, color_bear, show_swing_points, show_latest_swings_levels, show_bos, show_choch, line_style, label_size, keep_history)
detect (and plot) structural breaks and the resulting new trend
Parameters:
trend (int) : crrent trend 1: bullish, -1: bearish
bull_bos_alert (bool) : if there was a bullish bos alert -> plot it
bull_choch_alert (bool) : if there was a bullish choch alert -> plot it
top_x (int) : latest shwing high x
top_y (float) : latest swing high y
trail_up_x (int) : trailing high x
trail_up (float) : trailing high y
hh (float) : if there was a higher high
bear_bos_alert (bool) : if there was a bearish bos alert -> plot it
bear_choch_alert (bool) : if there was a bearish chock alert -> plot it
btm_x (int) : latest swing low x
btm_y (float) : latest swing low y
trail_dn_x (int) : trailing low x
trail_dn (float) : trailing low y
ll (float) : if there was a lower low
color_bull (color) : color for bullish BoS/ChoCh levels
color_bear (color) : color for bearish BoS/ChoCh levels
show_swing_points (bool) : whether to plot swing point labels
show_latest_swings_levels (bool) : whether to track and plot latest swing point levels with lines
show_bos (bool) : whether to plot BoS levels
show_choch (bool) : whether to plot ChoCh levels
line_style (string) : whether to plot BoS levels
label_size (string) : label size of plotted BoS/ChoCh levels
keep_history (bool) : weater to remove older swing point labels and only keep the most recent
structure(length, color_bull, color_bear, super_hh, super_ll, filter_insignificant_internal_breaks, show_swing_points, show_latest_swings_levels, show_bos, show_choch, line_style, label_size, keep_history, enabled)
detect (and plot) structural breaks and the resulting new trend
Parameters:
length (simple int) : lookback period for swing point detection
color_bull (color) : color for bullish BoS/ChoCh levels
color_bear (color) : color for bearish BoS/ChoCh levels
super_hh (float) : level/y-coordinate of superior hh (for internal structure detection)
super_ll (float) : level/y-coordinate of superior ll (for internal structure detection)
filter_insignificant_internal_breaks (bool) : if true pivot points / internal structure will be ignored where the wick in trend direction is longer than the opposite (likely to push further in direction of main trend)
show_swing_points (bool) : whether to plot swing point labels
show_latest_swings_levels (bool) : whether to track and plot latest swing point levels with lines
show_bos (bool) : whether to plot BoS levels
show_choch (bool) : whether to plot ChoCh levels
line_style (string) : whether to plot BoS levels
label_size (string) : label size of plotted BoS/ChoCh levels
keep_history (bool) : weater to remove older swing point labels and only keep the most recent
enabled (bool)
_check_equal_level(mode, len, eq_threshold, enabled)
INTERNAL: detect equal levels (double top/bottom)
Parameters:
mode (int) : detect 1: bullish/high, -1 bearish/low pivot points
len (int) : lookback period for equal level (swing point) detection
eq_threshold (float) : maximum price offset for a level to be considered equal
enabled (bool)
Returns: eq_alert whether an equal level was detected and coordinates of the first and the second level/swing point
_plot_equal_level(show_eq, x1, y1, x2, y2, label_txt, label_style, label_size, line_color, line_style, keep_history)
INTERNAL: plot equal levels (double top/bottom)
Parameters:
show_eq (bool) : whether to plot the level or not
x1 (int) : x-coordinate of the first level / swing point
y1 (float) : y-coordinate of the first level / swing point
x2 (int) : x-coordinate of the second level / swing point
y2 (float) : y-coordinate of the second level / swing point
label_txt (string) : text for the label above/below the line connecting the equal levels
label_style (string) : style (label.style_label_down/up) for the label above/below the line connecting the equal levels
label_size (string) : size (size.tiny) for the label above/below the line connecting the equal levels
line_color (color) : color for the line connecting the equal levels (and it's label)
line_style (string) : style (line.style_dotted) for the line connecting the equal levels
keep_history (bool) : weater to remove older swing point labels and only keep the most recent
equal_levels_values(len, threshold, enabled)
detect (and plot) equal levels (double top/bottom), returns coordinates
Parameters:
len (int) : lookback period for equal level (swing point) detection
threshold (float) : maximum price offset for a level to be considered equal
enabled (bool) : whether detection is enabled
Returns: (eqh_alert, eqh_x1, eqh_y1, eqh_x2, eqh_y2) whether an equal high was detected and coordinates of the first and the second level/swing point, (eql_alert, eql_x1, eql_y1, eql_x2, eql_y2) same for equal lows
equal_levels_plot(eqh_x1, eqh_y1, eqh_x2, eqh_y2, eql_x1, eql_y1, eql_x2, eql_y2, color_eqh, color_eql, show, keep_history)
detect (and plot) equal levels (double top/bottom), returns coordinates
Parameters:
eqh_x1 (int) : coordinates of first point of equal high
eqh_y1 (float) : coordinates of first point of equal high
eqh_x2 (int) : coordinates of second point of equal high
eqh_y2 (float) : coordinates of second point of equal high
eql_x1 (int) : coordinates of first point of equal low
eql_y1 (float) : coordinates of first point of equal low
eql_x2 (int) : coordinates of second point of equal low
eql_y2 (float) : coordinates of second point of equal low
color_eqh (color) : color for the line connecting the equal highs (and it's label)
color_eql (color) : color for the line connecting the equal lows (and it's label)
show (bool) : whether plotting is enabled
keep_history (bool) : weater to remove older swing point labels and only keep the most recent
Returns: (eqh_alert, eqh_x1, eqh_y1, eqh_x2, eqh_y2) whether an equal high was detected and coordinates of the first and the second level/swing point, (eql_alert, eql_x1, eql_y1, eql_x2, eql_y2) same for equal lows
equal_levels(len, threshold, color_eqh, color_eql, enabled, show, keep_history)
detect (and plot) equal levels (double top/bottom)
Parameters:
len (int) : lookback period for equal level (swing point) detection
threshold (float) : maximum price offset for a level to be considered equal
color_eqh (color) : color for the line connecting the equal highs (and it's label)
color_eql (color) : color for the line connecting the equal lows (and it's label)
enabled (bool) : whether detection is enabled
show (bool) : whether plotting is enabled
keep_history (bool) : weater to remove older swing point labels and only keep the most recent
Returns: (eqh_alert) whether an equal high was detected, (eql_alert) same for equal lows
_detect_fvg(mode, enabled, o, h, l, c, filter_insignificant_fvgs, change_tf)
INTERNAL: detect FVG (fair value gap)
Parameters:
mode (int) : detect 1: bullish, -1 bearish gaps
enabled (bool) : whether detection is enabled
o (float) : reference source open
h (float) : reference source high
l (float) : reference source low
c (float) : reference source close
filter_insignificant_fvgs (bool) : whether to calculate and filter small/insignificant gaps
change_tf (bool) : signal when the previous reference timeframe closed, triggers new calculation
Returns: whether a new FVG was detected and its top/mid/bottom levels
_clear_broken_fvg(mode, upper_boxes, lower_boxes)
INTERNAL: clear mitigated FVGs (fair value gaps)
Parameters:
mode (int) : detect 1: bullish, -1 bearish gaps
upper_boxes (array) : array that stores the upper parts of the FVG boxes
lower_boxes (array) : array that stores the lower parts of the FVG boxes
_plot_fvg(mode, show, top, mid, btm, border_color, extend_box)
INTERNAL: plot (and clear broken) FVG (fair value gap)
Parameters:
mode (int) : plot 1: bullish, -1 bearish gap
show (bool) : whether plotting is enabled
top (float) : top level of fvg
mid (float) : center level of fvg
btm (float) : bottom level of fvg
border_color (color) : color for the FVG box
extend_box (int) : how many bars into the future the FVG box should be extended after detection
fvgs_values(o, h, l, c, filter_insignificant_fvgs, change_tf, enabled)
detect (and plot / clear broken) FVGs (fair value gaps), and return alerts and level values
Parameters:
o (float) : reference source open
h (float) : reference source high
l (float) : reference source low
c (float) : reference source close
filter_insignificant_fvgs (bool) : whether to calculate and filter small/insignificant gaps
change_tf (bool) : signal when the previous reference timeframe closed, triggers new calculation
enabled (bool) : whether detection is enabled
Returns: (bullish_fvg_alert, bull_top, bull_mid, bull_btm): whether a new bullish FVG was detected and its top/mid/bottom levels, (bearish_fvg_alert, bear_top, bear_mid, bear_btm): same for bearish FVGs
fvgs_plot(bullish_fvg_alert, bull_top, bull_mid, bull_btm, bearish_fvg_alert, bear_top, bear_mid, bear_btm, color_bull, color_bear, extend_box, show)
Parameters:
bullish_fvg_alert (bool)
bull_top (float)
bull_mid (float)
bull_btm (float)
bearish_fvg_alert (bool)
bear_top (float)
bear_mid (float)
bear_btm (float)
color_bull (color) : color for bullish FVG boxes
color_bear (color) : color for bearish FVG boxes
extend_box (int) : how many bars into the future the FVG box should be extended after detection
show (bool) : whether plotting is enabled
Returns: (bullish_fvg_alert, bull_top, bull_mid, bull_btm): whether a new bullish FVG was detected and its top/mid/bottom levels, (bearish_fvg_alert, bear_top, bear_mid, bear_btm): same for bearish FVGs
fvgs(o, h, l, c, filter_insignificant_fvgs, change_tf, color_bull, color_bear, extend_box, enabled, show)
detect (and plot / clear broken) FVGs (fair value gaps)
Parameters:
o (float) : reference source open
h (float) : reference source high
l (float) : reference source low
c (float) : reference source close
filter_insignificant_fvgs (bool) : whether to calculate and filter small/insignificant gaps
change_tf (bool) : signal when the previous reference timeframe closed, triggers new calculation
color_bull (color) : color for bullish FVG boxes
color_bear (color) : color for bearish FVG boxes
extend_box (int) : how many bars into the future the FVG box should be extended after detection
enabled (bool) : whether detection is enabled
show (bool) : whether plotting is enabled
Returns: (bullish_fvg_alert): whether a new bullish FVG was detected, (bearish_fvg_alert): same for bearish FVGs
OrderBlock
Fields:
id (series int)
dir (series int)
left_top (chart.point)
right_bottom (chart.point)
break_price (series float)
early_confirmation_price (series float)
ltf_high (array)
ltf_low (array)
ltf_volume (array)
plot (Box type from robbatt/lib_plot_objects/49)
profile (Profile type from robbatt/lib_profile/32)
trailing (series bool)
extending (series bool)
awaiting_confirmation (series bool)
touched_break_price_before_confirmation (series bool)
soft_confirmed (series bool)
has_fvg_out (series bool)
hidden (series bool)
broken (series bool)
OrderBlockConfig
Fields:
show (series bool)
show_last (series int)
show_id (series bool)
show_profile (series bool)
args (BoxArgs type from robbatt/lib_plot_objects/49)
txt (series string)
txt_args (BoxTextArgs type from robbatt/lib_plot_objects/49)
delete_when_broken (series bool)
broken_args (BoxArgs type from robbatt/lib_plot_objects/49)
broken_txt (series string)
broken_txt_args (BoxTextArgs type from robbatt/lib_plot_objects/49)
broken_profile_args (ProfileArgs type from robbatt/lib_profile/32)
use_profile (series bool)
profile_args (ProfileArgs type from robbatt/lib_profile/32)

FS Scorpion TailKey Features & Components:
1. Custom Date & Chart-Based Controls
The software allows users to define whether they want signals to start on a specific date (useSpecificDate) or base calculations on the visible chart’s range (useRelativeScreenSumLeft and useRelativeScreenSumRight).
Users can input the number of stocks to buy/sell per signal and decide whether to sell only for profit.
2. Technical Indicators Used
EMA (Exponential Moving Average): Users can define the length of the EMA and specify if buy/sell signals should occur when the EMA is rising or falling.
MACD (Moving Average Convergence Divergence): MACD crossovers, slopes of the MACD line, signal line, and histogram are used for generating buy/sell signals.
ATR (Average True Range): Signals are generated based on rising or falling ATR.
Aroon Indicator: Buy and sell signals are based on the behavior of the Aroon upper and lower lines.
RSI (Relative Strength Index): Tracks whether the RSI and its moving average are rising or falling to generate signals.
Bollinger Bands: Buy/sell signals depend on the basis, upper, and lower band behavior (rising or falling).
3. Signal Detection
The software creates arrays for each indicator to store conditions for buy/sell signals.
The allTrue() function checks whether all conditions for buy/sell signals are true, ensuring that only valid signals are plotted.
Signals are differentiated between buy-only, sell-only, and both buy and sell (dual signal).
4. Visual Indicators
Vertical Lines: When buy, sell, or dual signals are detected, vertical lines are drawn at the corresponding bar with configurable colors (green for buy, red for sell, silver for dual).
Buy/Sell Labels: Visual labels are plotted directly on the chart to denote buy or sell signals, allowing for clear interpretation of the strategy.
5. Cash Flow & Metrics Display
The software maintains an internal ledger of how many stocks are bought/sold, their prices, and whether a profit is being made.
A table is displayed at the bottom right of the chart, showing:
Initial investment
Current stocks owned
Last buy price
Market stake
Net profit
The table background turns green for profit and red for loss.
6. Dynamic Decision Making
Buy Condition: If a valid buy signal is generated, the software decrements the cash balance and adds stocks to the inventory.
Sell Condition: If the sell signal is valid (and meets the profit requirement), stocks are sold, and cash is incremented.
A fallback check ensures the sell logic prevents selling more stocks than are available and adjusts stock holding appropriately (e.g., sell half).
Customization and Usage
Indicator Adjustments: The user can choose which indicators to activate (e.g., EMA, MACD, RSI) via input controls. Each indicator has specific customizable parameters such as lengths, slopes, and conditions.
Signal Flexibility: The user can adjust conditions for buying and selling based on various technical indicators, which adds flexibility in implementing trading strategies. For example, users may require the RSI to be higher than its moving average or trigger sales only when MACD crosses under the signal line.
Profit Sensitivity: The software allows the option to sell only when a profit is assured by checking if the current price is higher than the last buy price.
Summary of Usage:
Indicator Selection: Enable or disable technical indicators like EMA, MACD, RSI, Aroon, ATR, and Bollinger Bands to fit your trading strategy.
Custom Date/Chart Settings: Choose whether to calculate based on specific time ranges or visible portions of the chart.
Dynamic Signal Plotting: Once buy or sell conditions are met, the software will visually plot signals on your chart, giving clear entry and exit points.
Investment Tracking: Real-time tracking of stock quantities, investments, and profit ensures a clear view of your trading performance.
Backtesting: Use this software for backtesting your strategy by analyzing how buy and sell signals would have performed historically based on the chosen indicators.
Conclusion
The FS Scorpion Tail software is a robust and flexible trading tool, allowing traders to develop custom strategies based on multiple well-known technical indicators. Its visual aid, coupled with real-time investment tracking, makes it valuable for systematic traders looking to automate or refine their trading approach.

Price GapsScript is tracking price gaps on stock or idexes that are not continuosly traded. Usually, such gaps are filled fairly quickly.
This script finds and trace price gaps.
Script settings:
PRICE GAP SCANNER
Intraday gaps - For intervals shorter than a day we can incluse od exclude gaps on bars during traiding day.
Track gaps (limited) - Gaps tracking limited to few bars. Full tracking available in PRO version.
Active - Background color for Active gap visualization
Filled - Background color for Filled gap visualization
ALERTS - ANY ALERT() FUNCTION CALL
Open gap: - Sending alert when new gap appers.
- $ - Sending in message cash value of the gap
- % - Sending in message percent value of the gap
Close gap - Sending alert when gap was filled.
Stats
Table - Type of table with statistics shown on the screen:
H(idden) - Do not show any statistics
B(ase) - Basic statistics about filling gaps
A(ctive) - List of not filled gaps
F(illed) - List of filled gaps
Offset - Starting index for Active/Filled list
Count - Number of shown rows for Active/Filled list.
Options available in PRO versions
Set alarms to be notified about:
- New gap that appeared, with $ or % value in the message
- Filling of a gap.
- Shows how often the gaps are filled on the same trading day and in the longer term.
- Calculating all the stats
- Full gaps tracking: making gaps smaller when they are parcial filled, hiding filled gaps.

Auto Harmonic Projection - Ultimate [Trendoscope]Hello traders, Many who used Auto Harmonic Pattern - Ultimate had enquired with me about having option to project PRZ before patterns formed. We always replied that it is in pipeline but will not be part of existing script. Finally, we decided to utilise part of our Christmas and new year break to make it happen.
Lets get started..
⬜ Process
▶ Unlike Auto Harmonic Patterns Ultimate, instead of scanning whole XABCD for harmonic pattern, this script only collects XABC and projects PRZs (Possible D zones)
▶ Once possible patterns are found, lines are drawn to connect XABC and boxes to project PRZs. There can be more than 1 PRZs for XABC combination. If PRZs of multiple patterns overlap, they are joined and shown as single PRZ where all patterns are listed against it.
▶ If price crosses C, pattern is considered as failed. If price stays between C and PRZs for long time, patterns are timed out. In either case, patterns and projections are removed from chart.
▶ Pattern is considered to be active once price reach B. Until then Pattern is inactive.
▶ PRZs are tracked individually even if they belong to same pattern. PRZ is considered active only if price hits PRZ and completes the pattern. Till then PRZ is considered inactive.
▶ After activating, PRZs can either reach successful level if price moves in reversal direction. Or it can reach failure if price reaches stop.
▶ PRZs are removed from chart once it either reaches stop or success level. But, if more PRZs are present for pattern, pattern will still be there on chart.
▶ Pattern is kept active till all the PRZs are either hit stop or success or pattern itself is either failed or timed out.
Note:
Whenever we refer pattern - consider it as lines joining X, A, B, C and D if PRZ is active.
Wherever we refer PRZ - consider it as box representing potential reversal zones.
⬜ Screen components
▶ Inactive Patterns and PRZ - Patterns with inactive PRZs are represented as lines joining XABC. There will not be line connecting D and PRZs are shown with faded colour and smaller fonts.
▶ Active Patterns and PRZ - Patterns with active PRZ are represented with full pattern and line fills. PRZ will also show stop and success level. Note that success level is not target level - but a position used for validating the outcome.
▶ Stats table - Open stats table contains patterns and corresponding PRZ levels. Stats will have red background for bearish patterns/projections and green background for bullish patterns/projections. Content text colour is matched with that of PRZ and Pattern line colors so that users can identify the matching stats easily.
▶ Run timer - Tells how long the script backtest is running. Run timer will have red background for TRIAL access or if right access key is not used. Otherwise, it will have green background colour. This does not have much significance now as there are no closed stats available. It will be added in the future versions.
▶ Watermark - Watermark appears only if valid key is not used or TRIAL access key is used.
Bit more details about open stats table here
⬜ Settings
⚪ Alert Key
Alert key is given for active subscribers. This key is required in order to set alerts or in order to run the script for more than 30 bars on single instrument without interruption. Not having alert key will not stop users from using the indicator once they acquire access - but it will only limit few capabilities. Key is not given for trial access.
Key is prompted every time users add indicator to chart. If you are provided with key, please use it instead of the TRIAL access key.
If you are using valid key,
You will see run timer in green instead of red background
No TRIAL ACCESS watermark on the chart.
⚪ Zigzag and pattern detection settings
⚪ Pattern Selection settings
⚪ Stats and Display
⚪ Colors and themes
⚪ Backtest Settings
Not important for now as there are no closed pattern stats. Kept for future usage. Will impact the timer widget.
⚪ Alerts
▶ Types and settings
▶Setting alerts is simple. When indicator is loaded on chart (Make sure you are using the right alert key), goto alerts and select the AHProjection from Condition dropdown. Update other parameters such as alert name, webhook details as required and press create
▶ Examples of alerts
⬜ Status Tracking
Script tracks two types of statuses.
⚪ Harmonic Pattern Projection Status : Tracks projection as a whole for each combination of X, A, B, C. Different states available are
Awaiting Activation : Any pattern projection when formed by default goes into Inactive State and hence set to Awaiting Activation.
Projection Active : Once price reach B, then pattern projection is considered active
Entry Reached : Once price reach the nearest PRZ level, it is considered as Entry reached. Status will remain as entry reached even if PRZ is removed and next PRZ level is yet to be reached.
Projection Invalidated : If price goes beyond C level, then pattern projection is considered invalidated. It can happen at any stage and even after successful completion of few PRZ ranges.
Projection Timed Out : If price keeps between PRZ and C for considerable time, it will timed out and removed from chart.
⚪ Harmonic Pattern Projection PRZ Status Tracks individual PRZs separately which may or may not belong to same patterns. Different states available are
Awaiting Activation : Any PRZ is considered inactive before price reaching the PRZ level.
Active : Once price reaches PRZ, it will become active. Active PRZs are highlighted with line fill on chart. Active PRZ also display success and stop levels. PRZ is not removed unless price hits one of these levels or the entire pattern is timed out.
Successful : If an active PRZ price reaches success level, then PRZ projection is considered successful. Once successful, PRZ will removed from chart
Failed : If an active PRZ price reaches stop level, then PRZ projection is considered failure. Once failed PRZ will be removed from chart.
סקריפט בתשלום
OXE MTF Support/Resistance+Demand/Supply Zone ArsenalOXE MTF Support/Resistance + Demand/Supply Zones Indicator
Your Complete Multi-Timeframe Zone Arsenal
This professional-grade indicator transforms your chart into a zone confluence powerhouse, simultaneously tracking high-probability price reaction areas across 5 timeframes (Daily, H4, H1, M15, M5) – giving you the institutional edge you need to dominate the markets.
🎯 What It Is
A sophisticated dual-system zone detector that identifies both:
Classic Support/Resistance levels using pivot point detection
Smart Money Demand/Supply zones triggered by Break-of-Structure (BOS) confirmations
Unlike basic S/R indicators, this tool employs institutional methodology – capturing order blocks and imbalance zones where smart money is positioned, not just where price bounced.
⚡ Core Capabilities
Multi-Timeframe Mastery
Track up to 5 timeframes simultaneously without switching charts
Identify confluence zones where multiple timeframe levels align
Customize which timeframes to display for clean, focused analysis
Intelligent Zone Management
Automatic zone validation – tracks when zones flip from resistance→support or supply→demand
Invalid zone filtering – hide broken/invalidated zones to focus only on active opportunities
Configurable zone limits – control the number of zones per timeframe (up to 8 each)
Smart Money Detection
BOS-confirmed zones – only marks demand/supply after break-of-structure confirmation
Precise zone timing – captures the exact candle that created the imbalance
Visual differentiation – dashed borders distinguish demand/supply from traditional S/R
Professional Dashboard
Real-time zone counter – shows active zones per timeframe at a glance
Filter status indicators – tracks which validation filters are enabled
Color-coded timeframe labels – instant visual organization
💰 How This Transforms Your Trading
1. Find High-Probability Entries
Enter trades at zones where multiple timeframes converge – when H4 demand aligns with Daily support, you've found institutional backing.
2. Stay on the Right Side of the Market
The zone flipping system shows you when market structure changes – a supply zone that flips to demand tells you the narrative has shifted bullish.
3. Eliminate Guesswork
No more wondering "is this level still valid?" The automatic invalidation tracking removes subjectivity – zones are either active (tradeable) or broken (ignored).
4. Scale Your Timeframe Analysis
Whether you're scalping M5 or swing trading Daily, access all relevant zones without the mental overhead of switching between charts and manually tracking levels.
5. Trade Like Institutions
By combining pivot-based S/R with BOS-confirmed order blocks, you're seeing where retail AND institutional money is positioned – giving you the complete picture.
🔥 Perfect For
Day traders seeking M15/H1 confluence for precise entries
Scalpers needing M5 zones with higher-timeframe confirmation
Swing traders looking for Daily/H4 zone alignment for position trades
ICT/SMC practitioners combining order blocks with traditional analysis
Any trader who values clean, validated, multi-timeframe zones over cluttered charts

CISD by tncylyvCISD (Change in State of Delivery) by tncylyv
The CISD (Change in State of Delivery) indicator is a precision price action tool designed to help traders identify key reversal points based on ICT concepts. Unlike standard support and resistance indicators, this script tracks the specific algorithmic opening prices responsible for the current delivery state and highlights when that state has been invalidated.
🧠 What is CISD?
Change in State of Delivery refers to the moment price shifts from a Buy Program to a Sell Program (or vice versa).
• Bearish CISD (-CISD): Occurs when price closes below the opening price of the up-candle sequence that created the most recent High.
• Bullish CISD (+CISD): Occurs when price closes above the opening price of the down-candle sequence that created the most recent Low.
This indicator automates the identification of these levels, tracking the "Active" reference price in real-time and marking historical reversals.
🚀 Key Features
1. Continuous Active Level Tracking:
o The indicator plots a continuous, stepped line (The "Active CISD") that follows the market structure. As the market expands (makes new highs or lows), the line updates to the new valid reference point.
o This allows you to see the current invalidation level at a glance without cluttering the chart with old lines.
2. Triggered Reversal Lines:
o When a candle closes beyond the Active CISD level, a "Triggered" line is drawn to mark the exact price and location of the reversal.
o These lines serve as excellent historical references for potential Order Blocks or Breakers later in time.
3. Smart Filtering:
o You can choose to display Both Bullish and Bearish setups, or filter to see Bullish Only or Bearish Only. This is ideal for traders who have a specific daily bias and want to remove noise from the chart.
4. Clean & Customizable:
o Fully customizable colors for Bullish and Bearish events.
o Options to toggle Labels, adjust Line Width, and change Line Styles (Solid, Dashed, Dotted).
o "No Continuation" Logic: This version focuses purely on major reversals (Change in State) rather than minor pullbacks, keeping your chart clean.
⚙️ Settings Guide
• Show Active CISD Level: Toggles the continuous stepped line representing the current threshold for a reversal.
• Triggered CISD Display: Choose between Both, Bullish Only, Bearish Only, or None. This controls the historical lines left behind after a reversal occurs.
• Visual Settings: Adjust line width, label sizes, and font styles to match your chart aesthetic.
• Colors: Customize the Shrek Mode (Bullish) and Blood Bath (Bearish) colors.
⚠️ A Note for Developers
This indicator is open source! If you are a Pine Script developer, feel free to check the source code. I’ve utilized some... creative variable naming conventions to make the coding experience more entertaining. Enjoy the read!
________________________________________
Risk Disclaimer: This tool is for educational purposes and market analysis. It does not guarantee future performance. Always manage your risk.

ES 30 Second Opening RangeOverview
Tracks opening ranges across three global futures sessions (RTH, Globex, Europe) using 30-second precision sampling. Provides high/low/mid levels, 15-point projection intervals, and breakout detection for range-based trading.
What Makes This Unique
30-Second Precision: Uses request.security_lower_tf() to sample the first 30 seconds of each session, capturing exact opening range high/low rather than relying on larger timeframe bars.
Multi-Session Tracking: Simultaneously monitors RTH (8:30 AM CT), Globex (5:00 PM CT), and Europe (2:00 AM CT) opening ranges with independent calculations for 24-hour futures coverage.
15-Point Projections: RTH-specific feature plots 5 extension levels above/below opening range at 15-point intervals (+15, +30, +45, +60, +75). Calibrated for ES futures point movement.
Adjustable Scalp Levels: Customizable +/- point lines from RTH range (default 4 points) for precise entry/exit management.
How It Works
Opening Range Calculation:
Session detection: hour(time, "America/Chicago") + minute(time) * 0.01
30s data request: request.security_lower_tf(syminfo.tickerid, "30S", high/low)
Range capture: ta.valuewhen(session_time == start_time AND second == 0, array.get(data, 0), 0)
Midpoint: (high + low) / 2
At each session start, the indicator captures the first 30-second bar's high and low, then plots these as persistent levels throughout the session.
15-Point Intervals (RTH only):
Level_up = RTH_high + (15 × n) where n = 1,2,3,4,5
Level_down = RTH_low - (15 × n)
Breakout Detection:
Break_up = ta.crossover(close, session_high)
Break_down = ta.crossunder(close, session_low)
Statistics:
Range width = session_high - session_low (displayed in table)
How to Use
Session-Based Levels: Each session's opening range represents institutional price discovery. Use as dynamic support/resistance throughout the day.
Breakout Trading: Visual signals mark opening range breakouts. Narrow ranges (<10 points ES) often precede larger moves.
15-Point Targets: After RTH breakout, use 15-point intervals as profit targets. Example: after +15 hit, next target is +30.
Gap Analysis: Compare overnight sessions to RTH. Gaps often fill toward RTH opening range.
Scalping: Adjustable point offset provides tight profit targets from range boundaries.
Key Settings
Session Toggles: Enable/disable RTH, Globex, Europe individually
15-Point Lines: RTH-only, off by default. Shows 5 levels above/below OR at 15-point intervals
Point Offset (4.0): Adjustable for tighter (2-3) or wider (6-8) scalp levels
Range Boxes: Optional visual highlighting with adjustable transparency
Statistics Table: Shows session high, low, range width
Why Protected Source
The 30-second data aggregation using request.security_lower_tf() with time-based session detection, 15-point interval projection system calibrated for ES futures, and multi-session concurrent tracking represent proprietary implementation methods.
Important Disclaimers
Not Financial Advice. Educational tool only.
Instrument Specific. 15-point intervals optimized for ES futures. Other instruments may need different sizes.
Session Accuracy. Captures first 30 seconds only. Data gaps or late opens may affect accuracy.
Historical Limitations. Opening range effectiveness varies by market regime and volatility.
Always use proper risk management. This provides reference levels, not trade signals.

Opening Range Breakout with Multi-Timeframe Liquidity]═══════════════════════════════════════
OPENING RANGE BREAKOUT WITH MULTI-TIMEFRAME LIQUIDITY
═══════════════════════════════════════
A professional Opening Range Breakout (ORB) indicator enhanced with multi-timeframe liquidity detection, trading session visualization, volume analysis, and trend confirmation tools. Designed for intraday trading with comprehensive alert system.
───────────────────────────────────────
WHAT THIS INDICATOR DOES
───────────────────────────────────────
This indicator combines multiple trading concepts:
- Opening Range Breakout (ORB) - Customizable time period detection with automatic high/low identification
- Multi-Timeframe Liquidity - HTF (Higher Timeframe) and LTF (Lower Timeframe) key level detection
- Trading Sessions - Tokyo, London, New York, and Sydney session visualization
- Volume Analysis - Volume spike detection and strength measurement
- Multi-Timeframe Confirmation - Trend bias from higher timeframes
- EMA Integration - Trend filter and dynamic support/resistance
- Smart Alerts - Quality-filtered breakout notifications
───────────────────────────────────────
HOW IT WORKS
───────────────────────────────────────
OPENING RANGE BREAKOUT (ORB):
Concept:
The Opening Range is a period at the start of a trading session where price establishes an initial high and low. Breakouts beyond this range often indicate the direction of the day's trend.
Detection Method:
- Default: 15-minute opening range (configurable)
- Custom Range: Set specific session times with timezone support
- Automatically identifies ORH (Opening Range High) and ORL (Opening Range Low)
- Tracks ORB mid-point for reference
Range Establishment:
1. Session starts (or custom time begins)
2. Tracks highest high and lowest low during the period
3. Range confirmed at end of opening period
4. Levels extend throughout the session
Breakout Detection:
- Bullish Breakout: Close above ORH
- Bearish Breakout: Close below ORL
- Mid-point acts as bias indicator
Visual Display:
- Shaded box during range formation
- Horizontal lines for ORH, ORL, and mid-point
- Labels showing level values
- Color-coded fills based on selected method
Fill Color Methods:
1. Session Comparison:
- Green: Current OR mid > Previous OR mid
- Red: Current OR mid < Previous OR mid
- Gray: Equal or first session
- Shows day-over-day momentum
2. Breakout Direction (Recommended):
- Green: Price currently above ORH (bullish breakout)
- Red: Price currently below ORL (bearish breakout)
- Gray: Price inside range (no breakout)
- Real-time breakout status
MULTI-TIMEFRAME LIQUIDITY:
Two-Tier System for comprehensive level identification:
HTF (Higher Timeframe) Key Liquidity:
- Default: 4H timeframe (configurable to Daily, Weekly)
- Identifies major institutional levels
- Uses pivot detection with adjustable parameters
- Suitable for swing highs/lows where large orders rest
LTF (Lower Timeframe) Key Liquidity:
- Default: 1H timeframe (configurable)
- Provides precision entry/exit levels
- Finer granularity for intraday trading
- Captures minor swing points
Calculation Method:
- Pivot high/low detection algorithm
- Configurable left bars (lookback) and right bars (confirmation)
- Timeframe multiplier for accurate multi-timeframe detection
- Automatic level extension
Mitigation System:
- Tracks when levels are swept (broken)
- Configurable mitigation type: Wick or Close-based
- Option to remove or show mitigated levels
- Display limit prevents chart clutter
Asset-Specific Optimization:
The indicator includes quick reference settings for different assets:
- Major Forex (EUR/USD, GBP/USD): Default settings optimal
- Crypto (BTC/ETH): Left=12, Right=4, Display=7
- Gold: HTF=1D, Left=20
TRADING SESSIONS:
Four Major Sessions with Full Customization:
Tokyo Session:
- Default: 04:00-13:00 UTC+4
- Asian trading hours
- Often sets daily range
London Session:
- Default: 11:00-20:00 UTC+4
- Highest liquidity period
- Major institutional activity
New York Session:
- Default: 16:00-01:00 UTC+4
- US market hours
- High-impact news events
Sydney Session:
- Default: 01:00-10:00 UTC+4
- Earliest Asian activity
- Lower volatility
Session Features:
- Shaded background boxes
- Session name labels
- Optional open/close lines
- Session high/low tracking with colored lines
- Each session has independent color settings
- Fully customizable times and timezones
VOLUME ANALYSIS:
Volume-Based Trade Confirmation:
Volume MA:
- Configurable period (default: 20)
- Establishes average volume baseline
- Used for spike detection
Volume Spike Detection:
- Identifies when volume exceeds MA * multiplier
- Default: 1.5x average volume
- Confirms breakout strength
Volume Strength Measurement:
- Calculates current volume as percentage of average
- Shows relative volume intensity
- Used in alert quality filtering
High Volume Bars:
- Identifies bars above 50th percentile
- Additional confirmation layer
- Indicates institutional participation
MULTI-TIMEFRAME CONFIRMATION:
Trend Bias from Higher Timeframes:
HTF 1 (Trend):
- Default: 1H timeframe
- Uses EMA to determine intermediate trend
- Compares current timeframe EMA to HTF EMA
HTF 2 (Bias):
- Default: 4H timeframe
- Uses 50 EMA for longer-term bias
- Confirms overall market direction
Bias Classifications:
- Bullish Bias: HTF close > HTF 50 EMA AND Current EMA > HTF1 EMA
- Bearish Bias: HTF close < HTF 50 EMA AND Current EMA < HTF1 EMA
- Neutral Bias: Mixed signals between timeframes
EMA Stack Analysis:
- Compares EMA alignment across timeframes
- +1: Bullish stack (lower TF EMA > higher TF EMA)
- -1: Bearish stack (lower TF EMA < higher TF EMA)
- 0: Neutral/crossed
Usage:
- Filters false breakouts
- Confirms trend direction
- Improves trade quality
EMA INTEGRATION:
Dynamic EMA for Trend Reference:
Features:
- Configurable period (default: 20)
- Customizable color and width
- Acts as dynamic support/resistance
- Trend filter for ORB trades
Application:
- Above EMA: Favor long breakouts
- Below EMA: Favor short breakouts
- EMA cross: Potential trend change
- Distance from EMA: Momentum gauge
SMART ALERT SYSTEM:
Quality-Filtered Breakout Notifications:
Alert Types:
1. Standard ORB Breakout
2. High Quality ORB Breakout
Quality Criteria:
- Volume Confirmation: Volume > 1.2x average
- MTF Confirmation: Bias aligned with breakout direction
Standard Alert:
- Basic breakout detection
- Price crosses ORH or ORL
- Icon: 🚀 (bullish) or 🔻 (bearish)
High Quality Alert:
- Both volume AND MTF confirmed
- Stronger probability setup
- Icon: 🚀⭐ (bullish) or 🔻⭐ (bearish)
Alert Information Includes:
- Alert quality rating
- Breakout level and current price
- Volume strength percentage (if enabled)
- MTF bias status (if enabled)
- Recommended action
One Alert Per Bar:
- Prevents alert spam
- Uses flag system to track sent alerts
- Resets on new ORB session
───────────────────────────────────────
HOW TO USE
───────────────────────────────────────
OPENING RANGE SETUP:
Basic Configuration:
1. Select time period for opening range (default: 15 minutes)
2. Choose fill color method (Breakout Direction recommended)
3. Enable historical data display if needed
Custom Range (Advanced):
1. Enable Custom Range toggle
2. Set specific session time (e.g., 0930-0945)
3. Select appropriate timezone
4. Useful for specific market opens (NYSE, LSE, etc.)
LIQUIDITY LEVELS SETUP:
Quick Configuration by Asset:
- Forex: Use default settings (Left=15, Right=5)
- Crypto: Set Left=12, Right=4, Display=7
- Gold: Set HTF=1D, Left=20
HTF Liquidity:
- Purpose: Major support/resistance levels
- Recommended: 4H for day trading, 1D for swing trading
- Use as profit targets or reversal zones
LTF Liquidity:
- Purpose: Entry/exit refinement
- Recommended: 1H for day trading, 4H for swing trading
- Use for position management
Mitigation Settings:
- Wick-based: More sensitive (default)
- Close-based: More conservative
- Remove or Show mitigated levels based on preference
TRADING SESSIONS SETUP:
Enable/Disable Sessions:
- Master toggle for all sessions
- Individual session controls
- Show/hide session names
Session High/Low Lines:
- Enable to see session extremes
- Each session has custom colors
- Useful for range trading
Customization:
- Adjust session times for your broker
- Set timezone to match your location
- Customize colors for visibility
VOLUME ANALYSIS SETUP:
Enable Volume Analysis:
1. Toggle on Volume Analysis
2. Set MA length (20 recommended)
3. Adjust spike multiplier (1.5 typical)
Usage:
- Confirm breakouts with volume
- Identify climactic moves
- Filter false signals
MULTI-TIMEFRAME SETUP:
HTF Selection:
- HTF 1 (Trend): 1H for day trading, 4H for swing
- HTF 2 (Bias): 4H for day trading, 1D for swing
Interpretation:
- Trade only with bias alignment
- Neutral bias: Be cautious
- Bias changes: Potential reversals
EMA SETUP:
Configuration:
- Period: 20 for responsive, 50 for smoother
- Color: Choose contrasting color
- Width: 1-2 for visibility
Usage:
- Filter trades: Long above, Short below
- Dynamic support/resistance reference
- Trend confirmation
ALERT SETUP:
TradingView Alert Creation:
1. Enable alerts in indicator settings
2. Enable ORB Breakout Alerts
3. Right-click chart → Add Alert
4. Select this indicator
5. Choose "Any alert() function call"
6. Configure delivery method (mobile, email, webhook)
Alert Filtering:
- All alerts include quality rating
- High Quality alerts = Volume + MTF confirmed
- Standard alerts = Basic breakout only
───────────────────────────────────────
TRADING STRATEGIES
───────────────────────────────────────
CLASSIC ORB STRATEGY:
Setup:
1. Wait for opening range to complete
2. Price breaks and closes above ORH or below ORL
3. Volume > average (if enabled)
4. MTF bias aligned (if enabled)
Entry:
- Bullish: Buy on break above ORH
- Bearish: Sell on break below ORL
- Consider retest entries for better risk/reward
Stop Loss:
- Bullish: Below ORL or range mid-point
- Bearish: Above ORH or range mid-point
- Adjust based on volatility
Targets:
- Initial: Range width extension (ORH + range width)
- Secondary: HTF liquidity levels
- Final: Session high/low or major support/resistance
ORB + LIQUIDITY CONFLUENCE:
Enhanced Setup:
1. Opening range established
2. HTF liquidity level near or beyond ORH/ORL
3. Breakout occurs with volume
4. Price targets the liquidity level
Entry:
- Enter on ORB breakout
- Target the HTF liquidity level
- Use LTF liquidity for position management
Management:
- Partial profits at ORB + range width
- Move stop to breakeven at LTF liquidity
- Final exit at HTF liquidity sweep
ORB REJECTION STRATEGY (Counter-Trend):
Setup:
1. Price breaks above ORH or below ORL
2. Weak volume (below average)
3. MTF bias opposite to breakout
4. Price closes back inside range
Entry:
- Failed bullish break: Short below ORH
- Failed bearish break: Long above ORL
Stop Loss:
- Beyond the failed breakout level
- Or beyond session extreme
Target:
- Opposite end of opening range
- Range mid-point for partial profit
SESSION-BASED ORB TRADING:
Tokyo Session:
- Typically narrower ranges
- Good for range trading
- Wait for London open breakout
London Session:
- Highest volume and volatility
- Strong ORB setups
- Major liquidity sweeps common
New York Session:
- Strong trending moves
- News-driven volatility
- Good for momentum trades
Sydney Session:
- Quieter conditions
- Suitable for range strategies
- Sets up Tokyo session
EMA-FILTERED ORB:
Rules:
- Only take bullish breaks if price > EMA
- Only take bearish breaks if price < EMA
- Ignore counter-trend breaks
Benefits:
- Reduces false signals
- Aligns with larger trend
- Improves win rate
───────────────────────────────────────
CONFIGURATION GUIDE
───────────────────────────────────────
OPENING RANGE SETTINGS:
Time Period:
- 15 min: Standard for most markets
- 30 min: Wider range, fewer breakouts
- 60 min: For slower markets or swing trades
Custom Range:
- Use for specific market opens
- NYSE: 0930-1000 EST
- LSE: 0800-0830 GMT
- Set timezone to match exchange
Historical Display:
- Enable: See all previous session data
- Disable: Cleaner chart, current session only
LIQUIDITY SETTINGS:
Left Bars (5-30):
- Lower: More frequent, sensitive levels
- Higher: Fewer, more significant levels
- Recommended: 15 for most markets
Right Bars (1-25):
- Confirmation period
- Higher: More reliable, less frequent
- Recommended: 5 for balance
Display Limit (1-20):
- Number of active levels shown
- Higher: More context, busier chart
- Recommended: 7 for clarity
Extension Options:
- Short: Levels visible near formation
- Current: Extended to current bar (recommended)
- Max: Extended indefinitely
VOLUME SETTINGS:
MA Length (5-50):
- Shorter: More responsive to spikes
- Longer: Smoother baseline
- Recommended: 20 for balance
Spike Multiplier (1.0-3.0):
- Lower: More sensitive spike detection
- Higher: Only extreme spikes
- Recommended: 1.5 for day trading
MULTI-TIMEFRAME SETTINGS:
HTF 1 (Trend):
- 5m chart: Use 15m or 1H
- 15m chart: Use 1H or 4H
- 1H chart: Use 4H or 1D
HTF 2 (Bias):
- One level higher than HTF 1
- Provides longer-term context
- Don't use same as HTF 1
EMA SETTINGS:
Length:
- 20: Responsive, more signals
- 50: Smoother, stronger filter
- 200: Long-term trend only
Style:
- Choose contrasting color
- Width 1-2 for visibility
- Match your trading style
───────────────────────────────────────
BEST PRACTICES
───────────────────────────────────────
Chart Timeframe Selection:
- ORB Trading: Use 5m or 15m charts
- Session Review: Use 1H or 4H charts
- Swing Trading: Use 1H or 4H charts
Quality Over Quantity:
- Wait for high-quality alerts (volume + MTF)
- Avoid trading every breakout
- Focus on confluence setups
Risk Management:
- Position size based on range width
- Wider ranges = smaller positions
- Use stop losses always
- Take partial profits at targets
Market Conditions:
- Best results in trending markets
- Reduce position size in choppy conditions
- Consider session overlaps for volatility
- Avoid trading near major news if inexperienced
Continuous Improvement:
- Track win rate by session
- Note which confluence factors work best
- Adjust settings based on market volatility
- Review performance weekly
───────────────────────────────────────
PERFORMANCE OPTIMIZATION
───────────────────────────────────────
This indicator is optimized with:
- max_bars_back declarations for efficient processing
- Conditional calculations based on enabled features
- Proper memory management for drawing objects
- Minimal recalculation on each bar
Best Practices:
- Disable unused features (sessions, MTF, volume)
- Limit historical display to reduce rendering
- Use appropriate timeframe for your strategy
- Clear old drawing objects periodically
───────────────────────────────────────
EDUCATIONAL DISCLAIMER
───────────────────────────────────────
This indicator combines established trading concepts:
- Opening Range Breakout theory (price action)
- Liquidity level detection (pivot analysis)
- Session-based trading (time-of-day patterns)
- Volume analysis (confirmation technique)
- Multi-timeframe analysis (trend alignment)
All calculations use standard technical analysis methods:
- Pivot high/low detection algorithms
- Moving averages for trend and volume
- Session time filtering
- Timeframe security functions
The indicator identifies potential trading setups but does not predict future price movements. Success requires proper application within a complete trading strategy including risk management, position sizing, and market context.
───────────────────────────────────────
USAGE DISCLAIMER
───────────────────────────────────────
This tool is for educational and analytical purposes. Opening Range Breakout trading involves substantial risk. The alert system and quality filters are designed to identify potential setups but do not guarantee profitability. Always conduct independent analysis, use proper risk management, and never risk capital you cannot afford to lose. Past performance does not indicate future results. Trading intraday breakouts requires experience and discipline.
───────────────────────────────────────
CREDITS & ATTRIBUTION
───────────────────────────────────────
ORIGINAL SOURCE:
This indicator builds upon concepts from LuxAlgo's-ORB

Market SessionsMarket Sessions (Asian, London, NY, Pacific)
Summary
This indicator plots the main global market sessions (Asian, European, American, Pacific) as boxes on your chart, complete with dynamic high/low tracking.
It's an essential tool for intraday traders to track session-based volatility patterns and visualize key support/resistance levels (like the Asian Range) that often define price action for the rest of the day.
Who it’s for
Intraday traders, scalpers, and day traders who need to visualize market hours and session-based ranges. If your strategy depends on the London open, the New York close, or the Asian range, this script will map it out for you.
What it shows
Customizable Session Boxes: Four fully configurable boxes for the Asian, European (London), American (New York), and Pacific (Sydney) sessions.
Session High & Low: The script tracks and boxes the highest high and lowest low of each session, dynamically updating as the session progresses.
Session Labels: Clear labels (e.g., "AS", "EU") mark each session, anchored to the start time.
Key Features
Powerful Timezone Control: This is the core feature.
Use Exchange Timezone (Default): Simply enter session times (e.g., 8:00 for London) relative to the exchange's timezone (e.g., "NASDAQ" or "BINANCE").
Use UTC Offset: Uncheck the box and enter a UTC offset (e.g., +3 or -5). Now, all session times you enter are relative to that specific UTC offset. This gives you full control regardless of the chart you're on.
Fully Customizable: Toggle any session on/off.
Style Control: Change the fill color, border color, transparency, border width, and line style (Solid, Dashed, Dotted) for each session individually.
Smart Labels: Labels stay anchored to the start of the session (no "sliding") and float just above the session high.
Why this helps
Track Volatility & Market Behavior: Visually identify the "personality" of each session. Some sessions might consistently produce powerful pumps or dumps, while others are prone to sideways "chop" or accumulation. This indicator helps you see these repeating patterns.
Find Key Support/Resistance Levels: The High and Low of a session (e.g., the Asian Range) often become critical support and resistance levels for the next session (e.g., London). This script makes it easy to spot these "session-to-session" S/R flips and reactions.
Aid Statistical Analysis: The script provides the core visual data for your statistical research. You can easily track how often the London session breaks the Asian high, or which session is most likely to reverse the trend, helping you build a robust trading plan.
Context is King: Instantly see which market is active, which are overlapping (like the high-volume London-NY overlap), and which have closed.
Quick setup
Go to Timezone Settings.
Decide how you want to enter times:
Easy (Default): Leave Use Exchange Timezone checked. Enter session times based on the chart's native exchange (e.g., for BTC/USDT on Binance, use UTC+0 times).
Manual (Pro): Uncheck Use Exchange Timezone. Enter your UTC Offset (e.g., +2 for Berlin). Now, enter all session times as they appear on the clock in Berlin.
Go to each session tab (Asian, European...) to enable/disable it and set the correct start/end hours and minutes.
Style the colors to match your chart theme.
Disclaimer
For educational/informational purposes only; not financial advice. Trading involves risk—manage it responsibly.

ICT Multi-Timeframe FVG & Order Flow SuiteICT Multi-Timeframe FVG & Order Flow Suite
A comprehensive Inner Circle Trader (ICT) analysis tool that combines multiple timeframes, Fair Value Gap detection, order flow tracking, and smart money concepts into one powerful indicator.
🎯 Key Features
Higher Timeframe FVG Detection
Simultaneously tracks FVGs across 4H, Daily, Weekly, and Monthly timeframes
Visual differentiation between active and mitigated HTF FVGs
BAG (Breaker And Gap) identification
Intelligent filtering system to align with HTF bias
Real-time status table showing current HTF FVG states
Current Timeframe Analysis
Automatic bullish/bearish FVG detection
2CR (2 Candle Reversal) tracking with visual markers
Mitigation monitoring with color-coded states
Customizable display limits and filtering options
Order Flow Legs
Dynamic order flow box highlighting price expansion
50% equilibrium level marking
Smart locking mechanism based on FVG mitigation
Real-time updates as price extends
ITH/ITL Pivot System
Intermediate Term High/Low detection
Run vs Sweep identification with directional labels
Mitigated and unmitigated level tracking
Visual distinction between respected and disrespected levels
Advanced Filtering
Hide opposing timeframe FVGs based on HTF bias
Filter current TF FVGs by type (bullish/bearish)
"Last Mitigated Only" mode to reduce chart clutter
Customizable maximum display limits per timeframe
📈 What Makes This Different?
Multi-Timeframe Integration: See how HTF FVGs align with your trading timeframe in real-time
Smart Bias Detection: Automatically determines market bias from highest to lowest enabled timeframe
Comprehensive Alerts: 12 distinct alert conditions covering FVG creation, mitigation, 2CR events, and pivot breaches
Professional Visualization: Clean, customizable colors and styles with minimal chart clutter
Status Dashboard: Quick-reference table showing the state of all tracked HTF FVGs
⚙️ Customization Options
Individual toggle controls for each HTF
Adjustable colors for bullish, bearish, active, and mitigated states
Boundary lines, origin markers, and mitigation lines
Configurable label sizes and positions
Line extension controls
Optional EMA overlay
🔔 Alert System
Set alerts for:
New FVG creation (bullish/bearish)
FVG mitigation events
2CR respect/disrespect
ITH/ITL runs and sweeps
💡 Best Practices
Start with Daily/Weekly HTF FVGs to identify overall bias
Use filtering to focus on trade direction aligned with HTF
Monitor 2CR events for confirmation of price acceptance/rejection
Combine with order flow legs to identify high-probability setups
Use the status table for quick multi-timeframe analysis
📚 Suitable For
ICT methodology traders
Smart Money Concept (SMC) practitioners
Multi-timeframe analysts
Swing and intraday traders
Anyone seeking institutional order flow insights
Note: This indicator is designed for educational purposes and works best when combined with proper risk management and additional confirmation methods. Understanding ICT concepts is recommended for optimal use.