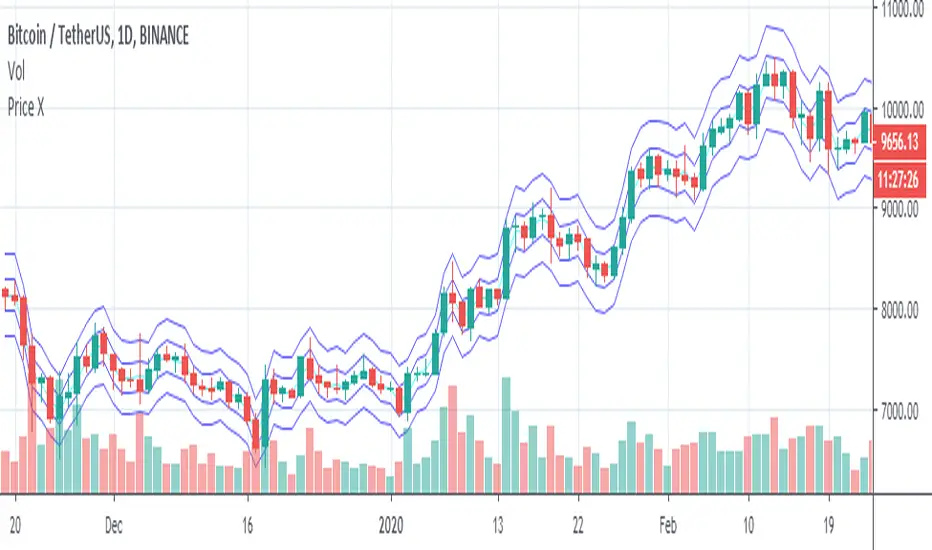
Priceit plots
ema - you can choose length
it plots a custom price say x
it plots price x*factors >
1.0005* price
1.001* price
0.9995* price
0.999* price
1.002* price
1.004* price
1.006* price
1.008* price
1.010* price
1.012* price
you can edit these , the scrip is open source
it plots ohlc4 and ohlc4* factors
1.0005* ohlc4
1.001* ohlc4
0.9995* ohlc4
0.999* ohlc4
you can edit these , the scrip is open source
ממוצע נע פשוט (SMA)
Fibonacci Moving Average (EMA/SMA) Bundle //@v1.2 Fibonacci Moving Average (EMA/SMA) Bundle
//By Tantamount
//Save your TV indicator use counts by using the Fibonacci SMA/EMA all in one indicator! Toggle between Exponetial or Simple moving averages functionality, using Fibonacci the sequence.
//Fib moving averages are very good at locating support and resistance zones on multiple time frames.
//Customize and or input your very own moving average nomenclature by simply changing the input options from default: SMA (21, 55, 89, 144, 233) or EMA (21, 55, 89, 144, 233) Example: (8,13,21,55,89)
Support and Resistance Lines


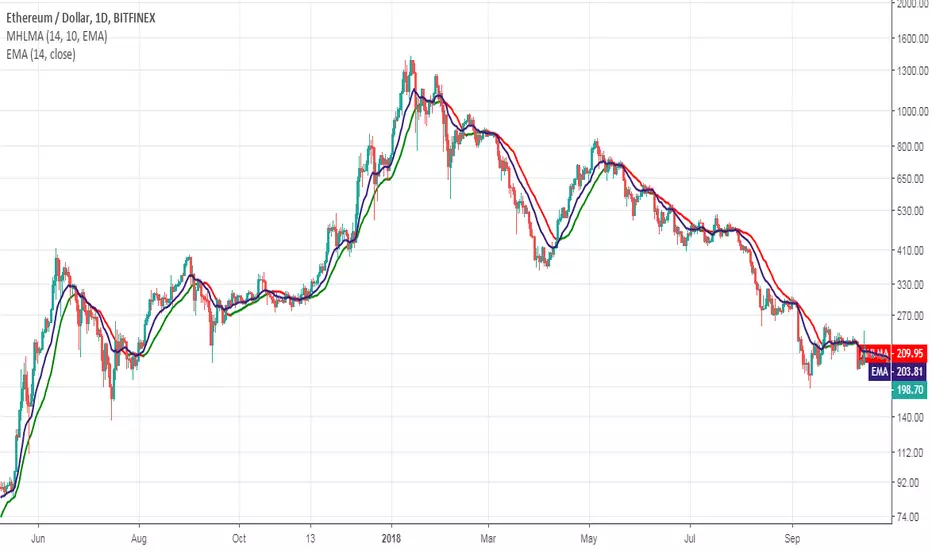
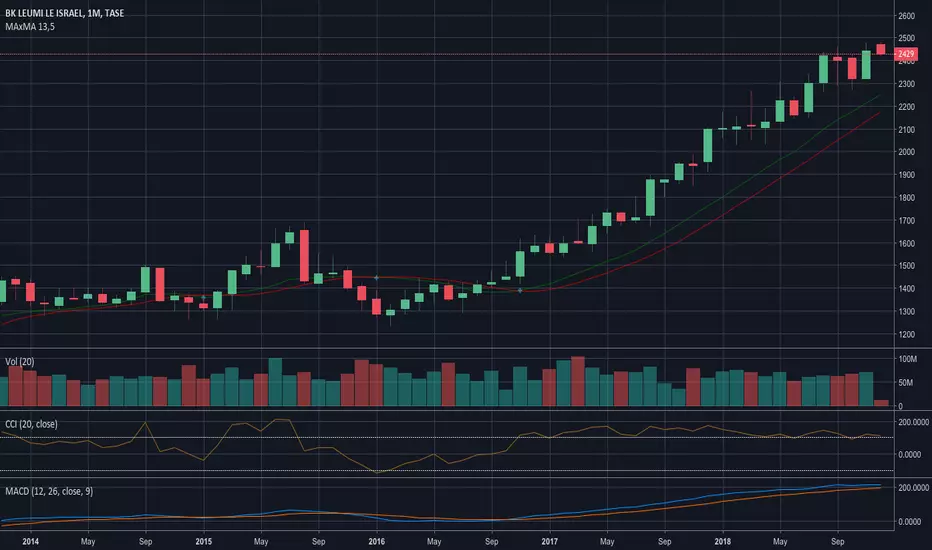
Middle-High-Low Moving AverageThis indicator was originally developed by Vitali Apirine (Stocks & Commodities , V.34:9 (August, 2016): "The Middle-High-Low Moving Average").
You can use it to create a crossover trading system in conjuction with EMA/SMA.
Good luck!
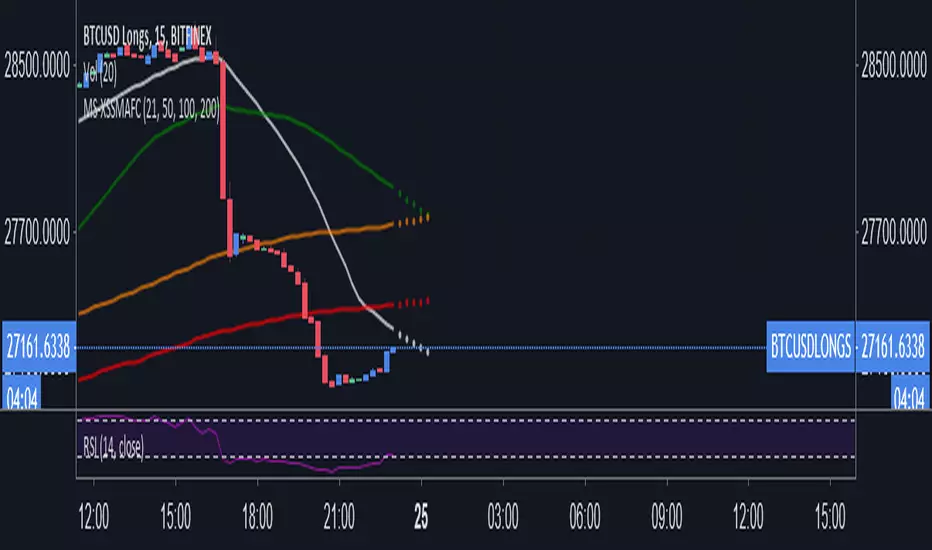
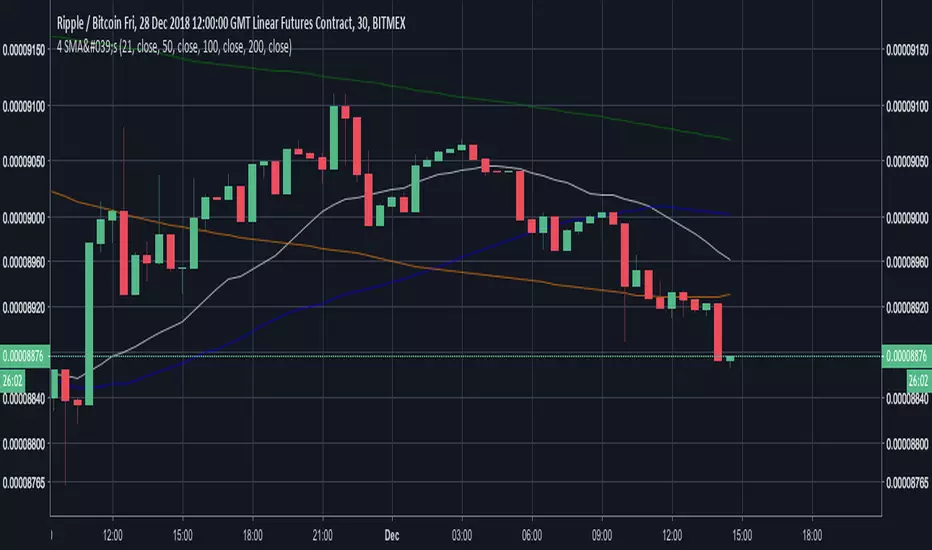
Meister Shredder - Simple Moving Averages x4 ForecastIncludes the 21, 50, 100 and 200 SMA and 6 bar forecast
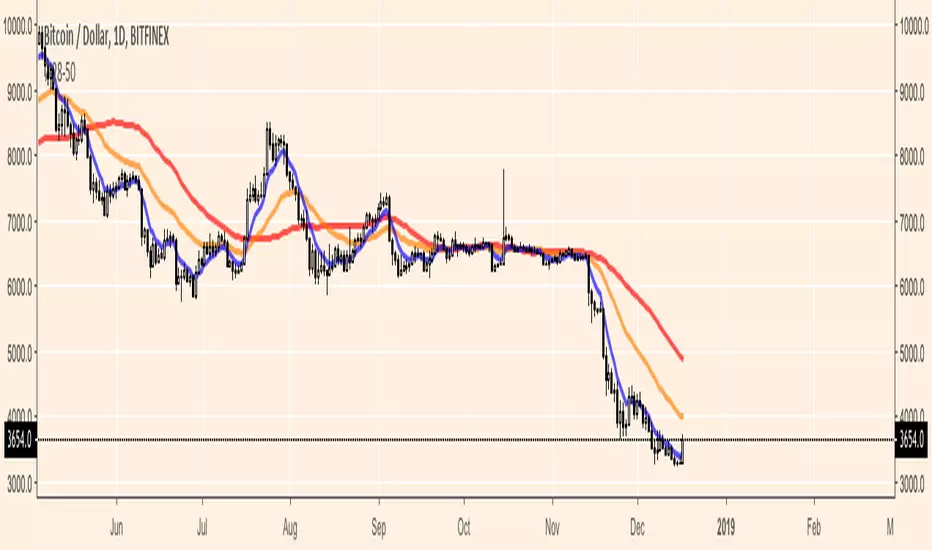
7-28-50 [BVCC]7 EMA
28 MA
50 MA
Derived from a strategy. I modified the 7 period to be EMA for more responsive monitoring.

7-28-507 EMA
28 MA
50 MA
Derived from a strategy. I modified the 7 period to be EMA for more responsive monitoring.
7-28-50 [BVCC]7 EMA
28 MA
50 MA
Derived from a strategy discussed in our telegram channel. I modified the 7 period to be EMA for more responsive monitoring.
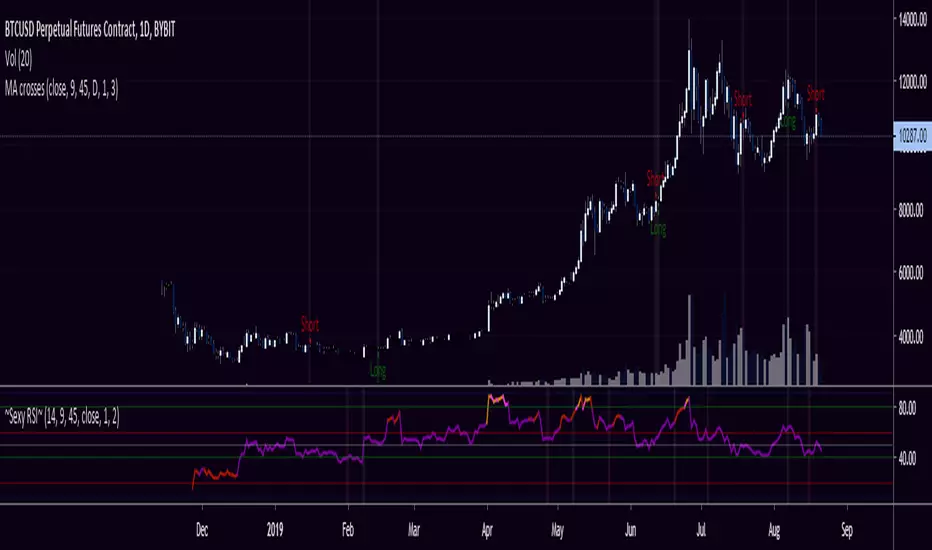
MA CrossA simple configurable MA Cross (3 MAs) script. You can choose between SMA and EMA , you will get arrows up or down when MAs cross each others. The arrows have different transparency and length parameters so you can easily identify them:
- small arrow and the most transparent for fast and medium MA crosses
- medium arrow for fast and slow MA crosses
- long arrow with no transparency for medium and slow MA crosses
Default values that can be changed:
- MA type = EMA
- Source for all MAs = close
- Fast MA length = 20
- Medium MA length = 50
- Slow MA length = 200
I plan on adding feartures overtime.

SMA/WMA histogram with MTF and alertsThis histogram is based on the difference between SMA and WMA (I make it as false MACD to create signals)
Since we have the non repainting MTF function we can see the buy and the sell signals at different time frames.
the color of the histo change according to difference so as the color change from dark red to light red be ready to buy and if color change from dark green to light green be ready to sell. The signal based on cross to the 0 .
since you have MTF in build you can change time frame changing int2 to desire min you want
here 60 min MTF on 30 min graph. you can make any variation you want .it flexible model allow you to find the best setting for your purpose

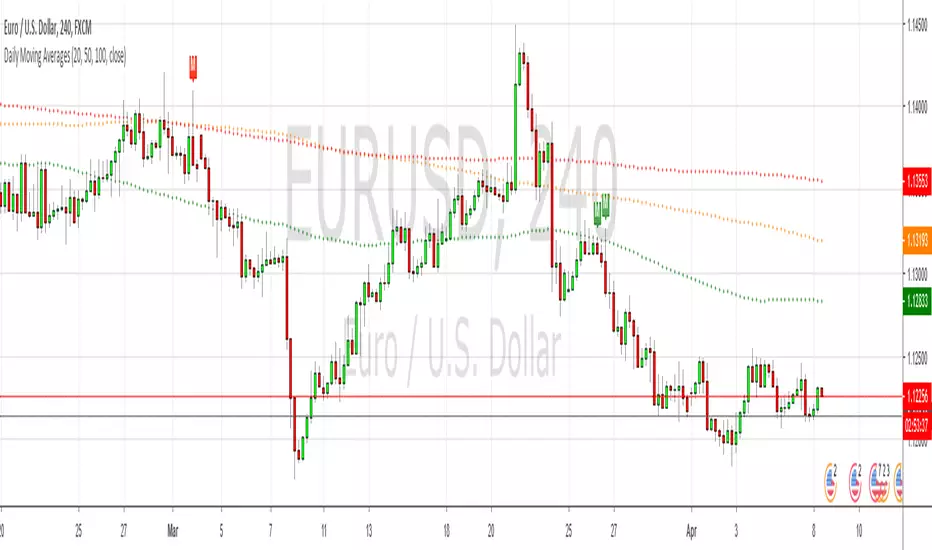
Daily Moving AveragesPlots the 20, 50, 100 & 200 daily moving averages on any lower timeframe, but it uses a custom function to calculate the plots rather than using the security() function, so the lines are smooth rather than jagged.
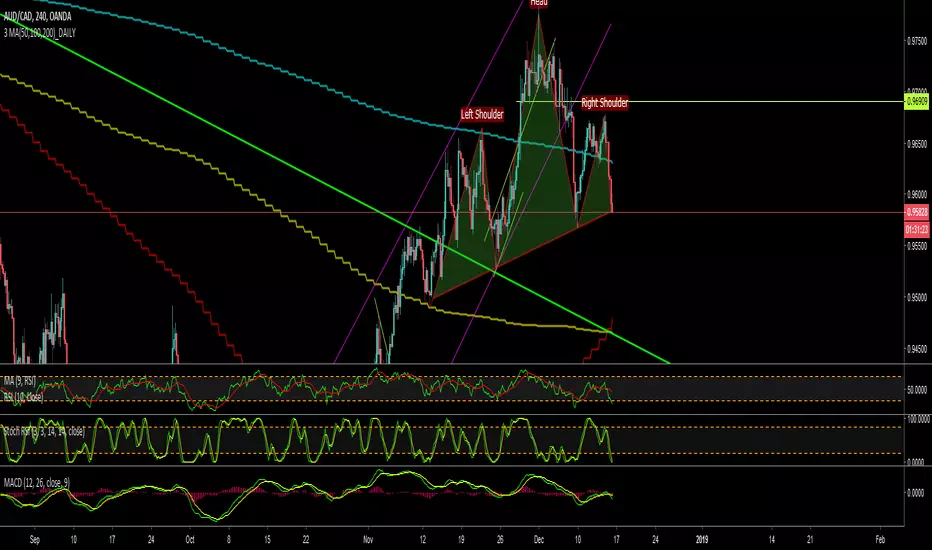
3 MA(50,100,200)_DAILYDaily Moving Average (50, 100, 200) in one code, indicates daily MA values in all time frames
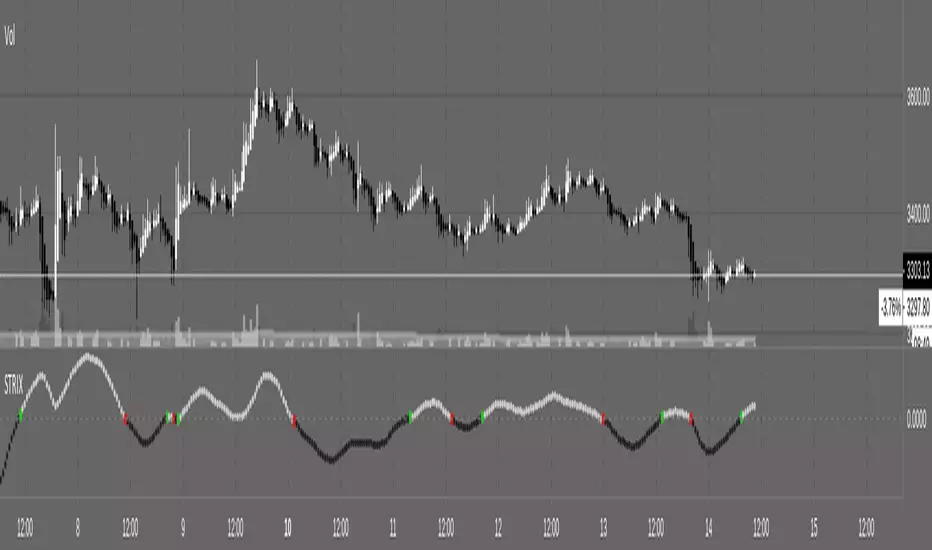
StrongerTRIXBetter version of the old-school TRIX trend indicator, a SMA for signaling and better visualization was added
SMA over-MTF (Tsma=time SMA)not something fancy but easy tool to see where the coin exist
I create MTF SMA line (tsma) blue color line -you can change the length by using int2 to any min frame that you want (here its 240 min tsma over 30 min graph)
and crossing of regular speed SMA will make us the color signals
easy to help you to see where the coin exist and to avoid stupid longs or shorts

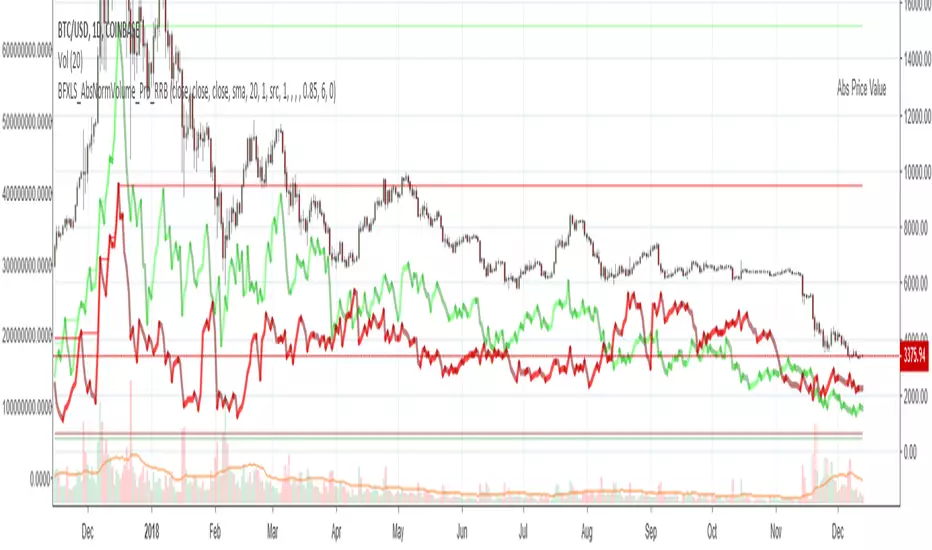
Chiki-Poki BFXLS Longs Shorts Abs Normalized Volume Pro by RRBChiki-Poki BFXLS Longs vs Shorts Absolute Normalized Volume Value Pro by RagingRocketBull 2018
Version 1.0
This indicator displays Longs vs Shorts in a side by side graph, shows volume's absolute price value and normalized volume of Longs/Shorts for the current asset. This allows for more accurate L/S comparisons (like a log scale for volume) since volume on spot exchanges (Bitstamp, Bitfinex, Coinbase etc) is measured in coins traded, not USD traded. Similarly, L/S is usually the amount of coins in open L/S positions, not their total USD value. On Bitmex and other futures exchanges volume is measured in USD traded, so you don't need to apply the Volume Absolute Price Value checkbox to compare L/S. You should always check first whether your source is measured in coins or USD.
Chiki-Poki BFXLS primarily uses *SHORTS/LONGS feeds from Bitfinex for the current crypto asset, but you can specify custom L/S source tickers instead.
This 2-in-1 works both in the Main Chart and in the indicator pane below. You can switch between Main/Sub Window panes using RMB on the indicator's name and selecting Move To/Pane Above/Below.
This indicator doesn't use volume of the current asset. It uses L/S ticker's OHLC as a source for SHORTS/LONGS volumes instead. Essentially L/S => L/S Volume == L/S
Features:
- Display Longs vs Shorts side by side graph for the current crypto asset, i.e. for BTCUSD - BTCUSDLONGS/BTCUSDSHORTS, for ETHUSD - ETHUSDLONGS/ETHUSDSHORTS etc.
- Use custom OHLC ticker sources for Longs/Shorts from different exchanges/crypto assets with/without exchange prefix.
- Plot Longs/Shorts as lines or candles
- Show/Hide L/S, Diff, MAs, ATH/ATL
- Use Longs/Shorts Volume Absolute Price Value (Price * L/S Volume) instead of Coins Traded in open L/S positions to compare total L/S value/capitalization
- Normalize L/S Volume using Price / Price MA / L/S Volume MA
- Supports any existing type of MA: SMA, EMA, WMA, HMA etc
- Volume Absolute Price Value / Normalize also works on candles
- Oscillator mode with negative axis (works in both Main Chart/Subwindow panes).
- Highlight L/S Volume spikes above L/S MAs in both lines/oscillator.
- Change L/S MA color based on a number of last rising/falling L/S bars, colorize candles
- Display L/S volume as 1000s, mlns, or blns using alpha multiplier
1. based on BFXLS Longs vs Shorts and Compare Style, uses plot*, security and custom hma functions
2. swma has a fixed length = 4, alma and linreg have additional offset and smoothing params
Notes:
- Make sure that Left Price Scale shows up with Auto Fit Data enabled. You can reattach indicator to a different scale in Style.
- It is not recommended to switch modes multiple times due to TradingView's scale reattachment bugs. You should switch between Main Chart and Sub Window only once.
- When the USD price of an asset is lower you can trade more coins but capitalization value won't be as significant as when there are less coins for a higher price. Same goes for Shorts/Longs.
Current ATH in shorts doesn't trigger a squeeze because its total value is now far less than before and we are in a bear market where it's normal to have a higher number of shorts.
- You should always subtract Hedged L/S from L/S because hedged positions are temporary - used to preserve the value of the main position in the opposite direction and should be disregarded as such.
- Low margin rates increase the probability of a move in an underlying direction because it is cheaper. High margin rates => the market is anticipating a move in this direction, thus a more expensive rate. Sudden 5-10x rate raises imply a possible reversal soon. high - 0.1%, avg - 0.01-0.02%, low - 0.001-0.005%
You can also check out:
- BFXLS Longs/Shorts on BFXData
- Bitfinex L/S margin rates and Hedged L/S on datamish
- Bitmex L/S on Coinfarm.online
2 Moving Average Cross SignalsThis indicator is meant to aid those who use Moving Average crosses as part of their trading strategy. This can be used to help identify turning points in trends.
You can customize what timeframe the MAs are derived from (e.g. can use current timeframe, or can hold it to 1d timeframe across all other timeframes)
When the fast and slow MAs cross each other, the background of the candle where the cross happened will be highlighted green or red (changeable), this will help visualize where the crosses are happening, regardless of whether or not you actually want the moving average lines printed on the charts. This could help keep the chart less cluttered.
Finally, you can choose between SMAs, EMAs, WMAs, and Linear MAs.
Enjoy
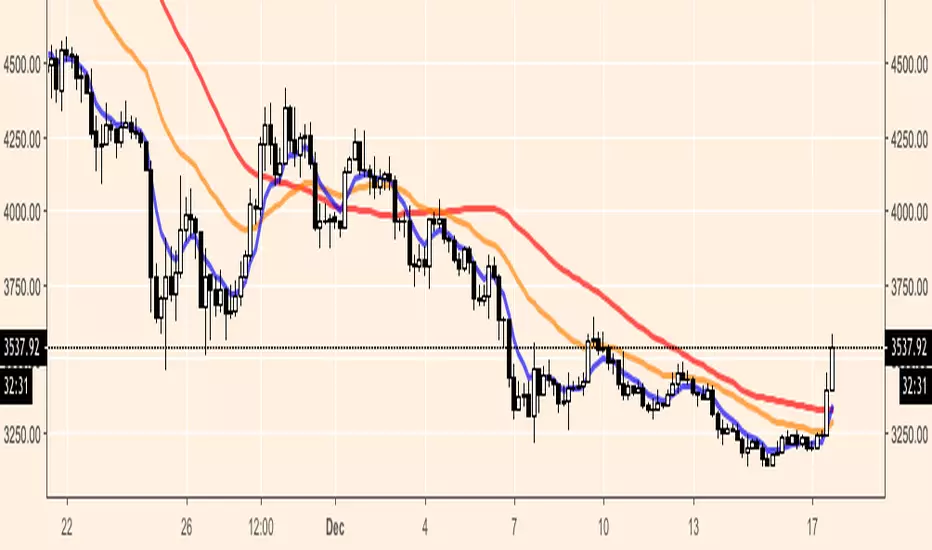
Triple Cross of DeathExponential moving averages in red of 4 and 16, exponential moving average of 40 in orange and simple moving average of 200 in yellow to confirm the triple crossing of 4, 16 and 40.
Taken from Lions against gazelles by Jose Luis Carpatos.

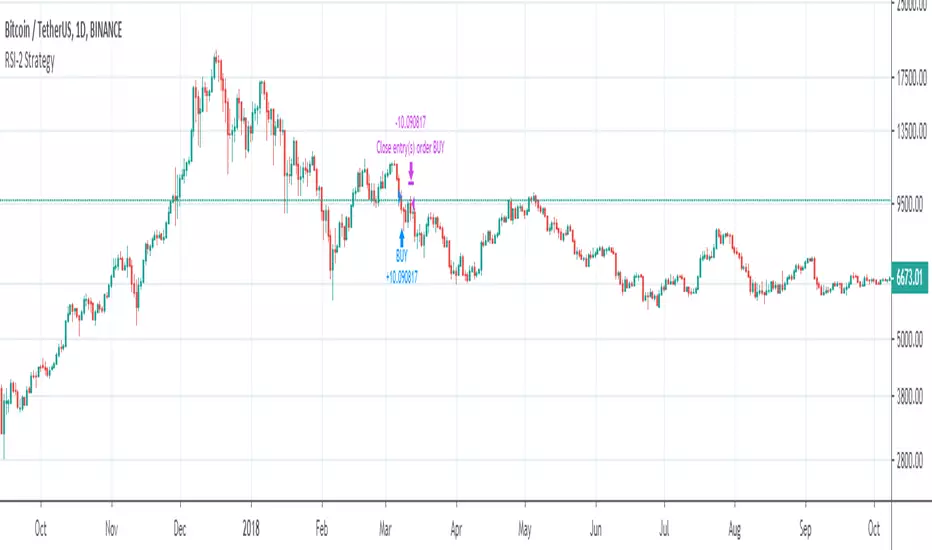
RSI2 ScaplingRule
1. Price is above its 200-period moving average
2. The 2-period RSI of price closes below 5
3. Buy price on the close
4. Exit when price closes above its 5-period moving average

MTF SMAThis script overcomes the issues with TV multitimeframe being wrong due to its bugs. It generates higher timeframe SMA on a lower timeframe chart. Enter the number of minutes of the higher timeframe as a setting.
Golden Fib WavesDynamic Fibonacci levels in pleasing gold shades. Smoothing (SMA) of swing lows and highs enabled by default. Boldly, this just looks good. I am not sure whether it is of any help for trading purposes. If you do in fact find it useful, feel free to drop me a line and to share your insights.
