JPM VIX Signal - Non OverlayJPMorgan Chase & Co . strategists have identified what they say is a near bulletproof indicator to strengthen their argument that stock markets are poised to rally.
The buy signal is triggered when the Cboe Volatility Index ( VIX ) rises by more than 50% of its 1-month (30 day) moving average, which it last did on January 25th 2022, according to the strategists led by Mislav Matejka. The indicator has proven 100% accurate outside of recessions over the last three decades.
Instructions:
Symbol - SPY
Timeframe - Daily
Signal - Indicator exceeds horizontal line of 1.5
מניות

JPMorgan VIX Buy SignalJPMorgan Chase & Co. strategists have identified what they say is a near bulletproof indicator to strengthen their argument that stock markets are poised to rally.
The buy signal is triggered when the Cboe Volatility Index (VIX) rises by more than 50% of its 1-month (30 day) moving average, which it last did on January 25th 2022, according to the strategists led by Mislav Matejka. The indicator has proven 100% accurate outside of recessions over the last three decades.
Instructions:
Symbol - VIX
Timeframe - Daily
Red Triangle - Close / 30 Day SMA >= 1.5

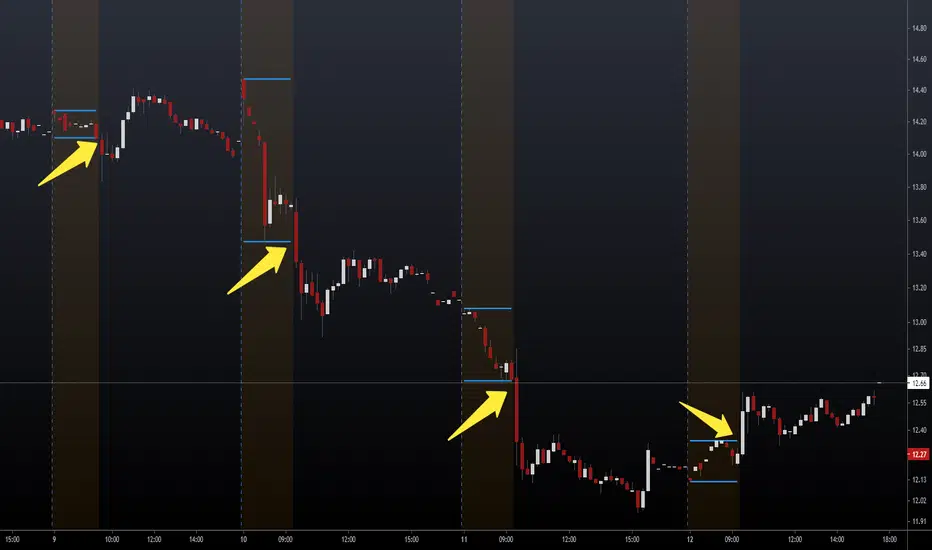
HighLow Box Highlight between EarningsHighLow Box Highlight between Earnings
This is an indicator to highlight area between two earning periods and their highest and lowest points.
It also alternates the highlight color in each subsequent block.
Tested to work in 1D charts and 1M charts
Just drop a message, if you want this further developed with more features.
Note: This was requested by user Meatpye on a forum.

Session Levels - Ultimate Range IndicatorSession Levels - Ultimate Range Indicator
Primarily developed for trading the E-MINI Futures Markets like NQ or ES from the CME Group,
but also more than suitable for Crypto or other instruments.
This indicator highlights the chosen session, which can be Globex, Asian, London and New York.
It plots the important levels and also renders the Opening Range as it forms (a.k.a. Initial Balance).
After the 1st hour Opening Range is finished, it can plot the Standard Deviations / Projections.
See below for a complete feature list.
All Opening Ranges on chart and for the New York session the Range Projections are turned on:
s3.tradingview.com
How to use (example):
If you are trading the Nasdaq Futures (NQ!)
Enable the Globex Overnight session. Basically in the Futures Market, the Globex session is everything outside of US trading hours of Stocks. This draws the important overnight levels, like the Low, 25%, 50%, 75% and the High.
Enable the New York Session with Levels and Opening Range. Generally, 70% of the time the 1st hour will put a Low or High of the day.
If the price is trading above the Globex Low, most likely the Low of the Day is formed and the price target for the day will be 1.5x Standard Deviation and 2x Standard Deviation.
[*} Deviation of the Initial Balance depends on the volume ad overall market structure.
** This is not financial advice or any guarantee **
Features:
Show each Session Highlighted on Intraday chart in it's own color (each session can be turned off and has customizable times and color)
Show Line Levels of each session: Low, 25%, 50%, 75% and the High (customizable color)
Show the Opening Range (Initial Balance) of the Asian, London and New York session. Note: NY has more options.
Opening Range is displayed as a box with level lines (customizable color)
Levels are drawn to the end of the NY Cash session (customizable time)
Show IB Standard Deviations 0.5 - 3.0. Calculated from the Opening Range (Initial Balance)
Option to display Higher Timeframe levels: Previous Day Open/Close and Previous Week Open/Close
All level lines and OR boxes size dynamically as the session progresses
Built in Alerts for when price hits key levels. e.g. Alert when price crosses the NY Opening Range High. Or an Alert when the first STDEV is hit.
Option to toggle display of drawings for Today's trading session only, or Show all recent session levels. This keeps the chart clean or not.
Extras:
The NY Opening Range also has a 50% level line
The NY Opening Bar can be highlighted separately
The Level Lines can have small labels turned on/off. Values are only shown on mouse over to keep a clean chart
Keep in mind:
1) This indicator works on all instruments, but on instruments with limited market hours, your chart setting
has to be set to "Extended Hours" otherwise. For example TSLA on NASDAQ.
2) The Exchange Time Zone for the CME Group is Chicago UTC-6. So the session times you configure in the settings menu are based on that timezone too.
3) Globex opens at 5pm CST and closes when the US session starts 8:30CST.
4) When enabling the Alerts in the Indicator settings, be sure to also create an alarm for this indicator using the Alarm function of Tradingview.

Financial Statement Indicator by zdmreKnowing how to work with the datas in a company's financial statements is an essential skill for stock investors. The meaningful interpretation and analysis of balance sheets, income statements, and cash flow statements to discern a company's investment qualities is the basis for smart investment choices.
You can access to the financials tables of the companies as a summary with this indicator.
3 Tables;
Income Statement Table:
Revenue
Net Profit
EPS
EPS-D
P/E
Balance Sheet Table:
Current Asset
Total Asset
Total Equity
Book Value per Share
Total Debt
Debt/Equity
Statistics & Cash Flow Table:
Return On Equity
Return On Asset
Return On Invested Capital
Quick Ratio
Free Cash Flow
Trend intensity 65 TI65––––History & Credit
This indicator has been inspired by public videos of StockBee and his community. Stockbee is a famous successful trader, who has approach to detail and backtesting. The TI65 is a great confirmation tool for the trend strenght.
–––––What it does
TI65 is an indicator that measures trend and momentum over 65 days.
When there is a green cloud we have a confirmed uptrend with certain velocity.
The calculation is simple as it measures the ratio between the 7d SMA over the 65D sma.
–––––How to use it
Look for entry points when during green trade intensity.

Diluted Earnings Per Share Signal [AstrideUnicorn]Earnings Per Share (EPS) is a financial metric closely monitored by investors. The so-called "positive earnings surprise" - a situation when EPS reading for a stock beats the value forecasted by analysts gives a bullish signal for this stock. The EPS reading lower than the analysts' estimate gives a bearish signal.
The Diluted Earnings Per Share (Diluted EPS) metric calculates a company's potential earnings per share value in the case if all convertible securities get converted to common shares. Convertible securities include preferred shares, stock options, warrants, convertible debt, etc. Diluted EPS is a more scientific way to estimate earnings per share, and it is usually lower than the ordinary EPS.
The Diluted EPS Signal indicator (DEPSS) is a fundamental indicator that calculates trading signals by comparing the Diluted EPS to the EPS Estimate. In many cases, Diluted EPS gives better insight into how a reported EPS reading may impact the stock price.
HOW TO USE
For each earnings date, the indicator calculates the Diluted Earnings Surprise percentage value :
Diluted Earnings Surprise = (Diluted EPS - EPS Estimate)/ EPS Estimate.
Diluted Earnings Surprise higher than the specified threshold value is a bullish signal. In this case, the indicator displays a green triangle pointing up.
Diluted Earnings Surprise lower than the specified threshold value is a bearish signal displayed as a red triangle pointing down.
As one can see on the chart, there are a lot of situations where EPS readings with green labels (the ones that beat analysts' estimates) lead to down moves. The DEPSS indicator can spot weak earnings and give opposite signals.
SETTINGS
Earnings Surprise Threshold (%) : the threshold value (in percentage units) for the Diluted Earnings Surprise. The calculated Diluted Earnings Surprise must be higher than Earnings Surprise Threshold to be considered a BUY signal or lower than minus Earnings Surprise Threshold to be considered a SELL signal. The default value for Earnings Surprise Threshold is 20%.

Trendalix EntriesThis script is made to simplify the analysis of trends. It changes the mas based on whether you're looking at stocks or crypto. As these 2 markets currently move differently, they need a slightly different approach.
Crypto trends:
Can move much faster than stocks. Ideally the price should be bouncing above the williams alligators (about the 20-30 MAs).
Stocks:
These swing more than crypto so you need to get deep into these swing to be buying at the bottom of a move. The MAs are much larger, between the 50ma and 400ma. It's much more important here that the slower MAs are strong, i.e 200ma is above the 400ma, than it is that the faster MAs are okay.
For stocks an entry and stop line is drawn. These are only visible when the market is sufficiently in a pullback.

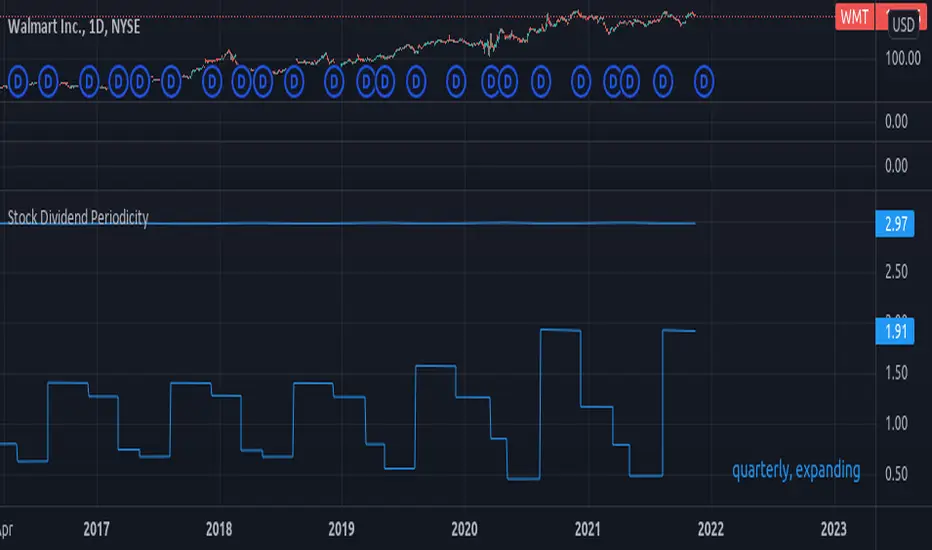
Stock Dividend Periodicityexperimental:
a basic method to evaluate stock dividend periodicity.
known issues:
* it does not adapt well to changes in periodicity, if there is a big enough change on the dividend period plan.
RSI Rising Crypto Trending AlertAlert version of the strategy with the same name
This is crypto and stock market trending strategy designed for long timeframes such as 4h+
From my tests it looks like it works better to trade crypto against crypto than trading against fiat.
Indicators used:
RSI for rising/falling of the trend
BB sidemarket
ROC sidemarket
Rules for entry
For long: RSI values are rising, and bb and roc tells us we are not in a sidemarket
For long: RSI values are falling, and bb and roc tells us we are not in a sidemarket
Rules for exit
We exit when we receive an opposite direction.
Cuation: Because this strategy uses no risk management, I recommend you takje care with it.
If you have any questions, let me know !

Scalping Trading System ALERT Crypto and StocksThis is the alert version of the strategy with the same name.
Indicators
SImple Moving Average
Exponential Moving Average
Keltner Channels
MACD Histogram
Stochastics
Rules for entry
long= Close of the candle bigger than both moving averages and close of the candle is between the top and bot levels from Keltner . At the same time the macd histogram is negative and stochastic is below 50.
short= Close of the candle smaller than both moving averages and close of the candle is between the top and bot levels from Keltner . At the same time the macd histogram is positive and stochastic is above 50.
Rules for exit
We exit when we meet an opposite reverse order.
This strategy has no risk management inside, so use it with caution !

Trend System Oscillator Averages RatingThis is a trend system made with multiple oscillator averages designed especially for trending markets such as stocks or crypto.
It can be used with any timeframe.
Its made of multiple moving oscillators such as
RSI
Stochastic
ADX
CCI
AO
MACD
MOM
STOCH RSI
WPR
BP
UO
Avg of all oscillators
It has also a rating, making an avg from all of the oscillators , going from -100 (all ma's are telling to go short ) to 100 ( all ma are telling to go long).
If you have any questions let me know !

Trend System Multiple Moving Averages RatingThis is a trend system made with multiple moving averages designed especially for trending markets such as stocks or crypto.
It can be used with any timeframe.
Its made of multiple moving averages such as
Simple
Weighted
Volume Weighted
Exponential
Double EMA
Arnaud Legoux
Hull MA
Smoothed
Least Squares
Kaufman Adaptive
Triple EMA
Zero Lag
Fractal Adaptive
Variable Index Dynamic Average
Jurik Moving Average
Tillson
Triangular
Avg of all moving averages
It has also a rating, making an avg from all of the moving averages , going from -100 (all ma's are telling to go short ) to 100 ( all ma are telling to go long).
If you have any questions let me know !

Volatility Adjusted Grid [Gann]█ OVERVIEW
Gann Square of 9 is one of the many brilliant concepts from W.D.Gann himself where it revolves around the idea that price is moving in a certain geometrical pattern. Numbers on the Square of 9 spiral tables, especially those lie in every 45degree in the chart act as key vibration levels where prices have tendency to react to (more on the table below).
There are few square of 9 related scripts here in Tradingview and while there's nothing wrong with them, it doesn't address 1 particular issue that i have: The numbers can be too rigid even when scaled based on current price because the levels are fixed, which makes them not tradable on certain timeframes depending on where the price currently sitting.
Heres 5min and 1hour Bitcoin chart to illustrate what i mean: Grey line on the left is based on Volatility Adjusted levels, while red/blue on the right are the standard Gann levels.
You can see that on 1hour chart, it provides a good levels (both Volatility Adjusted and the standard one happened to share the same multiplier in this case),
1Hour Chart:
On 5 min chart tells a different story as the range between blue/red levels can be deemed as to big for a short term trade, while the grey line is adjusted to suit that particular timeframe (You can still adjust to make it bigger/smaller from the settings, more on this below)
5Min Chart:
█ Little bit on Gann Square of 9 table
This is the square of nine table, the numbers highlighted in Red are known as Cardinal Cross and considered to be a major Support/Resistance while those in Blue color are known as Ordinal Cross considered as minor (but still important) Support/Resistance levels
Similarly, this script use these numbers (and certain multipliers) to print out the levels, with Cardinal numbers represented by solid lines and Ordinal numbers by dotted lines.
█ How it Works and Limitations
The Volatility Adjusted grid will go through several iterations of different multipliers to find the Gann number range that is at least bigger than times ATR. Because it's using ATR to determine the range, occasionally you'll notice that the line become smaller as ATR contracting (and vice versa). To overcome this, you can change the size range multiplier from the settings to retrieve the previous range size.
Use the size guide at the bottom left to find the multiplier that suits your need:
1st Row -> Previous Range -- Change Range Size to number lower than this to get a smaller range
2nd Row -> Next Range -- Change Range Size to number higher than this to get a larger range
Example:
Before:
After:
As you'll soon realise, the key here is to find the range that fits the historical structure and suits your own strategy. Enjoy :)
█ Disclaimer
Past performance is not an indicator of future results.
My opinions and research are my own and do not constitute financial advice in any way whatsoever.
Nothing published by me constitutes an investment recommendation, nor should any data or Content published by me be relied upon for any investment/trading activities.
I strongly recommends that you perform your own independent research and/or speak with a qualified investment professional before making any financial decisions.
Any ideas to further improve this indicator are welcome :)

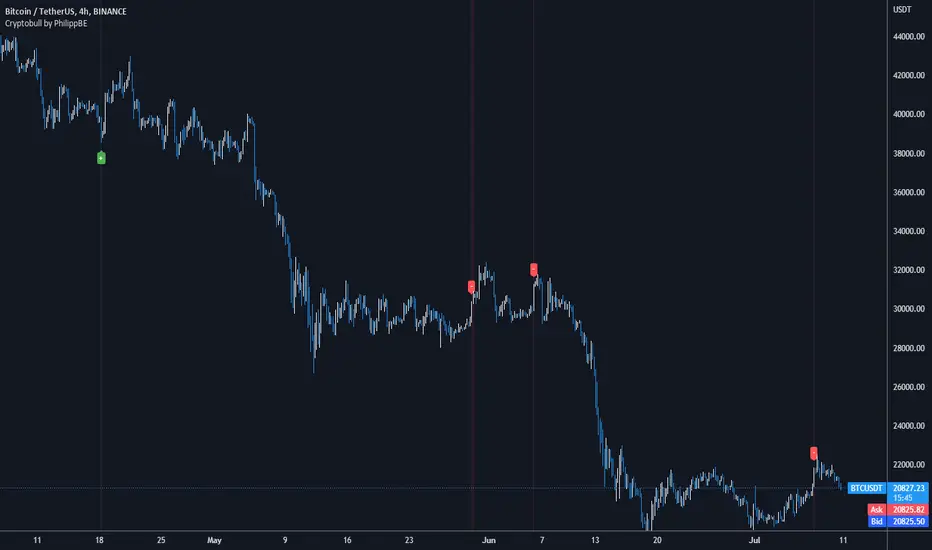
Cryptobull | Long / Short IndicatorCryptobull is a indicator based on the Williams R and Bollinger Band to find Long / Short entries (together with your strategy).
!!! The indicator is not working in every market situation -> so i recommend to add the indicator to your existing strategy !!!
Designed for:
->15m Chart
->5m Chart
->Crypto
->(Stocks)
I recommend using this indicator with Price Action or your own strategy to enter trades.
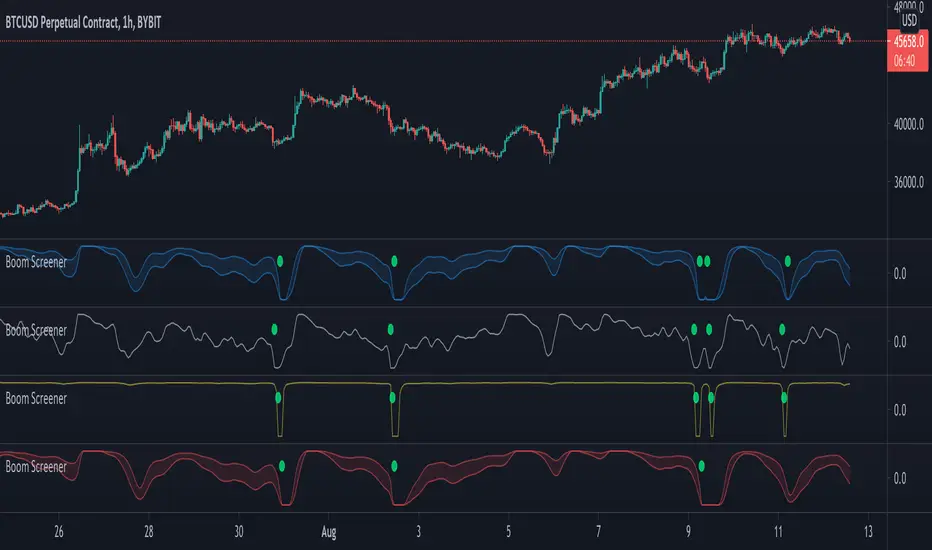
Boom Hunter - Entry Point Screener AlertsStock screener for Boom Hunter and Boom Hunter Pro entry zones. This script will screen 18 different stocks for entry zones.
1. Enter in any ticker ID's from charts you wish to scan in the settings.
2. Go to desired timeframe.
3. Click add alert button at top toolbar.
4. Select Boom Screener indicator, input alert notification settings and/or change alert name and click create.
The script will then scan the stocks and alert you of any entry zones from the timeframe you set the alerts.
A new alert needs to be created for each timeframe you wish to screen.
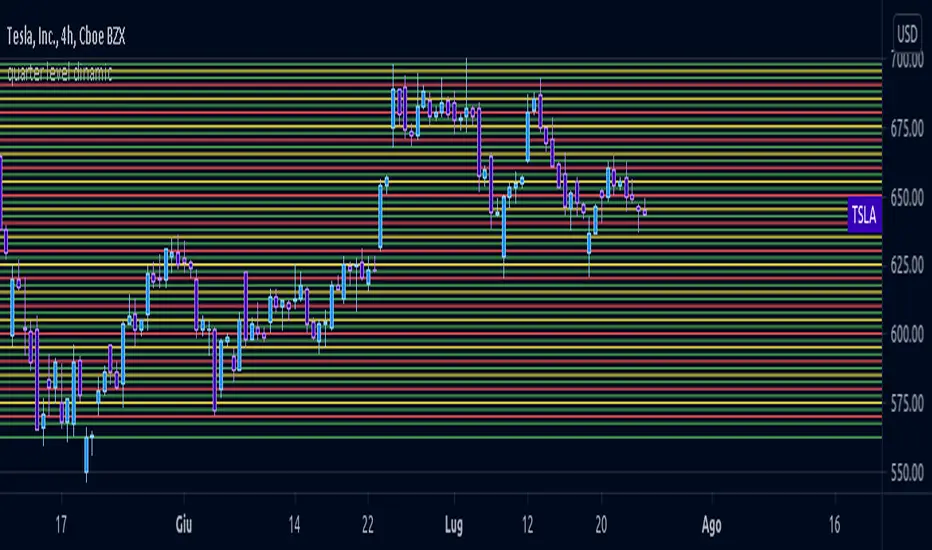
quarter level dinamicLimited quarter level script but more flexible in compared to my FX script, same logic behind
Relative Volume Screener AlertsThis script will screen 12 different stocks and current chart (13 in total) for entry points from my relative volume indicator.
1. Enter in any ticker ID's from charts you wish to scan in the settings.
2. Go to desired timeframe.
3. Click add alert button at top toolbar.
4. Select RVOL Screener Alerts indicator, input alert notification settings and/or change alert name and click create.
The script will then scan the stocks and alert you of any entry points from the timeframe you set the alerts.
A new alert needs to be created for each timeframe you wish to screen.
You can find my relative volume indicator here:

Divergence of Stocks Above MA50 v.s. US-Stock MarketEnglish:
This indicator has been developed as an early warning tool to estimate the probability of correction in the US stock market. It works best in the daily chart.
Function:
1.) "Index-line"
The underlying stock index is converted to a scale between 0% and 100% based on its 52-week highs and lows. Where 100% is closing price at 52-week high and 0% is closing price at 52-week low.
2nd) "Stocks Above MA50".
For each major stock index, there is an index that determines the percentage of stocks above its 50 moving average. For example, for the S&P 500, this is the S5FI.
3) "Divergence
In an efficient market, both lines (index and number of stocks above the 50 MA) would run more or less in sync. A new high in the index would also mean a new high in the stocks trading above the 50 moving average. Often, however, a correction in the index is announced when the number of stocks trading above their 50 MA do not make a new, or even a lower, high while the underlying index marks a new high. The divergence signal measures this divergence of the indices. The higher the bar, the more pronounced the divergence.
How to read the indicator?
If a divergence occurs, then the stops should be tightened. As with any indicator, false signals can occur because a divergence does not automatically lead to a correction. The higher the divergence is indicated, the higher the probability. The strength of a correction cannot be predicted with the indicator.
For which symbols does the indicator work?
The indicator works exclusively for the following symbols:
S&P500: SPX, SPY, ES1!, US500 Index above MA50: S5FI
Russel2000: IWM, US2000, RTY1!, RUT, IWO Index above MA50: R2FI
NASDAQ100: NDX, NAS100, NQ1!, US100, QQQ Index above MA50: NDFI
NASDAQ: IXIC, ONEQ, QCN1!, NDAQ Index above MA50: NCFI
NYSE: XAX, NYA Index above MA50: MMFI
DowJones100: DJX, DJI, DIA, MYM1!, YM1! Index above MA50: DIFI
DowJonesComp: DOW, IYY Index above MA50: DCFI
Deutsch:
Dieser Indikator ist als Frühwarninstrument zur Einschätzung der Korrekturwahrscheinlichkeit im US-Aktienmarkt entwickelt worden. Er funktioniert am besten im Tages-Chart.
Funktion:
1.) „Index-line“
Der zugrunde liegende Aktienindex wird bezogen auf seine 52Wochen Hochs und Tiefs in eine Skala zwischen 0% und 100% umgerechnet. Dabei sind 100% Schlusskurs auf 52-Wochen Hoch und 0% Schlusskurs auf 52-Wochen Tief.
2.) „Stocks Above MA50“
Zu jedem Hauptaktienindex gibt es einen Index, der den Prozentwert der Aktien über Ihrem 50 gleitenden Durchschnitt ermittelt. Beim S&P 500 ist das z.B. der S5FI.
3.) „Divergence“
In einem effizienten Markt würden beide Linien (Index und Anzahl Aktien über dem 50 MA) mehr oder weniger synchron laufen. Ein neues Hoch im Index würde auch ein neues Hoch bei den Aktien, die über dem 50 gleitenden Durchschnitt notieren, bedeuten. Oft jedoch kündigt sich eine Korrektur im Index an, wenn die Anzahl der Aktien, die über ihrem 50 MA notieren kein neues, oder sogar ein niedrigeres Hoch machen, während der zu Grunde liegende Index ein neues Hoch markiert. Das Divergenz-Signal misst diese auseinanderlaufen der Indices. Je höher der Balken, umso stärker ist die Divergenz ausgeprägt.
Wie ist der Indikator zu lesen?
Wenn eine Divergenz auftritt, dann sollten die Stopps enger herangezogen werden. Es kann wie bei jedem Indikator zu Fehlsignalen kommen, da eine Divergenz nicht automatisch zu einer Korrektur führen muss. Die Wahrscheinlichkeit ist um so höher, je höher die Divergenz angezeigt wird. Die Stärke einer Korrektur kann mit dem Indikator nicht prognostiziert werden.
Für welche Symbole funktioniert der Indikator?
Der Indikator funktioniert ausschließlich für folgende Symbole:
S&P500: SPX, SPY, ES1!, US500 Index über MA50: S5FI
Russel2000: IWM, US2000, RTY1!, RUT, IWO Index über MA50: R2FI
NASDAQ100: NDX, NAS100, NQ1!, US100, QQQ Index über MA50: NDFI
NASDAQ: IXIC, ONEQ, QCN1!, NDAQ Index über MA50: NCFI
NYSE: XAX, NYA Index über MA50: MMFI
DowJones100: DJX, DJI, DIA, MYM1!, YM1! Index über MA50: DIFI
DowJonesComp: DOW, IYY Index über MA50: DCFI

Full CRYPTO pack macd, rsi, obv, ema alert versionThis is the indicator version of a simple, yet very efficient crypto strategy, adapted to 4h time frame, on big coins like ETH and BTC . However it can be adapted to other markets, timeframes etc
For this strategy I use a combination of a trend line , an oscillator, price action and volume .
This study has alert for both long and short entries/exit.
The rules are the next ones:
Long : we check that current candle is ascending and above the moving average, the macd is in positive range, rsi is below overbought level and volume is bigger than the moving avg of volume .
For short, we have the opposite long rules.
If you have any questions, please let me know !

MACD oscillator with EMA alert version 4HThis is the study/indicator alert version of the macd + ema strategy.
The strategy details are the following :
Is a simple, yet efficient strategy, which is made from a combination of an oscillator and a moving average.
Its setup for 4h candles with the current settings, however it can be adapted to other different timeframes.
It works nicely ,beating the buy and hold for both BTC and ETH over the last 3 years.
As well with some optimizations and modifications it can be adapted to futures market, indexes(NASDAQ, NIFTY etc), forex( GBPUSD ), stocks and so on.
Components:
MACD
EMA
Time condition
Long/short option
For long/exit short we enter when we are above the ema , histogram is positive and current candle is higher than previous.
For short /exit long , when close below ema , histo negative and current candles smaller than previous
If you have any questions please let me know !

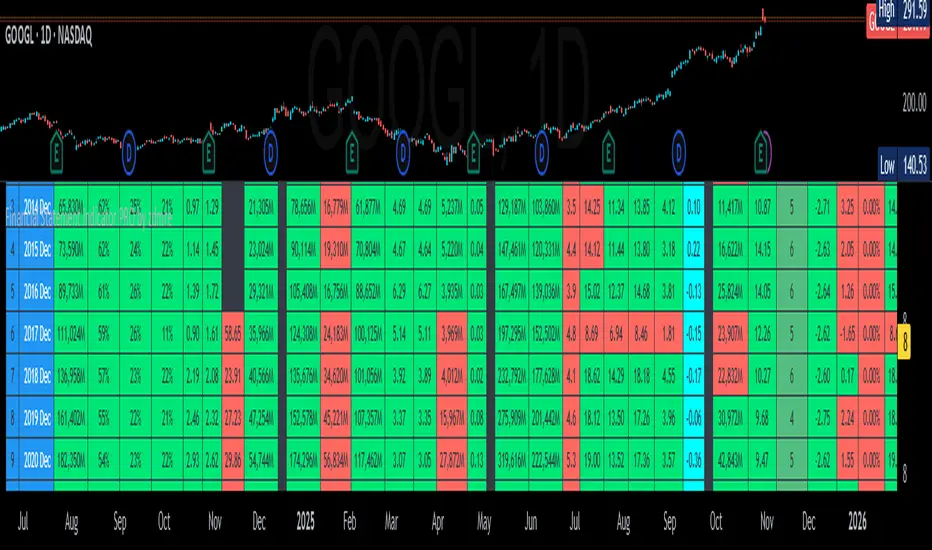
Financial Highlights [Fundamentals]█ OVERVIEW
This indicator plot basic key financial data to imitate the presentation format of several popular finance site, make it easier for a quick glance of overall company financial health without switching tabs for every single stocks.
█ Financial Data Available:
- Revenue & PAT (Profit after Tax)
- Net Profit Margin (%)
- Gross Profit Margin (%)
- Earnings Per Share (EPS)
- Dividend
█ Features:
- Toggle between Quarter/Annual Financial Data (Notes: For Dividends, it will always be plotted based on Annual data, at Financial Year ending period)
- Options to plot at either at Quarter/Yearly ending period OR Financial Data published date
█ Limitation
- The accuracy of the data subject to Tradingview's source, but from my observation it's accurate 95% of the time
- Recently published data might not be available immediately. e.g. MYX exchange tends to have 1-3 days lag
- More information on Tradingview's financial data can be read here -> www.tradingview.com
█ Disclaimer
Past performance is not an indicator of future results.
My opinions and research are my own and do not constitute financial advice in any way whatsoever.
Nothing published by me constitutes an investment recommendation, nor should any data or Content published by me be relied upon for any investment/trading activities.
I strongly recommends that you perform your own independent research and/or speak with a qualified investment professional before making any financial decisions.
Any ideas to further improve this indicator are welcome :)

NSDT Pre-Market Breakout LevelsA simple way to identify potential breakouts at the New York market open. This indicator plots the high and low of the New York Pre-Market, providing a great visual of a potential breakout levels.