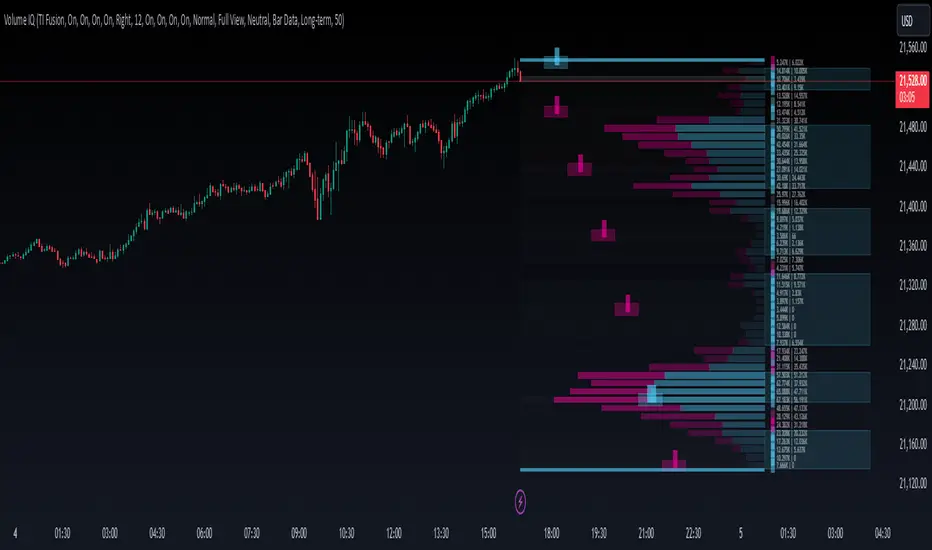
VWATR Multi-Timeframe RibbonThis script combines and averages Volume-Weighted Moving Averages in a specific way to make a unique ATR band that expands and retracts based on the volume in the current market.
This indicator allows for viewing up to 4 VWATR Bands on all the major trading timeframes.
This creates support and resistance levels that are fluid enough for traders to use these 4 methods:
- Identify a range to trade between in sideways markets.
- Identify when we are beginning a move(breaking out of the bands and using them as support to trade from).
- During a trend, traders can use higher timeframe VWATR Bands to identify take profits or potential rejection points.
- Identify when a trend may be over(losing the band as support after a breakout).
NOTE: This script will work fine on identifying crypto assets and stocks, but markets with different volume parameters will negatively affect the accuracy of this script.
ווליום ממוצע נע משוקלל (VWMA)
JMF MTF historical Vwap map and static levels. What is a vwap map?
This is a Multi time frame Historical vwap heatmap. The study plots lines and maps out historical vwap zones based on closing vwap value of the time frame selected and the time frames high range. Show casing high volume concentration areas and low volume area's from each time frame chosen on chart.
Static Vwap Lines can be turned off in settings, as well as the map, you can use each individually or paired together for a more complete overview of the levels. You can also refine the search by using the "Gap %" input. This will filter out and search for average price's that have gapped up or down "X" percent from the previous days average price. Leaving you with Static vwaps and map zones from the most important "Gap Day's". This helps clean up the over all visual, but be careful choosing a higher gap percentage, that you don't lose too much granularity the map offers.
What will a "Static vwap and Map look like"
The look will vary greatly depending on where the stock is in its historical range. If the name is in a consolidation range with a lot of recent average prices directly above and below, you will have a heavy, crowded, Darker/intense heat signature from the map, You will also see levels in map mode over lapping and lines bundled together. These high traffic area's can act as great support or resistance since they are showing a congregation of historical average prices where participants have previously interacted. On the contrary, if you see "open air" in the map, or large areas of blank chart where no heat signature is mapping, this is an area of LOW volume and average prices. Current price will or can move quickly through these areas IF price accepts inside the open air range. If price does NOT accept inside the open air range, Then the blank low volume zone can and will act as support or resistance given the situation.
Capture the gaps.
I look to capture these "Gaps" created by the map and static levels both long or short. I have noticed over time that the higher time frame maps zones are WELL respected intraday, Daily, Weekly, Monthly etc. I look for areas where we are clearing a high volume zone, we break above, hold and accept into open air, and start to move through the open air zones up or down.
I also use the more granular smaller levels as support and resistance intraday while in plays.
Time frames and settings .
User has 3 inputs for seperate time frames to show. You can show a combo of all 3 timeframes, or you can show only a single time frame of your choosing, or two. Mix and match with the string input time frames.
Acceptable inputs are - 5,10,15,30,60,90,240,D,W,M,2D,4W,3M and so on. Any combination of string input timeframe should work, that means numbers (5,10,15,etc) or letters (D,W,M,etc) or combination of the two.
Look and feel
Each time frame has its own color input, transparency input, line style input, and line weight input. User can customize any of the lines or maps to their liking with a wide variety of styles, widths, and colors.
Any or all of the time frames can be enabled or disabled as well, to make the map as busy, or as calm as you would like.
Enjoy !
In the end I encourage any who tries the Heatmap to really sit down and spend some time playing around with the settings in order to find out how they like the map set up. I usually run the default settings on a intraday 5min chart, and then another instance of the study on a 15min chart with W,M,3M. plotted. That way I can see granular intraday levels, and macro long term levels in the same view. See what fit's you the best, and how you like to trade. Most of all ENJOY!
Good luck -
JMF.
IMPORTANT INFO -
As always, the creator of this code is NOT a licensed investment advisor. No output of this tool is to be taken as investment advice or a recommendation to buy or sell any security.
Trading is risky, any one using this tool acknowledges they CAN LOSE some if not all of their initial investment even with this tool enabled.
User assumes ALL RESPONSIBILITY when using this tool in their technical analysis .
Heikin Ashi - The WhaleThe strategy is based on Heikin Ashi calculation, you do not need to switch the candle to HA.
The HA is used as a base entry, if a candle or two candles are bullish, then is valid to open a position, you can select the validation, one or two candles.
Also, the strategy mainly uses volume indicators as a confluence, you can select VWAP , VWMA , and Volume Oscillator, in addition to ADX which has two ways to validate the entry.
Base entry: One or two bullish HA candles (candles without a lower wick)
Confluence Indicators:
ADX: Will give a positive signal only if ADX is above the threshold, or if +DI is above -DI, or both.
VWAP: will give a positive signal if HA close is above VWAP.
VWMA: composite of 3 MA (20, 25, 50). There are multiple options to set it as confluence, the first option is to check if the short is bigger than the long and long is bigger than the base. The other options are to check the close status, which is bigger than which MA. You can find the description of each option in the strategy box
The sell is based on trailing stop loss (TSL), while the stop loss is based lowest X candle, the strategy will look back to the lowest number of the HA candles and set it as stop loss.
Chart VWAP█ OVERVIEW
This indicator displays a Volume-Weighted Average Price anchored to the leftmost visible bar of the chart. It dynamically recalculates when the chart's visible bars change because you scroll or zoom your chart.
If you are not already familiar with VWAP, our Help Center will get you started. The typical VWAP is designed to be used on intraday charts, as it resets at the beginning of the day. Our Rolling VWAP , instead, resets on a rolling time window. You may also find the VWAP Auto Anchored built-in indicator worth a try.
█ HOW TO USE IT
Load the indicator on an active chart (see the Help Center if you don't know how). By default, it displays the chart's VWAP in orange and a simple average of the chart's visible close values in gray. This average can be used as a companion to the VWAP, since both are calculated from the same set of bars. The script's settings allow you to hide it.
You may also use the script's settings to enable the display of the chart's OHLC (open, high, low, close) levels and the values of the high and low. These are also calculated from the range of visible bars. You can complement the high and low lines with their price and their distance in percent from the chart's latest visible close . You can use the levels to quickly identify the distances from extreme points in the visible price range, as well as observe the visible chart's beginning and end prices.
█ NOTES FOR Pine Script™ CODERS
This script showcases three novelties:
• Dynamic recalculation on visible bars
• The VisibleChart library by PineCoders
• The new `anchor` parameter of ta.vwap()
Dynamic recalculation on visible bars
This script behaves in a novel way made possible by the recent introduction of two new built-in variables: chart.left_visible_bar_time and chart.right_visible_bar_time , which return the opening time of the leftmost and rightmost visible bars on the chart. These are only two of many new built-ins in the `chart.*` namespace. See this blog post for more information, or look up them up by typing "chart." in the Pine Script™ Reference Manual .
Any script using chart.left_visible_bar_time or chart.right_visible_bar_time acquires a unique property, which triggers its recalculation when traders scroll or zoom their chart, causing the range of visible bars to change. This new capability is what makes it possible for this script to calculate its VWAP on the chart's visible bars only, and dynamically recalculate if the user scrolls or zooms their chart.
This script is just a start to the party; endless uses for indicators that redraw on changes to the chart will no doubt emerge through the hands of our community's Pine Script™ programmers.
The VisibleChart library by PineCoders
The newly published VisibleChart library is designed to help programmers benefit from the new capabilities made possible by the fact that Pine Script™ code can now tell when it is executing on visible bars. The library's description, functions and example code will help programmers make the most of the new feature.
This script uses three of the library's functions:
• `PCvc.vVwap()` calculates a VWAP for visible bars.
• `PCvc.avg()` calculates the average of a source value for visible bars only. We use it to calculate the average close (the default source).
• `PCvc.chartXTimePct(25)` calculates a time value corresponding to 25% of the horizontal distance between visible bars, starting from the left.
The new `anchor` parameter of ta.vwap()
Our script also uses this new `anchor` parameter to reset the VWAP at the leftmost visible bar. See how simple the code is for the VisibleChart library's `vVwap()` function.
Look first. Then leap.
Swing Trading SPX CorrelationThis is a long timeframe script designed to benefit from the correlation with the Percentage of stocks Above 200 moving average from SPX
At the same time with this percentage we are creating a weighted moving average to smooth its accuracy.
The rules are simple :
If the moving average is increasing its a long signal/short exit
If the moving average is decreased its a short signal/long exit.
Curently the strategy has been adapted for long only entries.
If you have any questions let me know !
Weight Gain 4000 - (Adjustable Volume Weighted MA) - [mutantdog]Short Version:
This is a fairly self-contained system based upon a moving average crossover with several unique features. The most significant of these is the adjustable volume weighting system, allowing for transformations between standard and weighted versions of each included MA. With this feature it is possible to apply partial weighting which can help to improve responsiveness without dramatically altering shape. Included types are SMA, EMA, WMA, RMA, hSMA, DEMA and TEMA. Potentially more will be added in future (check updates below).
In addition there are a selection of alternative 'weighted' inputs, a pair of Bollinger-style deviation bands, a separate price tracker and a bunch of alert presets.
This can be used out-of-the-box or tweaked in multiple ways for unusual results. Default settings are a basic 8/21 EMA cross with partial volume weighting. Dev bands apply to MA2 and are based upon the type and the volume weighting. For standard Bollinger bands use SMA with length 20 and try adding a small amount of volume weighting.
A more detailed breakdown of the functionality follows.
Long Version:
ADJUSTABLE VOLUME WEIGHTING
In principle any moving average should have a volume weighted analogue, the standard VWMA is just an SMA with volume weighting for example. Actually, we can consider the SMA to be a special case where volume is a constant 1 per bar (the value is somewhat arbitrary, the important part is that it's constant). Similar principles apply to the 'elastic' EVWMA which is the volume weighted analogue of an RMA. In any case though, where we have standard and weighted variants it is possible to transform one into the other by gradually increasing or decreasing the weighting, which forms the basis of this system. This is not just a simple multiplier however, that would not work due to the relative proportions being the same when set at any non zero value. In order to create a meaningful transformation we need to use an exponent instead, eg: volume^x , where x is a variable determined in this case by the 'volume' parameter. When x=1, the full volume weighting applies and when x=0, the volume will be reduced to a constant 1. Values in between will result in the respective partial weighting, for example 0.5 will give the square root of the volume.
The obvious question here though is why would you want to do this? To answer that really it is best to actually try it. The advantages that volume weighting can bring to a moving average can sometimes come at the cost of unwanted or erratic behaviour. While it can tend towards much closer price tracking which may be desirable, sometimes it needs moderating especially in markets with lower liquidity. Here the adjustability can be useful, in many cases i have found that adding a small amount of volume weighting to a chosen MA can help to improve its responsiveness without overpowering it. Another possible use case would be to have two instances of the same MA with the same length but different weightings, the extent to which these diverge from each other can be a useful indicator of trend strength. Other uses will become apparent with experimentation and can vary from one market to another.
THE INCLUDED MODES
At the time of publication, there are 7 included moving average types with plans to add more in future. For now here is a brief explainer of what's on offer (continuing to use x as shorthand for the volume parameter), starting with the two most common types.
SMA: As mentioned above this is essentially a standard VWMA, calculated here as sma(source*volume^x,length)/sma(volume^x,length). In this case when x=0 then volume=1 and it reduces to a standard SMA.
RMA: Again mentioned above, this is an EVWMA (where E stands for elastic) with constant weighting. Without going into detail, this method takes the 1/length factor of an RMA and replaces it with volume^x/sum(volume^x,length). In this case again we can see that when x=0 then volume=1 and the original 1/length factor is restored.
EMA: This follows the same principle as the RMA where the standard 2/(length+1) factor is replaced with (2*volume^x)/(sum(volume^x,length)+volume^x). As with an RMA, when x=0 then volume=1 and this reduces back to the standard 2/(length+1).
DEMA: Just a standard Double EMA using the above.
TEMA: Likewise, a standard Triple EMA using the above.
hSMA: This is the same as the SMA except it uses harmonic mean calculations instead of arithmetic. In most cases the differences are negligible however they can become more pronounced when volume weighting is introduced. Furthermore, an argument can be made that harmonic mean calculations are better suited to downtrends or bear markets, in principle at least.
WMA: Probably the most contentious one included. Follows the same basic calculations as for the SMA except uses a WMA instead. Honestly, it makes little sense to combine both linear and volume weighting in this manner, included only for completeness and because it can easily be done. It may be the case that a superior composite could be created with some more complex calculations, in which case i may add that later. For now though this will do.
An additional 'volume filter' option is included, which applies a basic filter to the volume prior to calculation. For types based around the SMA/VWMA system, the volume filter is a WMA-4, for types based around the RMA/EVWMA system the filter is a RMA-2.
As and when i add more they will be listed in the updates at the bottom.
WEIGHTED INPUTS
The ohlc method of source calculations is really a leftover from a time when data was far more limited. Nevertheless it is still the method used in charting and for the most part is sufficient. Often the only important value is 'close' although sometimes 'high' and 'low' can be relevant also. Since we are volume weighting however, it can be useful to incorporate as much information as possible. To that end either 'hlc3' or 'hlcc4' tend to be the best of the defaults (in the case of 24/7 charting like crypto or intraday trading, 'ohlc4' should be avoided as it is effectively the same as a lagging version of 'hlcc4'). There are many other (infinitely many, in fact) possible combinations that can be created, i have included a few here.
The premise is fairly straightforward, by subtracting one value from another, the remaining difference can act as a kind of weight. In a simple case consider 'hl2' as simply the midrange ((high+low)/2), instead of this using 'high+low-open' would give more weight to the value furthest from the open, providing a good estimate of the median. An even better estimate can be achieved by combining that with 'high+low-close' to give the included result 'hl-oc2'. Similarly, 'hlc3' can be considered the basic mean of the three significant values, an included weighted version 'hlc2-o2' combines a sum with subtraction of open to give an estimated mean that may be more accurate. Finally we can apply a similar principle to the close, by subtracting the other values, this one potentially gets more complex so the included 'cc-ohlc4' is really the simplest. The result here is an overbias of the close in relation to the open and the midrange, while in most cases not as useful it can provide an estimate for the next bar assuming that the trend continues.
Of the three i've included, hlc2-o2 is in my opinion the most useful especially in this context, although it is perhaps best considered to be experimental in nature. For that reason, i've kept 'hlcc4' as the default for both MAs.
Additionally included is an 'aux input' which is the standard TV source menu and, where possible, can be set as outputs of other indicators.
THE SYSTEM
This one is fairly obvious and straightforward. It's just a moving average crossover with additional deviation (bollinger) bands. Not a lot to explain here as it should be apparent how it works.
Of the two, MA1 is considered to be the fast and MA2 is considered to be the slow. Both can be set with independent inputs, types and weighting. When MA1 is above, the colour of both is green and when it's below the colour of both is red. An additional gradient based fill is there and can be adjusted along with everything else in the visuals section at the bottom. Default alerts are available for crossover/crossunder conditions along with optional marker plots.
MA2 has the option for deviation bands, these are calculated based upon the MA type used and volume weighted according to the main parameter. In the case of a unweighted SMA being used they will be standard Bollinger bands.
An additional 'source direct' price tracker is included which can be used as the basis for an alert system for price crossings of bands or MAs, while taking advantage of the available weighted inputs. This is displayed as a stepped line on the chart so is also a good way to visualise the differences between input types.
That just about covers it then. The likelihood is that you've used some sort of moving average cross system before and are probably still using one or more. If so, then perhaps the additional functionality here will be of benefit.
Thanks for looking, I welcome any feedack
Profitable Contrarian scalpingUses the 5 period and 10 period VMWAs that have been smoothed with a 5 period SMA of the close price. Normally, a short crossover long formation signals a buy signal, but as scalpers know, the 1 minute chart moves so fast and with so much volatility that lagging indicators get wrecked by the market. According, this strategy operates under the assumption that by the time this lagging indicator makes a signal, the price is ready to reverse. Losses are taken swiftly in the case of a continuation pattern. This indicator averages a 55-65% profitable rate and is almost always a positive P/L on the 1 minute chart of the most commonly traded assets.
Of course, there may be validity for this indicator outside the 1 minute chart, but I have found such success to be very limited. Accordingly, use this indicator on SPY, TQQQ, TSLA, AMZN, and major cryptos on the 1 min chart.
TriautoETF(TQQQ) Short Strategy B1○ Objective.
This is a strategy for the TQQQ NASDAQ:TQQQ short strategy in the TriAuto ETF .
It is used as a hedging short rather than for profit-making purposes.
Entry and close points are indicated.
○ Strategy
The strategy is to hold a short position when the price falls below the moving average line, which is a market-conscious line that is rarely broken.
The close (settlement) is determined by using the moving average.
The moving average is based on the market-conscious QQQ NASDAQ:QQQ .
This script is used on the daily chart of the TQQQ.
It works as a hedge for long positions because open interest is held even at the major bottoms of the China and Corona shocks.
The system is set up to quickly cut its losses even if the moving average is "tricked" into falling below the moving average.
Chips Average Line (volume price) by RSUThis is a very important volume-price indicator for me.
Displays the average cost of chips for the short term (30 days), medium term (60 days), and long term (200 days).
Chip lines act as support and resistance. The longer the trend days, the greater the strength.
usage:
1. Breakout: If the stock rises, it must be above the short-term chip line. And gradually rise.
2. Sequence: When a bullish trend is formed, the short-term stack is higher than the mid-term stack, and the mid-flag stack is higher than the long-term stack. When there is a bear trend, the order is reversed.
3. Intensive: When the three chip lines are dense, there will be a periodical resonance effect, and the long-term trend will rise or fall sharply
Dashed Line Moving AveragesHere's a simple script which i concocted using ideas from various authors with the goal of creating a slightly better Moving Average dashed line script imo...I think i managed to do just that and a bit more.. =)
Features:
- Contains one of each VWMA SMA EMA. You can set the input length.
- Ability to set spacing between characters of the plotted moving average line
- Horizontal offset of the moving average lines (just in case)
- Can add any fancy characters that suits your taste e.g ( . , _ , -, !, *, rocket, lava, etc) to the moving average
- If you duplicate the script and modify the "Size" parameter of the plotchar() function's variables with the choices provided in the commented-out code; you can have some fun!
This script is for entertainment & educational purposes only.
EMAs Daily ResetThis indicator displays 3 EMAs that recalculate every day.
This is useful for intraday trading by removing the bias of the previous day's ema price. This ensures your EMAs stay near the most current price action.
Note: If your length is larger than the number of bars in the day, your EMAs will not have time to properly catch up in the day.
Titan EMA Averaging Strategy - (DYOR) By MrCryptoTitan EMA Averaging Strategy (VIP Only) Enable Longs or Shorts only Works With Crypto + Forex with correct back tested settings This is not set and forget. This requires you to back test and have relevant Risk Management in place.
The Strategy: The script uses 3EMA with engulfing candle to enter a trade in either short or long direction.
You will need to test the settings and adjust them so there isn't too many - re-entries and make sure you take profit big enough to not trigger on same candle.
When setting alerts you can use once per bar however this may trigger multiple alerts if the candle is moving very fast so this is not recommended. So doing once per bar close will mean entry is confirmed as bar is closed. You will need to select this in drop down menu.
- Max Trade Limit.
- All in one Alert. - Basically add syntax for example- Long/Take Profit/Re-entry/Emergency Stop. Then add one alert and select "Alert() function calls Only" Change Alert name to custom. That's it.
-Built-in Strategy tester.
- Trade Filter - Multi-MA Filters. - MA", "EMA", "WMA", "HullMA", "VWMA", "RMA", "DEMA", "TEMA", VWAP
- ADX Filter based on Level.
Please note when running this strategy you can only trade longs only or shorts only for this setup to be potentially profitable. Also note that setting unrealistic profit targets will make a loss. So it is very important to back test everything.
This Script does not use any Security functions. All indicators which are used part of the strategy are obtained from Trading View indicator Library and have source code has been changed to make this into Strategy.
Please Do Your Own Research before using this.
Anymore information please DM me directly
Buff Averages [CC]The Buff Averages were created by Buff Dormeier (Stocks and Commodities Feb 2001) and this is another hidden gem that is a combo of a volume weighted indicator and a moving average crossover system. It uses a special method to calculate the weighting based on volume. The colored line (fast buff) will follow the price closely and you use the other line to act as a trend confirmation. I have included strong buy and sell signals in addition to normal ones so strong signals are darker in color and normal signals are lighter in color. Buy when the line turns green and sell when it turns red.
Let me know if there are any other indicators or scripts you would like to see me publish!
WAP Maverick - (Dual EMA Smoothed VWAP) - [mutantdog]Short Version:
This here is my take on the popular VWAP indicator with several novel features including:
Dual EMA smoothing.
Arithmetic and Harmonic Mean plots.
Custom Anchor feat. Intraday Session Sizes.
2 Pairs of Bands.
Side Input for Connection to other Indicator.
This can be used 'out of the box' as a replacement VWAP, benefitting from smoother transitions and easy-to-use custom alerts.
By design however, this is intended to be a highly customisable alternative with many adjustable parameters and a pseudo-modular input system to connect with another indicator. Well suited for the tweakers around here and those who like to get a little more creative.
I made this primarily for crypto although it should work for other markets. Default settings are best suited to 15m timeframe - the anchor of 1 week is ideal for crypto which often follows a cyclical nature from Monday through Sunday. In 15m, the default ema length of 21 means that the wap comes to match a standard vwap towards the end of Monday. If using higher chart timeframes, i recommend decreasing the ema length to closely match this principle (suggested: for 1h chart, try length = 8; for 4h chart, length = 2 or 3 should suffice).
Note: the use of harmonic mean calculations will cause problems on any data source incorporating both positive and negative values, it may also return unusable results on extremely low-value charts (eg: low-sat coins in /btc pairs).
Long version:
The development of this project was one driven more by experimentation than a specific end-goal, however i have tried to fine-tune everything into a coherent usable end-product. With that in mind then, this walkthrough will follow something of a development chronology as i dissect the various functions.
DUAL-EMA SMOOTHING
At its core this is based upon / adapted from the standard vwap indicator provided by TradingView although I have modified and changed most of it. The first mod is the dual ema smoothing. Rather than simply applying an ema to the output of the standard vwap function, instead i have incorporated the ema in a manner analogous to the way smas are used within a standard vwma. Sticking for now with the arithmetic mean, the basic vwap calculation is simply sum(source * volume) / sum(volume) across the anchored period. In this case i have simply applied an ema to each of the numerator and denominator values resulting in ema(sum(source * volume)) / ema(sum(volume)) with the ema length independent of the anchor. This results in smoother (albeit slower) transitions than the aforementioned post-vwap method. Furthermore in the case when anchor period is equal to current timeframe, the result is a basic volume-weighted ema.
The example below shows a standard vwap (1week anchor) in blue, a 21-ema applied to the vwap in purple and a dual-21-ema smoothed wap in gold. Notably both ema types come to effectively resemble the standard vwap after around 24 hours into the new anchor session but how they behave in the meantime is very different. The dual-ema transitions quite gradually while the post-vwap ema immediately sets about trying to catch up. Incidentally. a similar and slower variation of the dual-ema can be achieved with dual-rma although i have not included it in this indicator, attempted analogues using sma or wma were far less useful however.
STANDARD DEVIATION AND BANDS
With this updated calculation, a corresponding update to the standard deviation is also required. The vwap has its own anchored volume-weighted st.dev but this cannot be used in combination with the ema smoothing so instead it has been recalculated appropriately. There are two pairs of bands with separate multipliers (stepped to 0.1x) and in both cases high and low bands can be activated or deactivated individually. An example usage for this would be to create different upper and lower bands for profit and stoploss targets. Alerts can be set easily for different crossing conditions, more on this later.
Alongside the bands, i have also added the option to shift ('Deviate') the entire indicator up or down according to a multiple of the corrected st.dev value. This has many potential uses, for example if we want to bias our analysis in one direction it may be useful to move the wap in the opposite. Or if the asset is trading within a narrow range and we are waiting on a breakout, we could shift to the desired level and set alerts accordingly. The 'Deviate' parameter applies to the entire indicator including the bands which will remain centred on the main WAP.
CUSTOM (W)ANCHOR
Ever thought about using a vwap with anchor periods smaller than a day? Here you can do just that. I've removed the Earnings/Dividends/Splits options from the basic vwap and added an 'Intraday' option instead. When selected, a custom anchor length can be created as a multiple of minutes (default steps of 60 mins but can input any value from 0 - 1440). While this may not seem at first like a useful feature for anyone except hi-speed scalpers, this actually offers more interesting potential than it appears.
When set to 0 minutes the current timeframe is always used, turning this into the basic volume-weighted ema mentioned earlier. When using other low time frames the anchor can act as a pre-ema filter creating a stepped effect akin to an adaptive MA. Used in combination with the bands, the result is a kind of volume-weighted adaptive exponential bollinger band; if such a thing does not already exist then this is where you create it. Alternatively, by combining two instances you may find potential interesting crosses between an intraday wap and a standard timeframe wap. Below is an example set to intraday with 480 mins, 2x st.dev bands and ema length 21. Included for comparison in purple is a standard 21 ema.
I'm sure there are many potential uses to be found here, so be creative and please share anything you come up with in the comments.
ARITHMETIC AND HARMONIC MEAN CALCULATIONS
The standard vwap uses the arithmetic mean in its calculation. Indeed, most mean calculations tend to be arithmetic: sma being the most widely used example. When volume weighting is involved though this can lead to a slight bias in favour of upward moves over downward. While the effect of this is minor, over longer anchor periods it can become increasingly significant. The harmonic mean, on the other hand, has the opposite effect which results in a value that is always lower than the arithmetic mean. By viewing both arithmetic and harmonic waps together, the extent to which they diverge from each other can be used as a visual reference of how much price has changed during the anchored period.
Furthermore, the harmonic mean may actually be the more appropriate one to use during downtrends or bearish periods, in principle at least. Consider that a short trade is functionally the same as a long trade on the inverse of the pair (eg: selling BTC/USD is the same as buying USD/BTC). With the harmonic mean being an inverse of the arithmetic then, it makes sense to use it instead. To illustrate this below is a snapshot of LUNA/USDT on the left with its inverse 1/(LUNA/USDT) = USDT/LUNA on the right. On both charts is a wap with identical settings, note the resistance on the left and its corresponding support on the right. It should be easy from this to see that the lower harmonic wap on the left corresponds to the upper arithmetic wap on the right. Thus, it would appear that the harmonic mean should be used in a downtrend. In principle, at least...
In reality though, it is not quite so black and white. Rarely are these values exact in their predictions and the sort of range one should allow for inaccuracies will likely be greater than the difference between these two means. Furthermore, the ema smoothing has already introduced some lag and thus additional inaccuracies. Nevertheless, the symmetry warrants its inclusion.
SIDE INPUT & ALERTS
Finally we move on to the pseudo-modular component here. While TradingView allows some interoperability between indicators, it is limited to just one connection. Any attempt to use multiple source inputs will remove this functionality completely. The workaround here is to instead use custom 'string' input menus for additional sources, preserving this function in the sole 'source' input. In this case, since the wap itself is dependant only price and volume, i have repurposed the full 'source' into the second 'side' input. This allows for a separate indicator to interact with this one that can be used for triggering alerts. You could even use another instance of this one (there is a hidden wap:mid plot intended for this use which is the midpoint between both means). Note that deleting a connected indicator may result in the deletion of those connected to it.
Preset alertconditions are available for crossings of the side input above and below the main wap, alongside several customisable alerts with corresponding visual markers based upon selectable conditions. Alerts for band crossings apply only to those that are active and only crossings of the type specified within the 'crosses' subsection of the indicator settings. The included options make it easy to create buy alerts specific to certain bands with sell alerts specific to other bands. The chart below shows two instances with differing anchor periods, both are connected with buy and sell alerts enabled for visible bands.
Okay... So that just about covers it here, i think. As mentioned earlier this is the product of various experiments while i have been learning my way around PineScript. Some of those experiments have been branched off from this in order to not over-clutter it with functions. The pseudo-modular design and the 'side' input are the result of an attempt to create a connective framework across various projects. Even on its own though, this should offer plenty of tweaking potential for anyone who likes to venture away from the usual standards, all the while still retaining its core purpose as a traders tool.
Thanks for checking this out. I look forward to any feedback below.
RSI v4 with Bands
Script is extended version of usual RSI script
This script plots VWMA(RSI7) vs EMA(RSI7) under pre-set time frame.
Strategy is to make sure both points remain in the Green zone while entering into BUY position
Use it as indicator not as financial advice.
~ @imbharat
rth vwapPlots the RTH (regular trading hours) VWAP. This is intended for instruments with volume only and mostly for futures. Time zone is set to EST, but start and end times of the VWAP can be configured. Standard setting is set to US equity index futures regular trading hours of 9:30 EST to 16:00 EST.
10X Moving Average Dingue V510X Moving Averages into 1 indicator - This is the updated V5 for PineScript 5
This moving average indicator lets you quickly visualize what is happening with the price.
Color-coded for easy visualization of all 10 MAs at the same time.
Fill in colors that let you see expansion and contraction between MAs and also if MAs are above or under each other plus if they are rising or falling.
10 Different Moving Averages give you full control over how you trade. You can have many long-term trends, mixed in with short-term MA. You can mix and match MA types to give a better idea of what other traders might see, important levels, etc… You can select from a wide range of MA Type: 'SMA', 'SMMA', 'EMA', 'DEMA', 'TEMA', 'WMA', 'VWMA', 'KAMA', 'FRAMA', 'TRIMA', 'ALMA', 'HMA', 'LSMA', 'ZLEMA', 'ViDYA', 'JMA', 'T3'
You can select different settings for EACH MA ie. Their type, length, line size, fill or not.
You can quickly ‘Override’ all MA's types by selecting an Override Type. That way you can quickly keep your settings and compare them with another type.
In the same way, you can turn ON/OFF all 10xMA at the same time with one button.
You can plot a moving average of all the 10x moving averages and plot just that one.
'Tool tips' explain much of the settings but if you have any questions, feel free to ask. Thank you for the feedback and check all my ‘Dingue’ indicators.
Configurable Multi MA Crossover Voting SystemThis strategy goes long when all fast moving averages that you have defined are above their counterpart slow moving averages.
Long position is closed when profit or loss target is hit and at least one of the fast moving averages is below its counterpart slow moving average.
The format of the config is simple. The format is : FASTxSLOW,FASTxSLOW,...
Example : If you want 2 moving averages fast=9,slow=14 and fast=20,slow=50 you define it like this : 9x14,20x50
Another example : 5x10,10x15,15x20 => means 3 moving average setups : first wih fast=5/slow=10, second with fast=10/slow=15, last with fast=15/slow=20
You can chose the type of moving average : SMA, WMA, VWMA (i got issues with EMA/RMA so i removed them)
You can chose the source of the moving average : high, close, hl2 etc.
You can chose the period on which ATR is calculated and ATR profit/loss factors.
Profit is calculated like : buy_price + atr_factor*atr
Loss is calculated like : buy_price - atr_factor*atr
Performance in backtest is variable depending on the timeframe, the options and the market.
Performance in backtest suggests it works better for higher timeframes like 1d, 4h etc.
Disclaimer
Please remember that past performance may not be indicative of future results.
Due to various factors, including changing market conditions, the strategy may no longer perform as well as in historical backtesting.
This post and the script don’t provide any financial advice.
Stochastic RSI rainbow in fibonacci sequence using VWMAThe standard stochastic RSI gives limited information as it only contains two reference lines. This Stochastic RSI rainbow contains more lines in shorter timeframes and progressively fewer as the reference time increase. This is done in a FIB sequence 2,3,8,13,21,34,55.... The shorter timeframes are more reactive to current market conditions indicating recent price action and the longer lines represent more significant periods of time. The indicator uses VWMA for its calculations (volume weighted moving average)
HOW TO USE THIS INDICATOR:
When multiple lines are above, either 70 or 80, you can consider the commodity overbought, or OB. The more lines that are above the threshhold, the more significant the signal. The same is true in inverse. In addition, you can use each cross to signify a buy/sell signal according to the type and quantity of trading you are doing. If you are looking to get in and out quickly you can use the lower timeframe signals.
OPTIONS:
You can change what data is used for the VWMA calculation... Of course, you can select colors and other properties as well.
Cloud Ribbon ++ by [JohnnySnow]Inspired by my favorite EMA ribbon - "EMA Ribbon " by fskrypt.
This Ribbon ADD the option to choose the avarage algorithm of the ribbon .
Created also to be more friendly to read along with trendlines and Fibonacci retracements.
For those like me that NOT use this ribbon to find exact price action but instead, to have a grasp of possible Support/Resistance strenght ahead.
High transparency lines and a configurable color palette for filling the background give the ribbon a look of support/ Resistance cloud Strenght.
Each MA length, line, and background color can be easily configured.
Anaconda Backtest VersionThis is the Anaconda strategy backtest version, no alerts. It will execute orders up to current_date - 2 days.
This is a LONG only strategy.
Anaconda waits for some thresholds to enter long. Once it enters long, it will setup profit and stoploss targets. These targets are updated if some conditions are met. The position is closed when the price hits profit or stoploss targets or when a certain bearish threshold is met.
No portfolio management is integrated. Positions are supposed to be entered with 100% equity and closed at 100%.
The strategy works better for large timeframes : 1h, 2h, 3h, 4h, 1D ...
You can apply the strategy to any symbol supported by TardingView and fine-tune the settings for the selected market/timeframe.
The strategy is supposed to be used on regular candles.
security() function has not been used. No special candles have been used (heikin ashi, renko etc.). Trailing stop (trail_* variables) have not been used.
==================
EXAMPLE SETTINGS
==================
These are the example settings for some assets that make the strategy perform well in the backtest mode.
Settings are listed in order of appearance in the strategy settings dialog in TradingView.
Please note that exaggerated profits for some symbols may come from the fact that the minimum ticker size of that symbol has been increased (from 0.0001 to 0.001 for example) between the start date and end date of the backtest. So you will see some trades closing outside the candle's ohlc range. Unfortunately, this is a limitation in TV and can't do much about it.
BNB/USDT (4h) : 11,5,1,3,10,4,1,4,5,200,6,2,19 (rsi threshold = 50)
FTM/USDT (1h) : 11,8,3,4,5,5,1,5,7,400,5,3,20 (rsi threshold=50)
ETH/USDT (4h) : 11,5,1,3,2,5,1,4,3,200,4,3,20 (rsi threshold = 68)
MATIC/USDT (1h) : 9,10,3,4,6,7,1,6,7,200,2,5,18 (rsi threshold = 70)
DASH/USDT (4h) : 8,8,3,3,4,4,1,7,5,200,3,2,21 (no rsi)
BAT/USDT (4h) : 8,8,3,3,7,7,1,8,6,200,3,2,21 (rsi threshold = 40)
BAT/USDT (1h) : 9,9,3,6,6,7,1,7,7,300,6,4,21 (no rsi)
DOGE/USDT (1h) : 11,8,3,4,4,9,1,4,6,200,3,2,18 (rsi thresold = 70)
NKN/USDT (1h) : 6,7,3,4,2,8,3,5,8,200,6,3,15 (rsi threshold = 50)
BTC/USDT (4h) : 6,5,3,4,7,6,5,5,6,200,2,3,15 (no rsi)
BTC/USDT (3h) : 6,5,3,4,7,5,1,6,4,300,2,2,17 (no rsi)
Monthly Returns in Strategies with Market BenchmarkThis is a modified version of this excellent script Monthly Returns in PineScript Strategues by QuantNomad
I liked and used the script but wanted to see how strategy performed vs market on each month/year. So I am sharing back.
The modification consists in adding Market or Buy & Hold performance between parenthesis inside each cell to better see how strategy performed vs market.
Also, 3 red levels and 3 green levels have been used :
For green :
1/ Light when strategy pnl > 0 but < market
2/ medium when strategy pnl > 0 and > market
3/ Dark when strategy pnl > 0 and market < 0 or pnl > market x 2
Same logic in the opposite direction for red.
The strategy provided here is just a showcase of how to use the table in pine script.
Disclaimer
Please remember that past performance may not be indicative of future results.
Due to various factors, including changing market conditions, the strategy may no longer perform as well as in historical backtesting.
This post and the script don’t provide any financial advice.