Educational

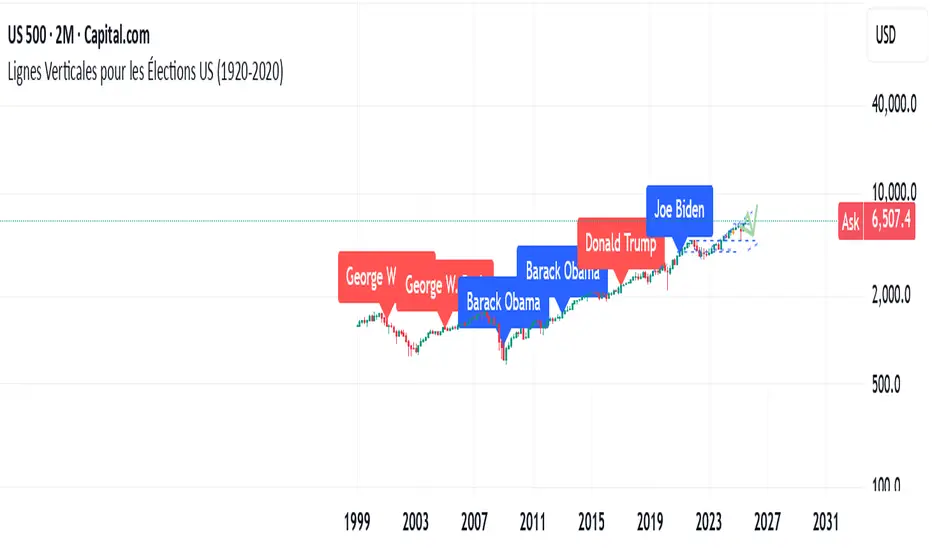
US Elections Democrate-Republicain (1920-2025)This script shows the different U.S. presidents and indicates whether each was Democratic or Republican. It allows users to analyze the market based on the president in office.
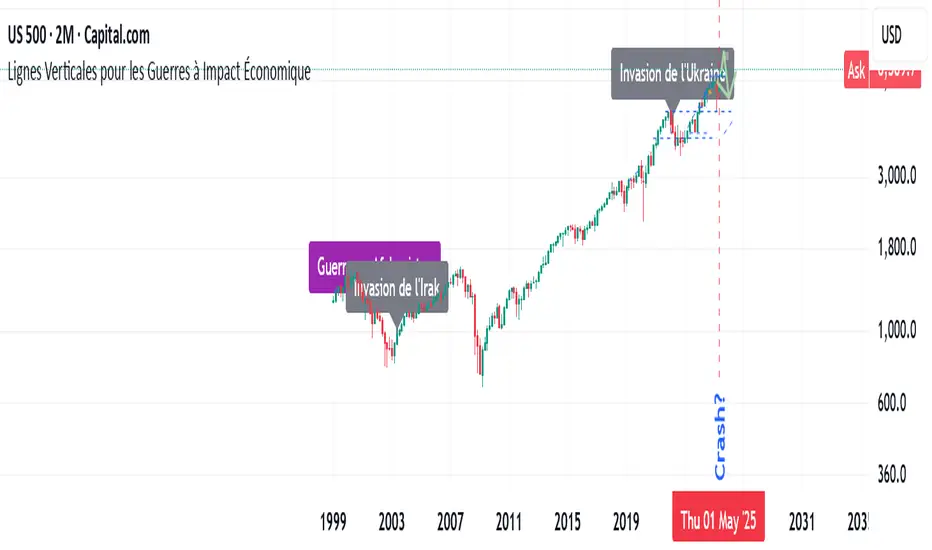
Major Wars with a signifiant economic impactThis indicator highlights major wars that have had a significant economic impact worldwide. It allows users to easily see their effects on the charts.
Dow Theory Indicator## 🎯 Key Features of the Indicator
### 📈 Complete Implementation of Dow Theory
- Three-tier trend structure: primary trend (50 periods), secondary trend (20 periods), and minor trend (10 periods).
- Swing point analysis: automatically detects critical swing highs and lows.
- Trend confirmation mechanism: strict confirmation logic based on consecutive higher highs/higher lows or lower highs/lower lows.
- Volume confirmation: ensures price moves are supported by trading volume.
### 🕐 Flexible Timeframe Parameters
All key parameters are adjustable, making it especially suitable for U.S. equities:
Trend analysis parameters:
- Primary trend period: 20–200 (default 50; recommended 50–100 for U.S. stocks).
- Secondary trend period: 10–100 (default 20; recommended 15–30 for U.S. stocks).
- Minor trend period: 5–50 (default 10; recommended 5–15 for U.S. stocks).
Dow Theory parameters:
- Swing high/low lookback: 5–50 (default 10).
- Trend confirmation bar count: 1–10 (default 3).
- Volume confirmation period: 10–100 (default 20).
### 🇺🇸 U.S. Market Optimizations
- Session awareness: distinguishes Regular Trading Hours (9:30–16:00 EST) from pre-market and after-hours.
- Pre/post-market weighting: adjustable weighting factor for signals during extended hours.
- Earnings season filter: automatically adjusts sensitivity during earnings periods.
- U.S.-optimized default parameters.
## 🎨 Visualization
1. Trend lines: three differently colored trend lines.
2. Background fill: green (uptrend) / red (downtrend) / gray (neutral).
3. Signal markers: arrows, labels, and warning icons.
4. Swing point markers: small triangles at key turning points.
5. Info panel: real-time display of eight key metrics.
## 🚨 Alert System
- Trend turning to up/down.
- Strong bullish/bearish signals (dual confirmation).
- Volume divergence warning.
- New swing high/low formed.
## 📋 How to Use
1. Open the Pine Editor in TradingView.
2. Copy the contents of dow_theory_indicator.pine.
3. Paste and click “Add to chart.”
4. Adjust parameters based on trading style:
- Long-term investing: increase all period parameters.
- Swing trading: use the default parameters.
- Short-term trading: decrease all period parameters.
## 💡 Parameter Tips for U.S. Stocks
- Large-cap blue chips (AAPL, MSFT): primary 60–80, secondary 25–30.
- Mid-cap growth stocks: primary 40–60, secondary 18–25.
- Small-cap high-volatility stocks: primary 30–50, secondary 15–20.

CAP - KC/AC 2.20462 Converter// ───────────────────────────────────────────────────────────────────────────────
// Purpose: Conversion Indicator for ICE “C” (KC) and “C Metric” (AC) Contracts
//
// Background:
// - The Intercontinental Exchange (ICE) is phasing out the legacy Coffee “C” contract (symbol: KC),
// which has been quoted in U.S. cents per pound, and replacing it with the new Coffee “C Metric” contract (symbol: AC),
// quoted in U.S. dollars per metric ton :contentReference {index=0}.
// - The final KC futures expire in March 2028; AC contracts begin trading in September 2025 and use modern specifications
// including pricing per metric ton and flexible bulk delivery formats :contentReference {index=1}.
//
// Why this script matters:
// - Traders are accustomed to the KC pricing format (¢/lb); the AC contract’s USD/MT may create confusion.
// - This indicator visually converts the current chart price—whether from KC or AC contracts—directly into its equivalent unit,
// helping traders quickly assess parity and compare trends across both contract types.
// - It simplifies head-to-head comparison during this transition period, improving clarity on chart price behavior.
//
// Usage instructions:
// - If the symbol starts with "KC", the script divides the price by 2.20462 to convert from ¢/lb to approximate ¢/kg.
// - If the symbol starts with "AC", the script multiplies the price by 2.20462 to reverse the conversion.
// - The results (converted values) are displayed in a table for immediate visual clarity.
// ───────────────────────────────────────────────────────────────────────────────
Artharjan ADXArtharjan ADX (AADX) by Rrahul Desai @Artharjan
📌 Overview
The Artharjan ADX (AADX) is an advanced implementation of the Average Directional Index (ADX) with customizable moving averages, momentum thresholds, and visually intuitive grading of bullish and bearish strength.
Unlike the standard ADX indicator that only shows trend strength, AADX adds graded bullish/bearish conditions, alerts, smoothed DI signals, histogram visualizations, and background color fills to help traders quickly interpret market conditions.
It is designed for traders who want early detection of trend strength, clean visual cues, and automated alert triggers for both bullish and bearish momentum setups.
⚙️ Key Features
🔹 Customizable Calculations
DI Length (default 13) – controls sensitivity of directional indicators.
+/- DI Smoothing – smooths DI signals with user-selected MA.
Multiple Moving Average Types – SMA, EMA, WMA, RMA, VWMA, ALMA, Hull, SWMA, SMMA, TMA.
ADX Smoothing – define how smooth/fast the ADX reacts.
🔹 Flexible Display
Toggle between line plots or histogram view.
Adjustable plot thickness.
Option to plot averages of ADX, +DI, -DI for confirmation.
Configurable background fills:
ADX above/below momentum threshold.
ADX rising/falling color shading.
Trend-grade based color intensity.
🔹 Momentum & Thresholds
Momentum Level (default 25) → defines “strong trend” zone.
Crossover Threshold (default 15) → helps detect early DI crossovers.
Color-coded histogram bars for +DI vs -DI difference:
Above/below zero.
Rising/falling momentum.
🔹 Bullish & Bearish Grading System
The indicator assigns grades from 1 to 5 for both bullish and bearish setups, based on DI and ADX conditions:
Bullish Grades
Grade 1 → Very Weak Bullish
Grade 2 → Weak Bullish
Grade 3 → Moderate Bullish
Grade 4 → Strong Bullish
Grade 5 → Very Strong Bullish
Bearish Grades
Grade 1 → Very Weak Bearish
Grade 2 → Weak Bearish
Grade 3 → Moderate Bearish
Grade 4 → Strong Bearish
Grade 5 → Very Strong Bearish
Labels are automatically plotted above bars to indicate the active grade.
🔹 Alerts
Bullish Alert → when +DI crosses above its average below the threshold OR bullish conditions are met.
Bearish Alert → when -DI crosses above its average below the threshold OR bearish conditions are met.
These alerts make it possible to automate trading signals for scalping, intraday, and swing trading.
📊 Use Cases
Trend Strength Measurement
Spot when markets shift from range-bound to trending.
Confirm the reliability of breakouts with strong ADX readings.
Bullish vs Bearish Control
Compare +DI vs -DI strength to gauge trend direction.
Identify trend reversals early with DI slope changes.
Momentum Confirmation
Use ADX rising + DI grades to validate trade entries.
Filter false breakouts with weak ADX.
Trade Grading System
Enter aggressively on Grade 4–5 signals.
Stay cautious on Grade 1–2 signals.
Automated Alerts & Screening
Combine AADX alerts with strategy rules.
Build scanners to highlight strong ADX setups across multiple stocks.
🎯 Trader’s Advantage
More powerful than standard ADX → Adds slope, grading, alerts, and visualization.
Adaptable to any style → Works for intraday scalping, swing trading, and positional analysis.
Visual clarity → Color fills, histograms, and labels simplify decision-making.
Customizable smoothing → Adjusts to fast or slow markets.
✅ Closing Note
The Artharjan ADX (AADX) transforms the traditional ADX into a complete trend and momentum analyzer. It helps traders detect, confirm, and act on directional strength with clarity and confidence.
With Thanks,
Rrahul Desai
@Artharjan

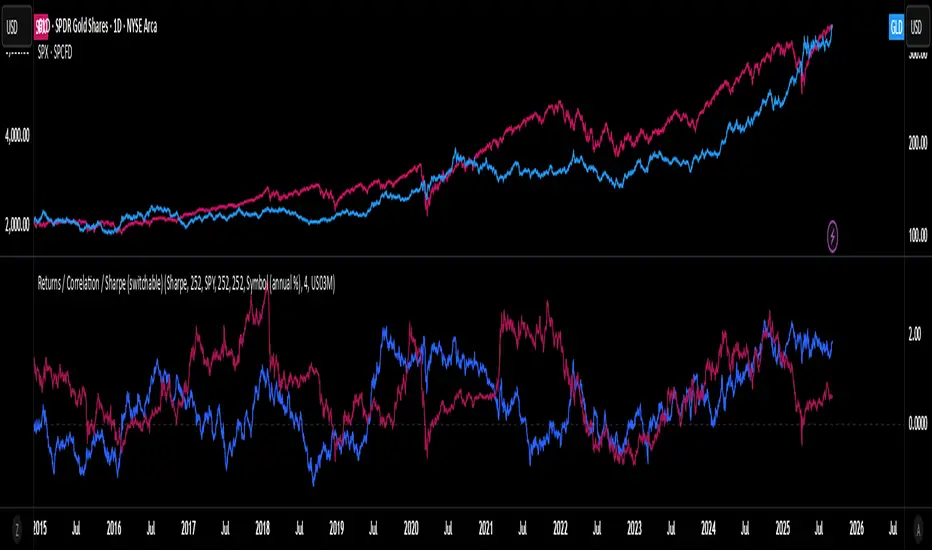
Rolling Performance Toolkit (Returns, Correlation and Sharpe)This script provides a flexible toolkit for evaluating rolling performance metrics between any asset and a benchmark.
Features:
Library-based: Built on a custom utilities library for consistent return and statistics calculations.
Rolling Window Control: Choose the lookback period (in days) to calculate metrics.
Multiple Modes: Toggle between Rolling Returns, Rolling Correlation, and Rolling Sharpe Ratio.
Benchmark Comparison: Compare your selected ticker against a benchmark (default: S&P 500 / SPX), but you can easily switch to any symbol.
Risk-Free Rate Options: Choose from zero, a constant annual % rate, or a proxy symbol (default: US03M – 3-Month Treasury Yield).
Annualized Sharpe: Sharpe ratios are annualized by default (×√252) for intuitive interpretation.
This tool is useful for traders and investors who want to monitor relative performance, diversification benefits, or risk-adjusted returns over time.
RSI+MA by RAThis Indicator generates buy and sell signal on the crossover of RSI and MA, HTF RSI is also plotted for HTF trend.

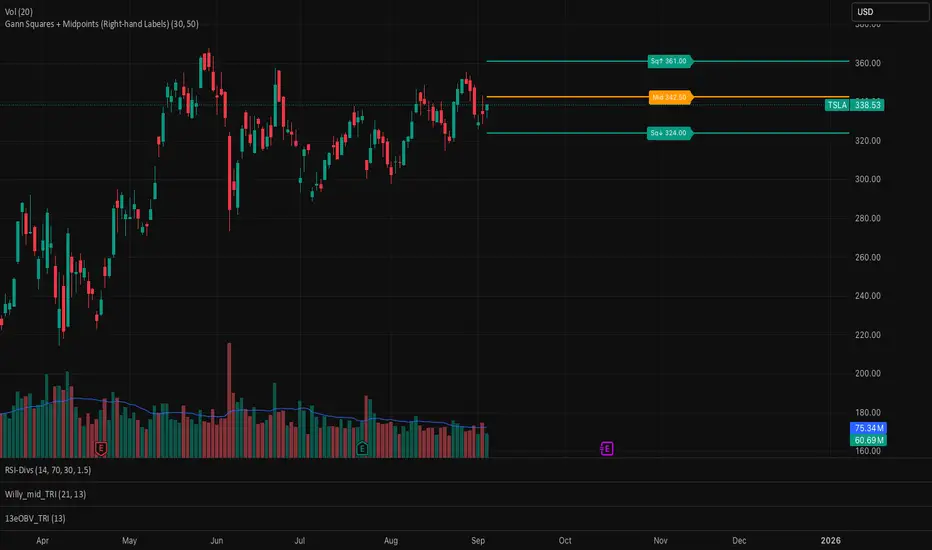
Gann Squares + Midpoints It gives Gann Square and a midpoint closest to the price which act as support and resistance
High For Loop | MisinkoMasterThe High For Loop is a new Trend Following tool designed to give traders smooth and fast signals without being too complex, overfit or repainting.
It works by finding how many bars have a higher high than the current high, how many have a lower high, and scores it based on that. This provides users with easy and accurate signals, allowing for gaining a large edge in the market.
It is pretty simple but you can still play around with it pretty well and improve uppon your strategies.
For any backtests using strategies, I left many comments and tried to make it as easy as possible to backtest.
Enjoy G´s

Artharjan High Volume Zones v2Artharjan High Volume Zones (AHVZ)
The Artharjan High Volume Zones (AHVZ) indicator is designed to identify, highlight, and track price zones formed during exceptionally high-volume bars. These levels often act as critical support and resistance zones, revealing where institutions or large players have shown significant interest.
By combining both short-term (ST) and long-term (LT) high-volume zones, the tool enables traders to align intraday activity with broader market structures.
Core Purpose
Markets often leave behind footprints in the form of high-volume bars. The AHVZ indicator captures these footprints and projects their influence forward, allowing traders to spot zones of liquidity, accumulation, or distribution where future price reactions are likely.
Key Features
🔹 Short-Term High Volume Zones (ST-ZoI)
Identifies the highest-volume bar within a short-term lookback period (default: 22 bars).
Draws and maintains:
Upper & Lower Bounds of the high-volume candle.
Midpoint Line (M-P) as the zone’s equilibrium.
Buffer Zones above and below for intraday flexibility (percentage-based).
Highlights these zones visually for quick intraday decision-making.
🔹 Long-Term High Volume Zones (LT-ZoI)
Scans for the highest-volume bar in a long-term lookback period (default: 252 bars).
Similar plotting structure as ST-ZoI: Upper, Lower, Midpoint, and Buffers.
Useful for identifying institutional footprints and multi-week/month accumulation zones.
🔹 Dynamic Buffering
Daily/Weekly/Monthly charts: Adds a fixed percentage buffer above and below high-volume zones.
Intraday charts: Uses price-range based buffers, scaling zones more adaptively to volatility.
🔹 Visual Customization
Independent color settings for ST and LT zones, mid-range lines, and buffers.
Adjustable plot thickness for clarity across different chart styles.
How It Helps
Intraday Traders
Use ST zones to pinpoint short-term supply/demand clusters.
Trade rejections or breakouts near these high-volume footprints.
Swing/Positional Traders
Align entries with LT zones to stay on the side of institutional flows.
Spot areas where price may stall, reverse, or consolidate.
General Market Structure Analysis
Understand where volume-backed conviction exists in the chart.
Avoid trading into hidden walls of liquidity by recognizing prior high-volume zones.
Closing Note
The Artharjan High Volume Zones indicator acts as a volume map of the market, giving traders a deeper sense of where meaningful battles between buyers and sellers took place. By combining short-term noise filtering with long-term structural awareness, it empowers traders to make more informed, disciplined decisions.
With Thanks,
Rrahul Desai @Artharjan

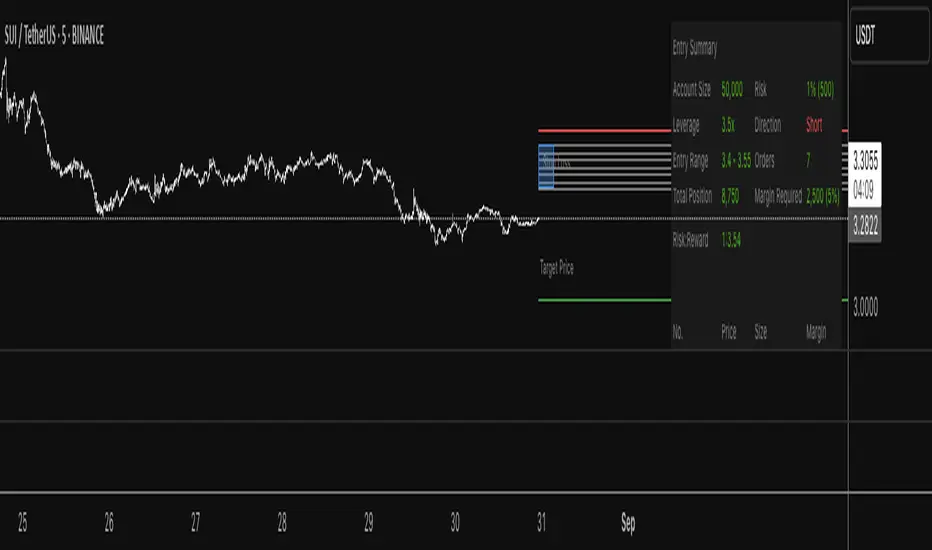
Clean Zone + SL/TP (Latest Only)📌 Description
Clean Zone + SL/TP (Latest Only) is an indicator designed to highlight the most recent supply or demand zone based on pivot highs/lows, and automatically plot entry, stop loss, and multiple take profit levels.
🔹 Automatic Direction Detection
The script can auto-detect trade direction (Long/Short) using pivot logic, or you can override manually.
🔹 Zone Drawing
Only the latest valid supply (red) or demand (green) zone is displayed.
Zones are extended to the right for a customizable number of bars.
🔹 Entry / SL / TP Levels
Entry, Stop Loss, and TP1/TP2/TP3 levels are plotted automatically.
Targets can be calculated either by zone size or by ATR-based multiples.
Risk/Reward ratios are fully adjustable.
🔹 Customizable Display
Toggle visibility for zones (box), entry/SL/TP lines, and price labels.
Labels show only on the latest bar for a clean chart look.
🎯 Use Case
This tool helps traders quickly identify the cleanest and most recent supply/demand setup and manage trades with predefined risk/reward targets. It’s especially useful for price action traders and those who prefer simple, uncluttered charts.

Martingale Strategy Simulator [BackQuant]Martingale Strategy Simulator
Purpose
This indicator lets you study how a martingale-style position sizing rule interacts with a simple long or short trading signal. It computes an equity curve from bar-to-bar returns, adapts position size after losing streaks, caps exposure at a user limit, and summarizes risk with portfolio metrics. An optional Monte Carlo module projects possible future equity paths from your realized daily returns.
What a martingale is
A martingale sizing rule increases stake after losses and resets after a win. In its classical form from gambling, you double the bet after each loss so that a single win recovers all prior losses plus one unit of profit. In markets there is no fixed “even-money” payout and returns are multiplicative, so an exact recovery guarantee does not exist. The core idea is unchanged:
Lose one leg → increase next position size
Lose again → increase again
Win → reset to the base size
The expectation of your strategy still depends on the signal’s edge. Sizing does not create positive expectancy on its own. A martingale raises variance and tail risk by concentrating more capital as a losing streak develops.
What it plots
Equity – simulated portfolio equity including compounding
Buy & Hold – equity from holding the chart symbol for context
Optional helpers – last trade outcome, current streak length, current allocation fraction
Optional diagnostics – daily portfolio return, rolling drawdown, metrics table
Optional Monte Carlo probability cone – p5, p16, p50, p84, p95 aggregate bands
Model assumptions
Bar-close execution with no slippage or commissions
Shorting allowed and frictionless
No margin interest, borrow fees, or position limits
No intrabar moves or gaps within a bar (returns are close-to-close)
Sizing applies to equity fraction only and is capped by your setting
All results are hypothetical and for education only.
How the simulator applies it
1) Directional signal
You pick a simple directional rule that produces +1 for long or −1 for short each bar. Options include 100 HMA slope, RSI above or below 50, EMA or SMA crosses, CCI and other oscillators, ATR move, BB basis, and more. The stance is evaluated bar by bar. When the stance flips, the current trade ends and the next one starts.
2) Sizing after losses and wins
Position size is a fraction of equity:
Initial allocation – the starting fraction, for example 0.15 means 15 percent of equity
Increase after loss – multiply the next allocation by your factor after a losing leg, for example 2.00 to double
Reset after win – return to the initial allocation
Max allocation cap – hard ceiling to prevent runaway growth
At a high level the size after k consecutive losses is
alloc(k) = min( cap , base × factor^k ) .
In practice the simulator changes size only when a leg ends and its PnL is known.
3) Equity update
Let r_t = close_t / close_{t-1} − 1 be the symbol’s bar return, d_{t−1} ∈ {+1, −1} the prior bar stance, and a_{t−1} the prior bar allocation fraction. The simulator compounds:
eq_t = eq_{t−1} × (1 + a_{t−1} × d_{t−1} × r_t) .
This is bar-based and avoids intrabar lookahead. Costs, slippage, and borrowing costs are not modeled.
Why traders experiment with martingale sizing
Mean-reversion contexts – if the signal often snaps back after a string of losses, adding size near the tail of a move can pull the average entry closer to the turn
Behavioral or microstructure edges – some rules have modest edge but frequent small whipsaws; size escalation may shorten time-to-recovery when the edge manifests
Exploration and stress testing – studying the relationship between streaks, caps, and drawdowns is instructive even if you do not deploy martingale sizing live
Why martingale is dangerous
Martingale concentrates capital when the strategy is performing worst. The main risks are structural, not cosmetic:
Loss streaks are inevitable – even with a 55 percent win rate you should expect multi-loss runs. The probability of at least one k-loss streak in N trades rises quickly with N.
Size explodes geometrically – with factor 2.0 and base 10 percent, the sequence is 10, 20, 40, 80, 100 (capped) after five losses. Without a strict cap, required size becomes infeasible.
No fixed payout – in gambling, one win at even odds resets PnL. In markets, there is no guaranteed bounce nor fixed profit multiple. Trends can extend and gaps can skip levels.
Correlation of losses – losses cluster in trends and in volatility bursts. A martingale tends to be largest just when volatility is highest.
Margin and liquidity constraints – leverage limits, margin calls, position limits, and widening spreads can force liquidation before a mean reversion occurs.
Fat tails and regime shifts – assumptions of independent, Gaussian returns can understate tail risk. Structural breaks can keep the signal wrong for much longer than expected.
The simulator exposes these dynamics in the equity curve, Max Drawdown, VaR and CVaR, and via Monte Carlo sketches of forward uncertainty.
Interpreting losing streaks with numbers
A rough intuition: if your per-trade win probability is p and loss probability is q=1−p , the chance of a specific run of k consecutive losses is q^k . Over many trades, the chance that at least one k-loss run occurs grows with the number of opportunities. As a sanity check:
If p=0.55 , then q=0.45 . A 6-loss run has probability q^6 ≈ 0.008 on any six-trade window. Across hundreds of trades, a 6 to 8-loss run is not rare.
If your size factor is 1.5 and your base is 10 percent, after 8 losses the requested size is 10% × 1.5^8 ≈ 25.6% . With factor 2.0 it would try to be 10% × 2^8 = 256% but your cap will stop it. The equity curve will still wear the compounded drawdown from the sequence that led to the cap.
This is why the cap setting is central. It does not remove tail risk, but it prevents the sizing rule from demanding impossible positions
Note: The p and q math is illustrative. In live data the win rate and distribution can drift over time, so real streaks can be longer or shorter than the simple q^k intuition suggests..
Using the simulator productively
Parameter studies
Start with conservative settings. Increase one element at a time and watch how the equity, Max Drawdown, and CVaR respond.
Initial allocation – lower base reduces volatility and drawdowns across the board
Increase factor – set modestly above 1.0 if you want the effect at all; doubling is aggressive
Max cap – the most important brake; many users keep it between 20 and 50 percent
Signal selection
Keep sizing fixed and rotate signals to see how streak patterns differ. Trend-following signals tend to produce long wrong-way streaks in choppy ranges. Mean-reversion signals do the opposite. Martingale sizing interacts very differently with each.
Diagnostics to watch
Use the built-in metrics to quantify risk:
Max Drawdown – worst peak-to-trough equity loss
Sharpe and Sortino – volatility and downside-adjusted return
VaR 95 percent and CVaR – tail risk measures from the realized distribution
Alpha and Beta – relationship to your chosen benchmark
If you would like to check out the original performance metrics script with multiple assets with a better explanation on all metrics please see
Monte Carlo exploration
When enabled, the forecast draws many synthetic paths from your realized daily returns:
Choose a horizon and a number of runs
Review the bands: p5 to p95 for a wide risk envelope; p16 to p84 for a narrower range; p50 as the median path
Use the table to read the expected return over the horizon and the tail outcomes
Remember it is a sketch based on your recent distribution, not a predictor
Concrete examples
Example A: Modest martingale
Base 10 percent, factor 1.25, cap 40 percent, RSI>50 signal. You will see small escalations on 2 to 4 loss runs and frequent resets. The equity curve usually remains smooth unless the signal enters a prolonged wrong-way regime. Max DD may rise moderately versus fixed sizing.
Example B: Aggressive martingale
Base 15 percent, factor 2.0, cap 60 percent, EMA cross signal. The curve can look stellar during favorable regimes, then a single extended streak pushes allocation to the cap, and a few more losses drive deep drawdown. CVaR and Max DD jump sharply. This is a textbook case of high tail risk.
Strengths
Bar-by-bar, transparent computation of equity from stance and size
Explicit handling of wins, losses, streaks, and caps
Portable signal inputs so you can A–B test ideas quickly
Risk diagnostics and forward uncertainty visualization in one place
Example, Rolling Max Drawdown
Limitations and important notes
Martingale sizing can escalate drawdowns rapidly. The cap limits position size but not the possibility of extended adverse runs.
No commissions, slippage, margin interest, borrow costs, or liquidity limits are modeled.
Signals are evaluated on closes. Real execution and fills will differ.
Monte Carlo assumes independent draws from your recent return distribution. Markets often have serial correlation, fat tails, and regime changes.
All results are hypothetical. Use this as an educational tool, not a production risk engine.
Practical tips
Prefer gentle factors such as 1.1 to 1.3. Doubling is usually excessive outside of toy examples.
Keep a strict cap. Many users cap between 20 and 40 percent of equity per leg.
Stress test with different start dates and subperiods. Long flat or trending regimes are where martingale weaknesses appear.
Compare to an anti-martingale (increase after wins, cut after losses) to understand the other side of the trade-off.
If you deploy sizing live, add external guardrails such as a daily loss cut, volatility filters, and a global max drawdown stop.
Settings recap
Backtest start date and initial capital
Initial allocation, increase-after-loss factor, max allocation cap
Signal source selector
Trading days per year and risk-free rate
Benchmark symbol for Alpha and Beta
UI toggles for equity, buy and hold, labels, metrics, PnL, and drawdown
Monte Carlo controls for enable, runs, horizon, and result table
Final thoughts
A martingale is not a free lunch. It is a way to tilt capital allocation toward losing streaks. If the signal has a real edge and mean reversion is common, careful and capped escalation can reduce time-to-recovery. If the signal lacks edge or regimes shift, the same rule can magnify losses at the worst possible moment. This simulator makes those trade-offs visible so you can calibrate parameters, understand tail risk, and decide whether the approach belongs anywhere in your research workflow.

Live Market - Performance MonitorLive Market — Performance Monitor
Study material (no code) — step-by-step training guide for learners
________________________________________
1) What this tool is — short overview
This indicator is a live market performance monitor designed for learning. It scans price, volume and volatility, detects order blocks and trendline events, applies filters (volume & ATR), generates trade signals (BUY/SELL), creates simple TP/SL trade management, and renders a compact dashboard summarizing market state, risk and performance metrics.
Use it to learn how multi-factor signals are constructed, how Greeks-style sensitivity is replaced by volatility/ATR reasoning, and how a live dashboard helps monitor trade quality.
________________________________________
2) Quick start — how a learner uses it (step-by-step)
1. Add the indicator to a chart (any ticker / timeframe).
2. Open inputs and review the main groups: Order Block, Trendline, Signal Filters, Display.
3. Start with defaults (OB periods ≈ 7, ATR multiplier 0.5, volume threshold 1.2) and observe the dashboard on the last bar.
4. Walk the chart back in time (use the last-bar update behavior) and watch how signals, order blocks, trendlines, and the performance counters change.
5. Run the hands-on labs below to build intuition.
________________________________________
3) Main configurable inputs (what you can tweak)
• Order Block Relevant Periods (default ~7): number of consecutive candles used to define an order block.
• Min. Percent Move for Valid OB (threshold): minimum percent move required for a valid order block.
• Number of OB Channels: how many past order block lines to keep visible.
• Trendline Period (tl_period): pivot lookback for detecting highs/lows used to draw trendlines.
• Use Wicks for Trendlines: whether pivot uses wicks or body.
• Extension Bars: how far trendlines are projected forward.
• Use Volume Filter + Volume Threshold Multiplier (e.g., 1.2): requires volume to be greater than multiplier × average volume.
• Use ATR Filter + ATR Multiplier: require bar range > ATR × multiplier to filter noise.
• Show Targets / Table settings / Colors for visualization.
________________________________________
4) Core building blocks — what the script computes (plain language)
Price & trend:
• Spot / LTP: current close price.
• EMA 9 / 21 / 50: fast, medium, slow moving averages to define short/medium trend.
o trend_bullish: EMA9 > EMA21 > EMA50
o trend_bearish: EMA9 < EMA21 < EMA50
o trend_neutral: otherwise
Volatility & noise:
• ATR (14): average true range used for dynamic target and filter sizing.
• dynamic_zone = ATR × atr_multiplier: minimum bar range required for meaningful move.
• Annualized volatility: stdev of price changes × sqrt(252) × 100 — used to classify volatility (HIGH/MEDIUM/LOW).
Momentum & oscillators:
• RSI 14: overbought/oversold indicator (thresholds 70/30).
• MACD: EMA(12)-EMA(26) and a 9-period signal line; histogram used for momentum direction and strength.
• Momentum (ta.mom 10): raw momentum over 10 bars.
Mean reversion / band context:
• Bollinger Bands (20, 2σ): upper, mid, lower.
o price_position measures where price sits inside the band range as 0–100.
Volume metrics:
• avg_volume = SMA(volume, 20) and volume_spike = volume > avg_volume × volume_threshold
o volume_ratio = volume / avg_volume
Support & Resistance:
• support_level = lowest low over 20 bars
• resistance_level = highest high over 20 bars
• current_position = percent of price between support & resistance (0–100)
________________________________________
5) Order Block detection — concept & logic
What it tries to find: a bar (the base) followed by N candles in the opposite direction (a classical order block setup), with a minimum % move to qualify. The script records the high/low of the base candle, averages them, and plots those levels as OB channels.
How learners should think about it (conceptual):
1. An order block is a signature area where institutions (theory) left liquidity — often seen as a large bar followed by a sequence of directional candles.
2. This indicator uses a configurable number of subsequent candles to confirm that the pattern exists.
3. When found, it stores and displays the base candle’s high/low area so students can see how price later reacts to those zones.
Implementation note for learners: the tool keeps a limited history of OB lines (ob_channels). When new OBs exceed the count, the oldest lines are removed — good practice to avoid clutter.
________________________________________
6) Trendline detection — idea & interpretation
• The script finds pivot highs and lows using a symmetric lookback (tl_period and half that as right/left).
• It then computes a trendline slope from successive pivots and projects the line forward (extension_bars).
• Break detection: Resistance break = close crosses above the projected resistance line; Support break = close crosses below projected support.
Learning tip: trendlines here are computed from pivot points and time. Watch how changing tl_period (bigger = smoother, fewer pivots) alters the trendlines and break signals.
________________________________________
7) Signal generation & filters — step-by-step
1. Primary triggers:
o Bullish trigger: order block bullish OR resistance trendline break.
o Bearish trigger: bearish order block OR support trendline break.
2. Filters applied (both must pass unless disabled):
o Volume filter: volume must be > avg_volume × volume_threshold.
o ATR filter: bar range (high-low) must exceed ATR × atr_multiplier.
o Not in an existing trade: new trades only start if trade_active is false.
3. Trend confirmation:
o The primary trigger is only confirmed if trend is bullish/neutral for buys or bearish/neutral for sells (EMA alignment).
4. Result:
o When confirmed, a long or short trade is activated with TP/SL calculated from ATR multiples.
________________________________________
8) Trade management — what the tool does after a signal
• Entry management: the script marks a trade as trade_active and sets long_trade or short_trade flags.
• TP & SL rules:
o Long: TP = high + 2×ATR ; SL = low − 1×ATR
o Short: TP = low − 2×ATR ; SL = high + 1×ATR
• Monitoring & exit:
o A trade closes when price reaches TP or SL.
o When TP/SL hit, the indicator updates win_count and total_pnl using a very simple calculation (difference between TP/SL and previous close).
o Visual lines/labels are drawn for TP and updated as the trade runs.
Important learner notes:
• The script does not store a true entry price (it uses close in its P&L math), so PnL is an approximation — treat this as a learning proxy, not a position accounting system.
• There’s no sizing, slippage, or fee accounted — students must manually factor these when translating to real trades.
• This indicator is not a backtesting strategy; strategy.* functions would be needed for rigorous backtest results.
________________________________________
9) Signal strength & helper utilities
• Signal strength is a composite score (0–100) made up of four signals worth 25 points each:
1. RSI extreme (overbought/oversold) → 25
2. Volume spike → 25
3. MACD histogram magnitude increasing → 25
4. Trend existence (bull or bear) → 25
• Progress bars (text glyphs) are used to visually show RSI and signal strength on the table.
Learning point: composite scoring is a way to combine orthogonal signals — study how changing weights changes outcomes.
________________________________________
10) Dashboard — how to read each section (walkthrough)
The dashboard is split into sections; here's how to interpret them:
1. Market Overview
o LTP / Change%: immediate price & daily % change.
2. RSI & MACD
o RSI value plus progress bar (overbought 70 / oversold 30).
o MACD histogram sign indicates bullish/bearish momentum.
3. Volume Analysis
o Volume ratio (current / average) and whether there’s a spike.
4. Order Block Status
o Buy OB / Sell OB: the average base price of detected order blocks or “No Signal.”
5. Signal Status
o 🔼 BUY or 🔽 SELL if confirmed, or ⚪ WAIT.
o No-trade vs Active indicator summarizing market readiness.
6. Trend Analysis
o Trend direction (from EMAs), market sentiment score (composite), volatility level and band/position metrics.
7. Performance
o Win Rate = wins / signals (percentage)
o Total PnL = cumulative PnL (approximate)
o Bull / Bear Volume = accumulated volumes attributable to signals
8. Support & Resistance
o 20-bar highest/lowest — use as nearby reference points.
9. Risk & R:R
o Risk Level from ATR/price as a percent.
o R:R Ratio computed from TP/SL if a trade is active.
10. Signal Strength & Active Trade Status
• Numeric strength + progress bar and whether a trade is currently active with TP/SL display.
________________________________________
11) Alerts — what will notify you
The indicator includes pre-built alert triggers for:
• Bullish confirmed signal
• Bearish confirmed signal
• TP hit (long/short)
• SL hit (long/short)
• No-trade zone
• High signal strength (score > 75%)
Training use: enable alerts during a replay session to be notified when the indicator would have signalled.
________________________________________
12) Labs — hands-on exercises for learners (step-by-step)
Lab A — Order Block recognition
1. Pick a 15–30 minute timeframe on a liquid ticker.
2. Use default OB periods (7). Mark each time the dashboard shows a Buy/Sell OB.
3. Manually inspect the chart at the base candle and the following sequence — draw the OB zone by hand and watch later price reactions to it.
4. Repeat with OB periods 5 and 10; note stability vs noise.
Lab B — Trendline break confirmation
1. Increase trendline period (e.g., 20), watch trendlines form from pivots.
2. When a resistance break is flagged, compare with MACD & volume: was momentum aligned?
3. Note false breaks vs confirmed moves — change extension_bars to see projection effects.
Lab C — Filter sensitivity
1. Toggle Use Volume Filter off, and record the number and quality of signals in a 2-day window.
2. Re-enable volume filter and change threshold from 1.2 → 1.6; note how many low-quality signals are filtered out.
Lab D — Trade management simulation
1. For each signalled trade, record the time, close entry approximation, TP, SL, and eventual hit/miss.
2. Compute actual PnL if you had entered at the open of the next bar to compare with the script’s PnL math.
3. Tabulate win rate and average R:R.
Lab E — Performance review & improvement
1. Build a spreadsheet of signals over 30–90 periods with columns: Date, Signal type, Entry price (real), TP, SL, Exit, PnL, Notes.
2. Analyze which filters or indicators contributed most to winners vs losers and adjust weights.
________________________________________
13) Common pitfalls, assumptions & implementation notes (things to watch)
• P&L simplification: total_pnl uses close as a proxy entry price. Real entry/exit prices and slippage are not recorded — so PnL is approximate.
• No position sizing or money management: the script doesn’t compute position size from equity or risk percent.
• Signal confirmation logic: composite "signal_strength" is a simple 4×25 point scheme — explore different weights or additional signals.
• Order block detection nuance: the script defines the base candle and checks the subsequent sequence. Be sure to verify whether the intended candle direction (base being bullish vs bearish) aligns with academic/your trading definition — read the code carefully and test.
• Trendline slope over time: slope is computed using timestamps; small differences may make lines sensitive on very short timeframes — using bar_index differences is usually more stable.
• Not a true backtester: to evaluate performance statistically you must transform the logic into a strategy script that places hypothetical orders and records exact entry/exit prices.
________________________________________
14) Suggested improvements for advanced learners
• Record true entry price & timestamp for accurate PnL.
• Add position sizing: risk % per trade using SL distance and account size.
• Convert to strategy. (Pine Strategy)* to run formal backtests with equity curves, drawdowns, and metrics (Sharpe, Sortino).
• Log trades to an external spreadsheet (via alerts + webhook) for offline analysis.
• Add statistics: average win/loss, expectancy, max drawdown.
• Add additional filters: news time blackout, market session filters, multi-timeframe confirmation.
• Improve OB detection: combine wick/body, volume spike at base bar, and liquidity sweep detection.
________________________________________
15) Glossary — quick definitions
• ATR (Average True Range): measure of typical range; used to size targets and stops.
• EMA (Exponential Moving Average): trend smoothing giving more weight to recent prices.
• RSI (Relative Strength Index): momentum oscillator; >70 overbought, <30 oversold.
• MACD: momentum oscillator using difference of two EMAs.
• Bollinger Bands: volatility bands around SMA.
• Order Block: a base candle area with subsequent confirmation candles; a zone of institutional interest (learning model).
• Pivot High/Low: local turning point defined by candles on both sides.
• Signal Strength: combined score from multiple indicators.
• Win Rate: proportion of signals that hit TP vs total signals.
• R:R (Risk:Reward): ratio of potential reward (TP distance) to risk (entry to SL).
________________________________________
16) Limitations & assumptions (be explicit)
• This is an indicator for learning — not a trading robot or broker connection.
• No slippage, fees, commissions or tie-in to real orders are considered.
• The logic is heuristic (rule-of-thumb), not a guarantee of performance.
• Results are sensitive to timeframe, market liquidity, and parameter choices.
________________________________________
17) Practical classroom / study plan (4 sessions)
• Session 1 — Foundations: Understand EMAs, ATR, RSI, MACD, Bollinger Bands. Run the indicator and watch how these numbers change on a single day.
• Session 2 — Zones & Filters: Study order blocks and trendlines. Test volume & ATR filters and note changes in false signals.
• Session 3 — Simulated trading: Manually track 20 signals, compute real PnL and compare to the dashboard.
• Session 4 — Improvement plan: Propose changes (e.g., better PnL accounting, alternative OB rule) and test their impact.
________________________________________
18) Quick reference checklist for each signal
1. Was an order block or trendline break detected? (primary trigger)
2. Did volume meet threshold? (filter)
3. Did ATR filter (bar size) show a real move? (filter)
4. Was trend aligned (EMA 9/21/50)? (confirmation)
5. Signal confirmed → mark entry approximation, TP, SL.
6. Monitor dashboard (Signal Strength, Volatility, No-trade zone, R:R).
7. After exit, log real entry/exit, compute actual PnL, update spreadsheet.
________________________________________
19) Educational caveat & final note
This tool is built for training and analysis: it helps you see how common technical building blocks combine into trade ideas, but it is not a trading recommendation. Use it to develop judgment, to test hypotheses, and to design robust systems with proper backtesting and risk control before risking capital.
________________________________________
20) Disclaimer (must include)
Training & Educational Only — This material and the indicator are provided for educational purposes only. Nothing here is investment advice or a solicitation to buy or sell financial instruments. Past simulated or historical performance does not predict future results. Always perform full backtesting and risk management, and consider seeking advice from a qualified financial professional before trading with real capital.
________________________________________

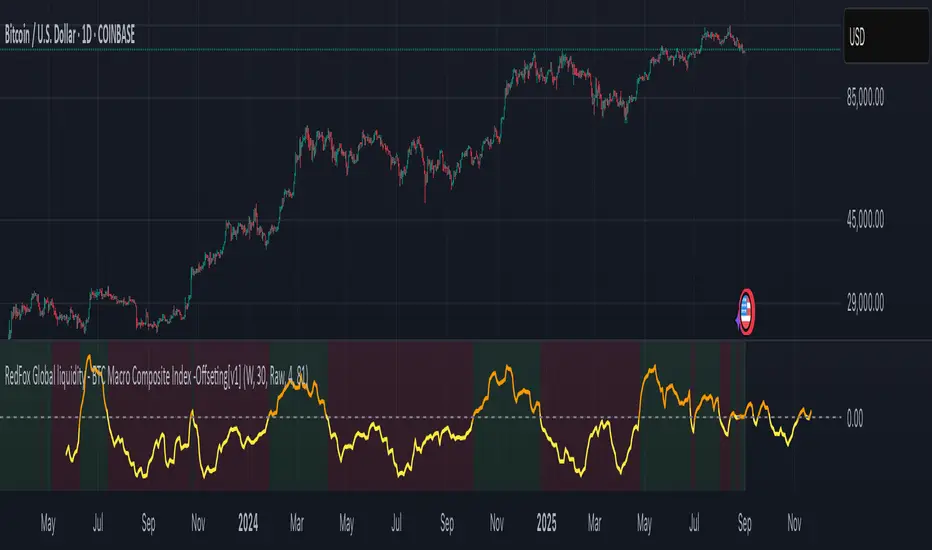
BTC Macro Composite Global liquidity Index -OffsetThis indicator is based on the thesis that Bitcoin price movements are heavily influenced by macro liquidity trends. It calculates a weighted composite index based on the following components:
• Global Liquidity (41%): Sum of central bank balance sheets (Fed , ECB , BoJ , and PBoC ), adjusted to USD.
• Investor Risk Appetite (22%): Derived from the Copper/Gold ratio, inverse VIX (as a risk-on signal), and the spread between High Yield and Investment Grade bonds (HY vs IG OAS).
• Gold Sensitivity (15–20%): Combines the XAUUSD price with BTC/Gold ratio to reflect the historical influence of gold on Bitcoin pricing.
Each component is normalized and then offset forward by 90 days to attempt predictive alignment with Bitcoin’s price.
The goal is to identify macro inflection points with high predictive value for BTC. It is not a trading signal generator but rather a macro trend context indicator.
❗ Important: This script should be used with caution. It does not account for geopolitical shocks, regulatory events, or internal BTC market structure (e.g., miner behavior, on-chain metrics).
💡 How to use:
• Use on the 1D timeframe.
• Look for divergences between BTC price and the macro index.
• Apply in confluence with other technical or fundamental frameworks.
🔍 Originality:
While similar components exist in macro dashboards, this script combines them uniquely using time-forward offsets and custom weighting specifically tailored for BTC behavior.
BTC(Sats Stacking) - CDC Action zone filterType: Indicator (Pine v6) • Category: Strategy Tools / DCA • Overlay: Yes
Overview
This indicator simulates fixed-amount Bitcoin DCA (dollar-cost averaging) and lets you apply a CDC Action Zone filter to only buy in specific market conditions. It plots EMA(12/26) lines with a shaded zone (green when fast > slow, red when slow > fast), shows buy markers on the chart when a DCA event actually executes, and displays a concise performance table.
The simulation tracks real invested capital (sum of your buys), not hypothetical equity injections, and reports PnL vs invested capital.
Key features
DCA frequency: Everyday, Every week, or Every month
CDC filter: Buy on all days, only when CDC is Green (trend-up above fast EMA), or only when Red (trend-down below fast EMA)
Execution price: Choose to buy at bar close or next bar open
Capital controls: Fixed DCA amount per event, optional max budget cap
Currency support: Portfolio currency label plus optional FX conversion (by symbol or manual rate)
Chart visuals: Buy markers on candles; EMA(12/26) lines with shaded “action zone”
Metrics table: Invested capital, buys executed, BTC accumulated, average price per BTC (quote), equity (portfolio), PnL% vs invested, and CAGR
How it works
CDC state:
Green = EMA(fast) > EMA(slow) and price ≥ EMA(fast)
Red = EMA(fast) < EMA(slow) and price < EMA(fast)
DCA trigger: Fires on new day/week/month boundaries (timeframe-agnostic).
Buy execution: When a DCA event occurs and passes the CDC filter and budget check, the script spends the fixed amount and adds the corresponding BTC at the chosen execution price.
Inputs (highlights)
Simulation
Symbol (blank = current chart), Buy at close/open, DCA amount, Max total invested
DCA Schedule
Everyday / Every week / Every month
CDC Action Zone
Filter mode (All / Green only / Red only), Price source, Fast/Slow EMA lengths (defaults 12/26)
Currency / Conversion
Portfolio currency label, Convert on/off, By symbol (e.g., OANDA:USDTHB) or Manual rate
Backtest Range
Optional start/end dates
Style
Show EMA lines and zone, colors and opacities, buy marker size and color
Display
Show qty/price labels on buys, show metrics table, number formatting
Metrics
Invested capital: Sum of all DCA spends in your portfolio currency
Equity (portfolio): BTC holdings marked to market and converted back if FX is enabled
PnL % vs invested: (Equity / Invested - 1) × 100
CAGR: Based on elapsed time from first in-range bar to the latest bar
Average price per BTC (quote): Spend in quote currency divided by BTC accumulated
Notes
This is an indicator, not a broker-connected strategy. It simulates buys and displays results without placing orders.
For more realistic fills, use Buy at next bar open.
If your portfolio currency differs from the symbol’s quote currency, enable Convert and supply a conversion symbol or manual rate.
EMA shading is purely visual; the filter logic uses the same EMA definitions.
Attribution & License
Inspired by the DCA idea and community simulations; CDC filtering implemented with standard EMA(12/26) logic.
License: MPL-2.0 (see code header).
Author: MiSuNoJo
Disclaimer
This tool is for research and education only and is not financial advice. Past performance does not guarantee future results. Use at your own risk.

Market Spiralyst [Hapharmonic]Hello, traders and creators! 👋
Market Spiralyst: Let's change the way we look at analysis, shall we? I've got to admit, I scratched my head on this for weeks, Haha :). What you're seeing is an exploration of what's possible when code meets art on financial charts. I wanted to try blending art with trading, to do something new and break away from the same old boring perspectives. The goal was to create a visual experience that's not just analytical, but also relaxing and aesthetically pleasing.
This work is intended as a guide and a design example for all developers, born from the spirit of learning and a deep love for understanding the Pine Script™ language. I hope it inspires you as much as it challenged me!
🧐 Core Concept: How It Works
Spiralyst is built on two distinct but interconnected engines:
The Generative Art Engine: At its core, this indicator uses a wide range of mathematical formulas—from simple polygons to exotic curves like Torus Knots and Spirographs—to draw beautiful, intricate shapes directly onto your chart. This provides a unique and dynamic visual backdrop for your analysis.
The Market Pulse Engine: This is where analysis meets art. The engine takes real-time data from standard technical indicators (RSI and MACD in this version) and translates their states into a simple, powerful "Pulse Score." This score directly influences the appearance of the "Scatter Points" orbiting the main shape, turning the entire artwork into a living, breathing representation of market momentum.
🎨 Unleash Your Creativity! This Is Your Playground
We've included 25 preset shapes for you... but that's just the starting point !
The real magic happens when you start tweaking the settings yourself. A tiny adjustment can make a familiar shape come alive and transform in ways you never expected.
I'm genuinely excited to see what your imagination can conjure up! If you create a shape you're particularly proud of or one that looks completely unique, I would love to see it. Please feel free to share a screenshot in the comments below. I can't wait to see what you discover! :)
Here's the default shape to get you started:
The Dynamic Scatter Points: Reading the Pulse
This is where the magic happens! The small points scattered around the main shape are not just decorative; they are the visual representation of the Market Pulse Score.
The points have two forms:
A small asterisk (`*`): Represents a low or neutral market pulse.
A larger, more prominent circle (`o`): Represents a high, strong market pulse.
Here’s how to read them:
The indicator calculates the Pulse Strength as a percentage (from 0% to 100%) based on the total score from the active indicators (RSI and MACD). This percentage determines the ratio of circles to asterisks.
High Pulse Strength (e.g., 80-100%): Most of the scatter points will transform into large circles (`o`). This indicates that the underlying momentum is strong and It could be an uptrend. It's a visual cue that the market is gaining strength and might be worth paying closer attention to.
Low Pulse Strength (e.g., 0-20%): Most or all of the scatter points will remain as small asterisks (`*`). This suggests weak, neutral, or bearish momentum.
The key takeaway: The more circles you see, the stronger the bullish momentum is according to the active indicators. Watch the artwork "breathe" as the circles appear and disappear with the market's rhythm!
And don't worry about the shape you choose; the scatter points will intelligently adapt and always follow the outer boundary of whatever beautiful form you've selected.
How to Use
Getting started with Spiralyst is simple:
Choose Your Canvas: Start by going into the settings and picking a `Shape` and `Palette` from the "Shape Selection & Palette" group that you find visually appealing. This is your canvas.
Tune Your Engine: Go to the "Market Pulse Engine" settings. Here, you can enable or disable the RSI and MACD scoring engines. Want to see the pulse based only on RSI? Just uncheck the MACD box. You can also fine-tune the parameters for each indicator to match your trading style.
Read the Vibe: Observe the scatter points. Are they mostly small asterisks or are they transforming into large, vibrant circles? Use this visual feedback as a high-level gauge of market momentum.
Check the Dashboard: For a precise breakdown, look at the "Market Pulse Analysis" table on the top-right. It gives you the exact values, scores, and total strength percentage.
Explore & Experiment: Play with the different shapes and color palettes! The core analysis remains the same, but the visual experience can be completely different.
⚙️ Settings & Customization
Spiralyst is designed to be highly customizable.
Shape Selection & Palette: This is your main control panel. Choose from over 25 unique shapes, select a color palette, and adjust the line extension style ( `extend` ) or horizontal position ( `offsetXInput` ).
scatterLabelsInput: This setting controls the total number of points (both asterisks and circles) that orbit the main shape. Think of it as adjusting the density or visual granularity of the market pulse feedback.
The Market Pulse engine will always calculate its strength as a percentage (e.g., 75%). This percentage is then applied to the `scatterLabelsInput` number you've set to determine how many points transform into large circles.
Example: If the Pulse Strength is 75% and you set this to `100` , approximately 75 points will become circles. If you increase it to `200` , approximately 150 points will transform.
A higher number provides a more detailed, high-resolution view of the market pulse, while a lower number offers a cleaner, more minimalist look. Feel free to adjust this to your personal visual preference; the underlying analytical percentage remains the same.
Market Pulse Engine:
`⚙️ RSI Settings` & `⚙️ MACD Settings`: Each indicator has its own group.
Enable Scoring: Use the checkbox at the top of each group to include or exclude that indicator from the Pulse Score calculation. If you only want to use RSI, simply uncheck "Enable MACD Scoring."
Parameters: All standard parameters (Length, Source, Fast/Slow/Signal) are fully adjustable.
Individual Shape Parameters (01-25): Each of the 25+ shapes has its own dedicated group of settings, allowing you to fine-tune every aspect of its geometry, from the number of petals on a flower to the windings of a knot. Feel free to experiment!
For Developers & Pine Script™ Enthusiasts
If you are a developer and wish to add more indicators (e.g., Stochastic, CCI, ADX), you can easily do so by following the modular structure of the code. You would primarily need to:
Add a new `PulseIndicator` object for your new indicator in the `f_getMarketPulse()` function.
Add the logic for its scoring inside the `calculateScore()` method.
The `calculateTotals()` method and the dashboard table are designed to be dynamic and will automatically adapt to include your new indicator!
One of the core design philosophies behind Spiralyst is modularity and scalability . The Market Pulse engine was intentionally built using User-Defined Types (UDTs) and an array-based structure so that adding new indicators is incredibly simple and doesn't require rewriting the main logic.
If you want to add a new indicator to the scoring engine—let's use the Stochastic Oscillator as a detailed example—you only need to modify three small sections of the code. The rest of the script, including the adaptive dashboard, will update automatically.
Here’s your step-by-step guide:
#### Step 1: Add the User Inputs
First, you need to give users control over your new indicator. Find the `USER INTERFACE: INPUTS` section and add a new group for the Stochastic settings, right after the MACD group.
Create a new group name: `string GRP_STOCH = "⚙️ Stochastic Settings"`
Add the inputs: Create a boolean to enable/disable it, and then add the necessary parameters (`%K`, `%D`, `Smooth`). Use the `active` parameter to link them to the enable/disable checkbox.
// Add this code block right after the GRP_MACD and MACD inputs
string GRP_STOCH = "⚙️ Stochastic Settings"
bool stochEnabledInput = input.bool(true, "Enable Stochastic Scoring", group = GRP_STOCH)
int stochKInput = input.int(14, "%K Length", minval=1, group = GRP_STOCH, active = stochEnabledInput)
int stochDInput = input.int(3, "%D Smoothing", minval=1, group = GRP_STOCH, active = stochEnabledInput)
int stochSmoothInput = input.int(3, "Smooth", minval=1, group = GRP_STOCH, active = stochEnabledInput)
#### Step 2: Integrate into the Pulse Engine (The "Factory")
Next, go to the `f_getMarketPulse()` function. This function acts as a "factory" that builds and configures the entire market pulse object. You need to teach it how to build your new Stochastic indicator.
Update the function signature: Add the new `stochEnabledInput` boolean as a parameter.
Calculate the indicator: Add the `ta.stoch()` calculation.
Create a `PulseIndicator` object: Create a new object for the Stochastic, populating it with its name, parameters, calculated value, and whether it's enabled.
Add it to the array: Simply add your new `stochPulse` object to the `array.from()` list.
Here is the complete, updated `f_getMarketPulse()` function :
// Factory function to create and calculate the entire MarketPulse object.
f_getMarketPulse(bool rsiEnabled, bool macdEnabled, bool stochEnabled) =>
// 1. Calculate indicator values
float rsiVal = ta.rsi(rsiSourceInput, rsiLengthInput)
= ta.macd(close, macdFastInput, macdSlowInput, macdSignalInput)
float stochVal = ta.sma(ta.stoch(close, high, low, stochKInput), stochDInput) // We'll use the main line for scoring
// 2. Create individual PulseIndicator objects
PulseIndicator rsiPulse = PulseIndicator.new("RSI", str.tostring(rsiLengthInput), rsiVal, na, 0, rsiEnabled)
PulseIndicator macdPulse = PulseIndicator.new("MACD", str.format("{0},{1},{2}", macdFastInput, macdSlowInput, macdSignalInput), macdVal, signalVal, 0, macdEnabled)
PulseIndicator stochPulse = PulseIndicator.new("Stoch", str.format("{0},{1},{2}", stochKInput, stochDInput, stochSmoothInput), stochVal, na, 0, stochEnabled)
// 3. Calculate score for each
rsiPulse.calculateScore()
macdPulse.calculateScore()
stochPulse.calculateScore()
// 4. Add the new indicator to the array
array indicatorArray = array.from(rsiPulse, macdPulse, stochPulse)
MarketPulse pulse = MarketPulse.new(indicatorArray, 0, 0.0)
// 5. Calculate final totals
pulse.calculateTotals()
pulse
// Finally, update the function call in the main orchestration section:
MarketPulse marketPulse = f_getMarketPulse(rsiEnabledInput, macdEnabledInput, stochEnabledInput)
#### Step 3: Define the Scoring Logic
Now, you need to define how the Stochastic contributes to the score. Go to the `calculateScore()` method and add a new case to the `switch` statement for your indicator.
Here's a sample scoring logic for the Stochastic, which gives a strong bullish score in oversold conditions and a strong bearish score in overbought conditions.
Here is the complete, updated `calculateScore()` method :
// Method to calculate the score for this specific indicator.
method calculateScore(PulseIndicator this) =>
if not this.isEnabled
this.score := 0
else
this.score := switch this.name
"RSI" => this.value > 65 ? 2 : this.value > 50 ? 1 : this.value < 35 ? -2 : this.value < 50 ? -1 : 0
"MACD" => this.value > this.signalValue and this.value > 0 ? 2 : this.value > this.signalValue ? 1 : this.value < this.signalValue and this.value < 0 ? -2 : this.value < this.signalValue ? -1 : 0
"Stoch" => this.value > 80 ? -2 : this.value > 50 ? 1 : this.value < 20 ? 2 : this.value < 50 ? -1 : 0
=> 0
this
#### That's It!
You're done. You do not need to modify the dashboard table or the total score calculation.
Because the `MarketPulse` object holds its indicators in an array , the rest of the script is designed to be adaptive:
The `calculateTotals()` method automatically loops through every indicator in the array to sum the scores and calculate the final percentage.
The dashboard code loops through the `enabledIndicators` array to draw the table. Since your new Stochastic indicator is now part of that array, it will appear automatically when enabled!
---
Remember, this is your playground! I'm genuinely excited to see the unique shapes you discover. If you create something you're proud of, feel free to share it in the comments below.
Happy analyzing, and may your charts be both insightful and beautiful! 💛

Moon Scalper v3 + VSAMoon Scalper v3 is a high-precision scalping indicator optimized for the 15-minute chart. It delivers clean buy/sell signals with TP1 (1:1 risk-reward) exits using layered confirmations:
• **Volatility Bands** — SMA + multiplier detect expansion zones
• **EMA Filter (200)** — ensures trades align with trend
• **RSI Range Filter** — avoids extreme overbought/oversold traps (buy: 52–62, sell: 38–48)
• **Volume Spike Filter** — filters for institutional activity (vol > 1.4×SMA)
• **VSA Confirmation** — requires wide-spread, high-volume bars with reclaim (volume × 1.4, spread × 1.5, reclaim 50%)
**Usage Notes:**
Best used on 15m timeframe for liquid pairs (e.g., BTCUSDT, ETHUSDT). Signals appear as “BUY” / “SELL” labels on chart. Defaults yield high TP1 hit rate; use only during active sessions (e.g., London/NY) for best accuracy.
**Disclaimer:**
This indicator is for educational purposes only. Past performance is not a guarantee of future results. Always backtest before live trading and manage risk responsibly.

Crypto Perp Calc v1Advanced Perpetual Position Calculator for TradingView
Description
A comprehensive position sizing and risk management tool designed specifically for perpetual futures trading. This indicator eliminates the confusion of calculating leveraged positions by providing real-time position metrics directly on your chart.
Key Features:
Interactive Price Selection: Click directly on chart to set entry, stop loss, and take profit levels
Accurate Lot Size Calculation: Instantly calculates the exact position size needed for your margin and leverage
Multiple Entry Support: DCA into positions with up to 3 entry points with customizable allocation
Multiple Take Profit Levels: Scale out of positions with up to 3 TP targets
Comprehensive Risk Metrics: Shows dollar P&L, account risk percentage, and liquidation price
Visual Risk/Reward: Color-coded boxes and lines display your trade setup clearly
Real-time Info Table: All critical position data in one organized panel
Perfect for traders using perpetual futures who need precise position sizing with leverage.
---------
How to Use
Quick Start (3 Clicks)
1. Add the indicator to your chart
2. Click three times when prompted:
First click: Set your entry price
Second click: Set your stop loss
Third click: Set your take profit
3. Read the TOTAL LOTS value from the info table (highlighted in yellow)
4. Use this lot size in your exchange when placing the trade
Detailed Setup
Step 1: Configure Your Account
Enter your account balance (total USDT in account)
Set your margin amount (how much USDT to risk on this trade)
Choose your leverage (1x to 125x)
Select Long or Short position
Step 2: Set Price Levels
Main levels use interactive clicking (Entry, SL, TP)
For multiple entries or TPs, use the settings panel to manually input prices and percentages
Step 3: Read the Results
The info table shows:
TOTAL LOTS - The position size to enter on your exchange
Margin Used - Your actual capital at risk
Notional - Total position value (margin × leverage)
Max Risk - Dollar amount you'll lose at stop loss
Total Profit - Dollar amount you'll gain at take profit
R:R Ratio - Risk to reward ratio
Account Risk - Percentage of account at risk
Liquidation - Price where position gets liquidated
Step 4: Advanced Features (Optional)
Multiple Entries (DCA):
Enable "Use Multiple Entries"
Set up to 3 entry prices
Allocate percentage for each (must total 100%)
See individual lot sizes for each entry
Multiple Take Profits:
Enable "Use Multiple TPs"
Set up to 3 TP levels
Allocate percentage to close at each level (must total 100%)
View profit at each target
Visual Elements
Blue lines/labels: Entry points
Red lines/labels: Stop loss
Green lines/labels: Take profit targets
Colored boxes: Visual risk (red) and reward (green) zones
Info table: Can be positioned anywhere on screen
Alerts
Set price alerts for:
Entry zones reached
Stop loss approached
Take profit levels hit
Works with TradingView's alert system
Tips for Best Results
Always verify the lot size matches your intended risk
Check the liquidation price stays far from your stop loss
Monitor the account risk percentage (recommended: keep under 2-3%)
Use the warning indicators if risk exceeds margin
For quick trades, use single entry/TP; for complex strategies, use multiple levels
Example Workflow
Find your trade setup using your analysis
Add this indicator and click to set levels
Check risk metrics in the table
Copy the TOTAL LOTS value
Enter this exact position size on your exchange
Set alerts for key levels if desired
This tool bridges the gap between TradingView charting and exchange execution, ensuring your position sizing is always accurate when trading with leverage.
Disclaimer, this was coded with help of AI, double check calculations if they are off.

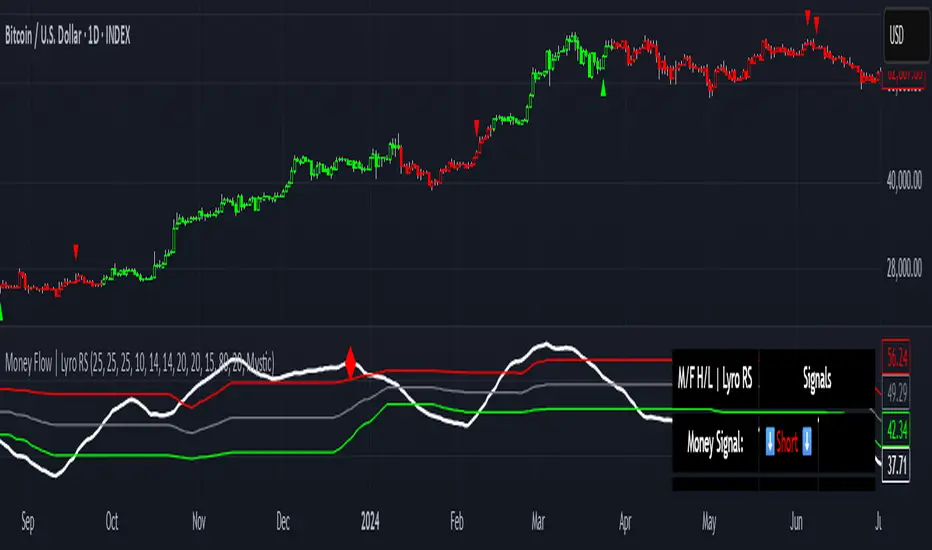
Money Flow | Lyro RSMoney Flow | Lyro RS
The Money Flow is a momentum and volume-driven oscillator designed to highlight market strength, exhaustion, and potential reversal points. By combining smoothed Money Flow Index readings with volatility, momentum, and RVI-based logic, it offers traders a deeper perspective on money inflow/outflow, divergences, and overbought/oversold dynamics.
Key Features
Smoothed Money Flow Line
EMA-smoothed calculation of the MFI for noise reduction.
Clear thresholds for overbought and oversold zones.
Normalized Histogram
Histogram plots show bullish/bearish money flow pressure.
Color-coded cross logic for quick trend assessment.
Relative Volatility Index (RVI) Signals
Detects overbought and oversold conditions using volatility-adjusted RVI.
Plots ▲ and ▼ markers at exhaustion points.
Momentum Strength Gauge
Calculates normalized momentum strength from ROC and volume activity.
Displays percentage scale of current momentum force.
Divergence Detection
Bullish divergence: Price makes lower lows while money flow makes higher lows.
Bearish divergence: Price makes higher highs while money flow makes lower highs.
Plotted as diamond markers on the oscillator.
Signal Dashboard (Table Overlay)
Displays real-time status of Money Flow signals, volatility, and momentum.
Color-coded readouts for instant clarity (Long/Short/Neutral + Momentum Bias).
How It Works
Money Flow Calculation – Applies EMA smoothing to MFI values.
Normalization – Scales oscillator between relative high/low values.
Trend & Signals – Generates bullish/bearish signals based on midline and histogram cross logic.
RVI Integration – Confirms momentum exhaustion with overbought/oversold markers.
Divergences – Identifies hidden market imbalances between price and money flow.
Practical Use
Trend Confirmation – Use midline crossovers with histogram direction for money flow bias.
Overbought/Oversold Reversals – Watch RVI ▲/▼ markers for exhaustion setups.
Momentum Tracking – Monitor momentum percentage to gauge strength of current trend.
Divergence Alerts – Spot early reversal opportunities when money flow diverges from price action.
Customization
Adjust length, smoothing, and thresholds for different markets.
Enable/disable divergence detection as needed.
Personalize visuals and dashboard display for cleaner charts.
⚠️ Disclaimer
This indicator is a tool for technical analysis and does not provide guaranteed results. It should be used alongside other methods and proper risk management. The creator is not responsible for financial decisions made using this script.
Progressive Entry Position Sizer v3Progressive Entry Position Sizer (PEPS) - DEVELOPMENT VERSION
⚠️ IMPORTANT DISCLAIMER: This indicator is currently in development and should NOT be relied upon for trading accuracy. Use at your own risk and always verify calculations independently before making any trading decisions.
Overview:
The Progressive Entry Position Sizer (PEPS) is a risk management tool designed to help traders plan multiple entry positions with progressive scaling. This indicator calculates position sizes and margin requirements across multiple entry levels while maintaining consistent risk exposure.
Key Features:
Progressive Risk Scaling: Uses a token-based system (1, 2, 3, 4, 5...) to progressively increase position sizes at each entry level
Leverage Support: Accommodates leverage up to 50x with proper margin calculations
Dollar-Based Position Sizing: Displays position values in dollar amounts rather than share quantities
Visual Entry Planning: Shows entry zones, target, and stop loss levels with extended lines
Comprehensive Risk Table: Detailed breakdown of each entry with position values and margin requirements
How It Works:
Set your account balance, risk percentage, and leverage
Define primary entry, final entry, target, and stop loss prices
Choose number of limit orders (2-8)
The indicator calculates evenly distributed entry prices with progressive position sizing
Each subsequent entry receives more "risk tokens" resulting in larger position sizes
Use Cases:
Planning DCA (Dollar Cost Averaging) strategies
Risk management for leveraged positions
Visualizing multi-entry trading setups
Educational purposes for understanding progressive scaling
⚠️ Development Status:
This script is actively being developed and may contain bugs or calculation errors. Always:
Verify all calculations manually
Test thoroughly on paper trades first
Consult with financial professionals
Never risk more than you can afford to lose
Feedback Welcome:
As this is a development version, user feedback and suggestions for improvements are greatly appreciated.
This indicator is for educational and planning purposes only. Not financial advice.
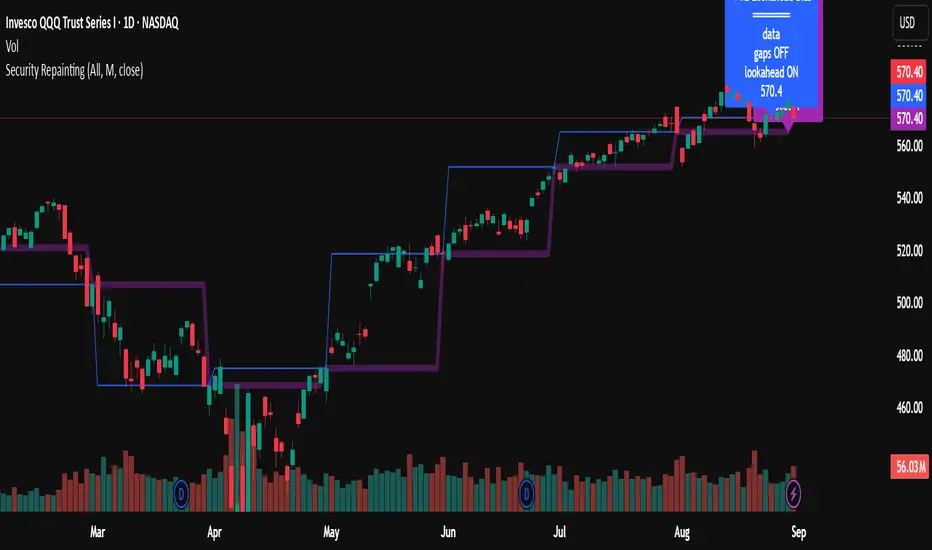
How to avoid repainting when using security() - viewing optionsHow to avoid repainting when using the security() - Edited PineCoders FAQ with more viewing options
This may be of value to a limited few, but I've introduced a set of Boolean inputs to PineCoders' original script because viewing all the various security lines at once was giving me a brain cramp. I wanted to study each behavior one-by-one. This version (also updated to PineScript v6) will allow users to selectively display each, or any combination, of the security plots. Each plot was updated to include a condition tied to its corresponding input, ensuring it only appears when explicitly enabled. The label-rendering logic only displays when its related plot is active; however, I've also added an input that allows you to remove all labels, enabling you to see the price action more clearly (the labels can sometimes obscure what you want to see). Run this script in replay mode to view the nuanced differences between the 12 methods while selecting/deselecting the desired plots (selecting all at once can be overcrowded and confusing).
All thanks and credit to PineCoders--these changes I made only provide more control over what’s shown on the chart without altering the core structure or intent of the original script. It helped me, so I thought I should share it. If I inadvertently messed something up, please let me know, and I will try to fix it.
I set the defaults for viewing monthly security functions on the daily timeframe. Only the first 2 security functions plot with the default settings, so change the settings as needed. Be sure to read the original notes and detailed explanations in the PineCoders posting "How to avoid repainting when using security() - PineCoders FAQ."
Bottom line, you should use one of the two functions: f_secureSecurity or f_security, depending on what you are trying to do. Hopefully, this script will make it a little easier for the visual learner to understand why (use replay mode or watch live price action on a lower timeframe).
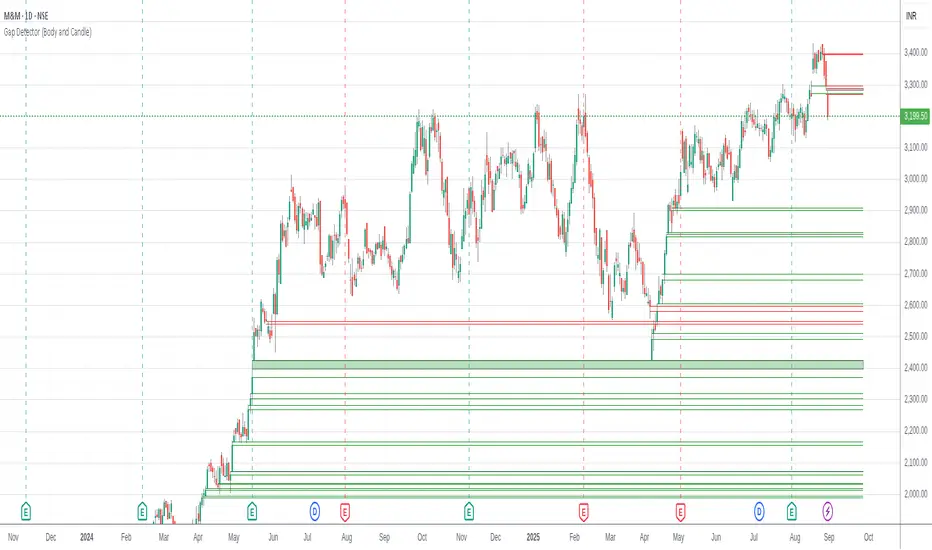
Gap Detector (Body and Candle)Finds/Detects gaps between candles and candle bodies for any chart/timeframe with O(n+delta) performance.
Candle Gaps (between wicks) act as strong support or resistance. They are drawn as solid boxes.
Body Gaps (ignores wicks) act as mild support or resistance. They are depicted with lines.
Adjust the settings for candle/body gap width, smaller the time frame, smaller the gap.
Adjust max historical bars to fine tune performance on your system/setup. The more historical bars the script scans, more time required to load the chart. At times based on system configuration, TradingView may timeout the script due to too many bars. Reducing the max bars helps in this scenario.
This is a revamped version of "Body Gap Detector".
Happy charting !