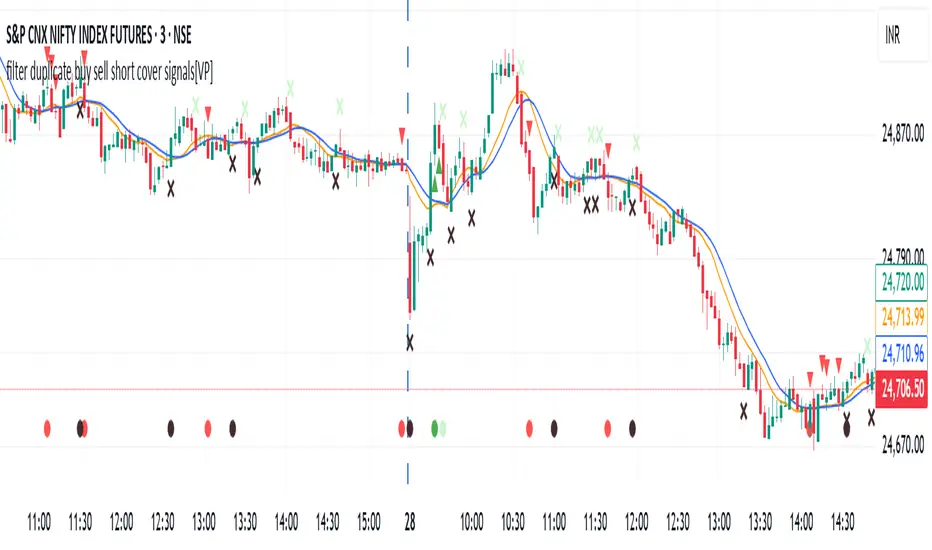
filter duplicate buy sell short cover signals[VP]I was looking for an indicator that would filter signals but could only find solutions for a buy/sell system. I couldn't locate one that dealt with buy/sell AND short/cover.
The indicator expands the idea from the link:
stackoverflow.com
Educational
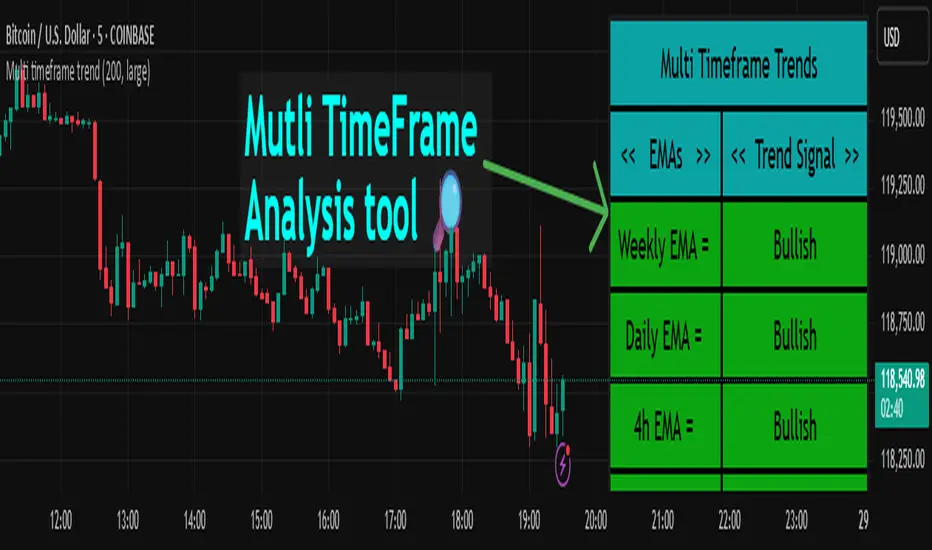
Multi timeframe trendDESCRIPTION
This indicator, Multi Timeframe Trend, is a powerful tool designed to give traders a comprehensive overview of market trends across multiple timeframes using a single, customizable Exponential Moving Average (EMA). It visually displays whether the price is trading above or below the EMA on each timeframe, helping traders quickly determine the dominant trend at a glance.
The real-time dashboard is plotted directly on your chart and color-coded to show bullish (green) or bearish (red) conditions per timeframe, from 15 minutes to 1 week. It is especially helpful for identifying trend alignment across multiple timeframes—an essential component of many professional trading strategies.
USER INPUTS
* Enter the EMA length – Adjust the EMA period used in the trend calculation (default: 200)
* Table Size – Choose how large the on-chart table appears: "tiny", "small", "normal", or "large"
INDICATOR LOGIC
* The indicator calculates the EMA for each of the following timeframes: 1W, 1D, 4H, 1H, 30M, and 15M
* It checks whether the current close is above or below each EMA and labels it as:
* Bullish if close > EMA
* Bearish if close < EMA
* Each timeframe’s trend is displayed in a dynamic table in the top-right corner of the chart
* The background color of each cell changes according to trend condition for quick visual interpretation
* Real-time responsiveness: handles both historical and live bars to maintain accurate, flicker-free updates
WHY IT IS UNIQUE
* Combines multiple timeframe trend analysis into a single glance
* Clean and color-coded dashboard overlay for real-time trading decisions
* Avoids repainting using barstate logic for accurate trend updates
* Fully customizable table size and EMA length
* Works on any chart, including stocks, crypto, forex, indices
HOW USERS CAN BENEFIT FROM IT
* Multi-timeframe confirmation: Easily confirm alignment across timeframes before entering a trade
* Avoid false signals by ensuring higher timeframe trends agree with lower timeframe setups
* Enhance strategy filters: Use as a trend filter in combination with your existing entry indicators
* Quick market analysis: No need to switch between charts or manually calculate EMAs
* Visual clarity: Trend conditions are easy to read and interpret in real-time
Scalping Indicator v6This Script Show You Recent Scalping Trades u can get instantly we have use the knowledge we gain across the time we might be right or wrong do your own research and use this indicator on ur own risk

Zig Zag with HHLLThis powerful tool calculates and displays two Zig Zag patterns simultaneously while dynamically identifying key market structure points—Higher Highs (HH), Lower Lows (LL), Higher Lows (HL), and Lower Highs (LH).
Because the script is dynamic, the most recent HH, HL, LL, or LH can update in real-time as price action evolves. For example, if the price continues to rise, a previously marked HL may be reclassified as an LL. Likewise, a falling LH may later turn into a HH if the market reverses.
This script is versatile and can be applied to various trading strategies, including trend analysis, support and resistance identification, breakout setups, and more.
Added a new input parameter decimals that allows you to control the decimal precision:
Set to -1 (default) for automatic detection based on the symbol's minimum tick size
Set to 0-8 for a specific number of decimal places.
How it works:
Auto mode (decimals = -1): The script automatically determines how many decimal places to show based on the instrument's minimum tick size. For example:
Forex pairs (0.00001) → 5 decimals
Stocks ($0.01) → 2 decimals
Crypto (0.00000001) → 8 decimals
Manual mode (decimals = 0-8): You can force a specific number of decimal places if needed

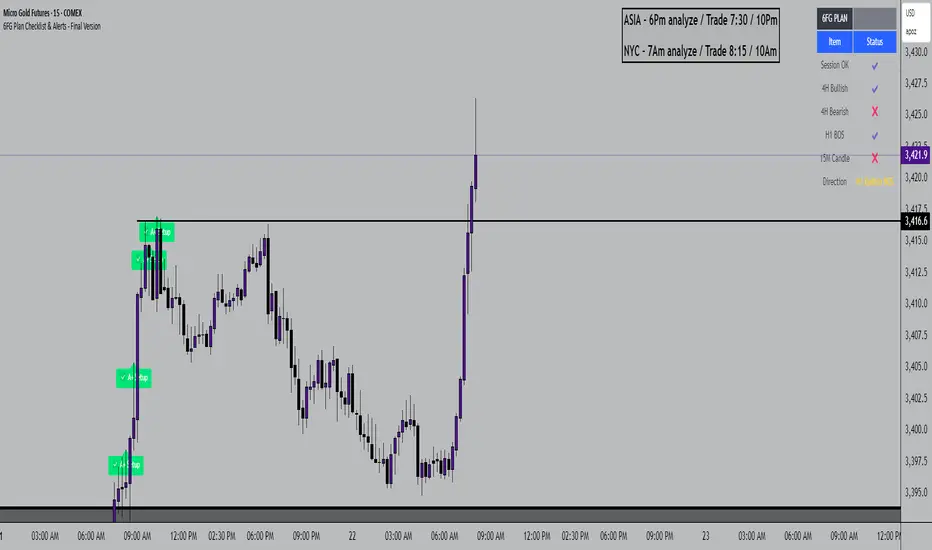
6FG Plan Checklist & Alerts - Final Version🧠 SCRIPT OVERVIEW: "6FG A+ SETUP - Simplified"
This script is designed to identify high-probability A+ trade setups in alignment with your personal 6FG trading plan, based on:
H1 Break of Structure (required)
4H trend confirmation
15M candle confirmation
Session filter
A+ Label & Visual Table Checklist
✅ KEY COMPONENTS
1. Toggle Inputs
These allow you to customize your view and filters without changing the code:
showSession: Only allow alerts inside Asian or NY sessions
show4hTrend: Include or ignore 4H directional bias
show15mConfirm: Include or ignore confirmation from 15M candles
showTable: Display checklist table on chart
showLabel: Display the “✅ A+” label on qualifying bars
2. Session Filter
Defines valid timeframes for trading (Asian or New York)
Helps avoid setups during low-liquidity hours
Controlled by showSession
3. 4H Trend (Confirmation Only)
Uses a 20-period SMA on 4H to detect general bias:
Bullish = Price above SMA
Bearish = Price below SMA
This trend is not mandatory for an alert if toggle is off
4. H1 Break of Structure (REQUIRED)
Looks at the highest high and lowest low of the last 10 candles on the 1H timeframe
Detects either:
Bullish BOS = Current close > highest high
Bearish BOS = Current close < lowest low
This is the core trigger for the A+ setup
If BOS doesn't happen, no entry is valid
5. 15M Confirmation Candles
(Optional - controlled by show15mConfirm)
Checks for one of three confirmation patterns:
Bullish Engulfing
Bearish Engulfing
Pin Bar
This adds confidence but can be toggled off
6. Entry Conditions (A+ Setup)
All the following must be true for entryOK = true:
✅ H1 BOS (required)
✅ Session is valid (if toggle is on)
✅ 15M confirmation pattern (if toggle is on)
✅ 4H trend (if toggle is on)
7. Visual Output
If entryOK = true:
✅ A green "A+" label appears below price
✅ A checklist table on the top-right shows:
Session status ✔️❌
4H bullish/bearish ✔️❌
H1 BOS ✔️❌
15M confirmation ✔️❌
Final Direction: Bullish / Bearish / —
A+ Setup: ✔️❌
8. Alerts
You will receive a TradingView alert when an A+ Setup is detected:
FVG + IFVG Gap (ULTRA) by Aditya NejeThis Indicator shows Fair Value Gap and Inverse Fair Value gaps

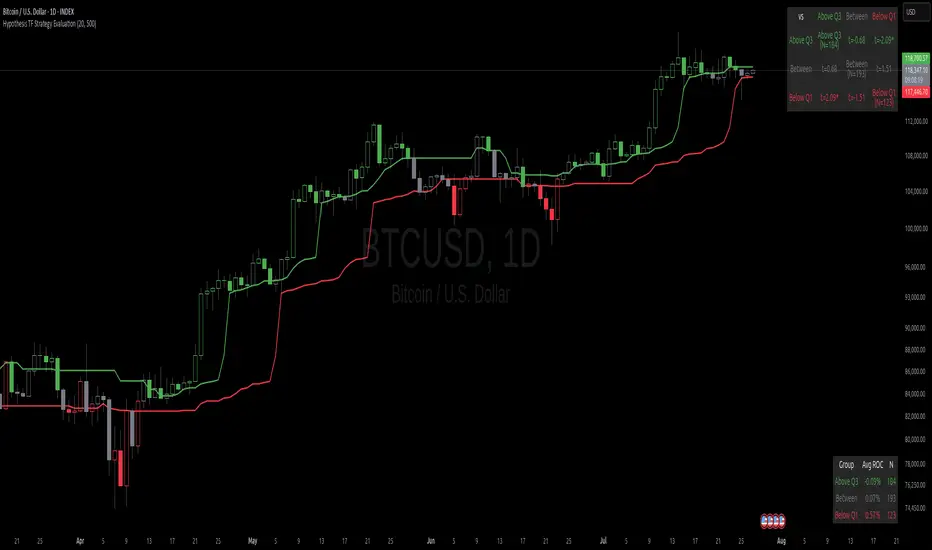
Hypothesis TF Strategy EvaluationThis script provides a statistical evaluation framework for trend-following strategies by examining whether mean returns (measured here as 1-period Rate of Change, ROC) differ significantly across different price quantile groups.
Specifically, it:
Calculates rolling 25th (Q1) and 75th (Q3) percentile levels of price over a user-defined window.
Classifies returns into three groups based on whether price is above Q3, between Q1 and Q3, or below Q1.
Computes mean returns and sample sizes for each group.
Performs Welch's t-tests (which account for unequal variances) between groups to assess if their mean returns differ significantly.
Displays results in two tables:
Summary Table: Shows mean ROC and number of observations for each group.
Hypothesis Testing Table: Shows pairwise t-statistics with significance stars for 95% and 99% confidence levels.
Key Features
Rolling quantile calculations: Captures local price distributions dynamically.
Robust hypothesis testing: Welch's t-test allows for heteroskedasticity between groups.
Significance indicators: Easy visual interpretation with "*" (95%) and "**" (99%) significance levels.
Visual aids: Plots Q1 and Q3 levels on the price chart for intuitive understanding.
Extensible and transparent: Fully commented code that emphasizes the evaluation process rather than trading signals.
Important Notes
Not a trading strategy: This script is intended as a tool for research and validation, not as a standalone trading system.
Look-ahead bias caution: The calculation carefully avoids look-ahead bias by computing quantiles and ROC values only on past data at each point.
Users must ensure look-ahead bias is removed when applying this or similar methods, as look-ahead bias would artificially inflate performance and statistical significance.
The statistical tests rely on the assumption of independent samples, which might not fully hold in financial time series but still provide useful insights
Usage Suggestions
Use this evaluation framework to validate hypotheses about the behavior of returns under different price regimes.
Integrate with your strategy development workflow to test whether certain market conditions produce statistically distinct return distributions.
Example
In this example, the script was run with a quantile length of 20 bars and a lookback of 500 bars for ROC classification.
We consider a simple hypothetical "strategy":
Go long if the previous bar closed above Q3 the 75th percentile).
Go short if the previous bar closed below Q1 (the 25th percentile).
Stay in cash if the previous close was between Q1 and Q3.
The screenshot below demonstrates the results of this evaluation. Surprisingly, the "long" group shows a negative average return, while the "short" group has a positive average return, indicating mean reversion rather than trend following.
The hypothesis testing table confirms that the only statistically significant difference (at 95% or higher confidence) is between the above Q3 and below Q1 groups, suggesting a meaningful divergence in their return behavior.
This highlights how this framework can help validate or challenge intuitive assumptions about strategy performance through rigorous statistical testing.
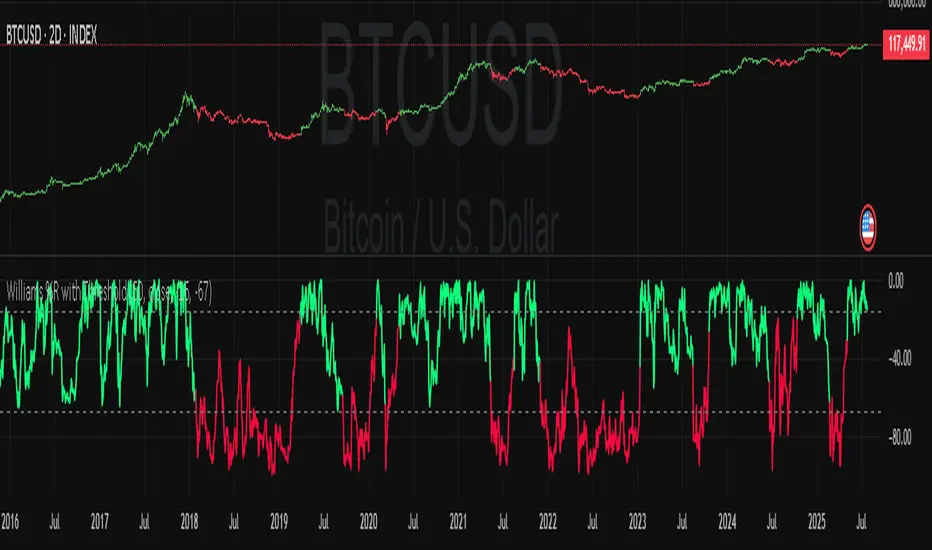
Williams Percent Range with ThresholdEnhance your trading analysis with the "Williams Percent Range with Threshold" indicator, a powerful modification of the classic Williams %R oscillator. This custom version introduces customizable uptrend and downtrend thresholds, combined with dynamic candlestick coloring to visually highlight market trends. Originally designed to identify overbought and oversold conditions, this script takes it a step further by allowing traders to define specific threshold levels for trend detection, making it a versatile tool for momentum and trend-following strategies.
Key Features:
Customizable Thresholds: Set your own uptrend (default: -16) and downtrend (default: -67) thresholds to adapt the indicator to your trading style.
Dynamic Candlestick Coloring: Candles turn green during uptrends, red during downtrends, and gray in neutral conditions, providing an intuitive visual cue directly on the price chart.
Flexible Length: Adjust the lookback period (default: 50) to fine-tune sensitivity.
Overlay Design: Integrates seamlessly with your price chart, enhancing readability without clutter.
How It Works:
The Williams %R calculates the current closing price's position relative to the highest and lowest prices over a specified period, expressed as a percentage between -100 and 0. This version adds trend detection based on user-defined thresholds, with candlestick colors reflecting the trend state. The indicator plots the %R line with color changes (green for uptrend, red for downtrend) and includes dashed lines for the custom thresholds.
Usage Tips:
Use the uptrend threshold (-16 by default) to identify potential buying opportunities when %R exceeds this level.
Apply the downtrend threshold (-67 by default) to spot selling opportunities when %R falls below.
Combine with other indicators (e.g., moving averages or support/resistance levels) for confirmation signals.
Adjust the length and thresholds based on the asset's volatility and your trading timeframe.
HTF OHLC Candle + 50% @MaxMaseratiHTF OHLC Candle + 50% @MaxMaserati
This advanced multi-timeframe indicator displays higher timeframe OHLC data as visual candle boxes and extended key levels on lower timeframe charts, providing essential context for institutional trading decisions.
Core Functionality:
Multi-Timeframe Box Display:
Main Timeframe Box (Default H4): Shows complete higher timeframe candles as colored boxes with separate body and wick visualization, including bullish (green) and bearish (red) candle representation with customizable transparency levels.
Independent Box 2 (Default M15): Secondary timeframe display with lime/fuchsia color scheme, allowing traders to monitor intermediate timeframes simultaneously with different visual styling.
Independent Box 3 (Default H1): Third independent timeframe with blue/orange color scheme, providing additional context for multi-timeframe analysis and confluence identification.
OHLC Level Analysis:
Each timeframe box includes individual Open, High, Low, and Close level lines with customizable colors and visibility settings. These levels act as key support and resistance zones that institutional traders often respect.
50% Retracement Levels:
Automatic calculation and display of 50% levels between each timeframe's high and low, representing critical equilibrium zones where price often finds support or resistance during retracements.
Extended Line System:
Current Live Timeframe Extended Lines: Real-time extension of the forming candle's Open, High, Low, and 50% levels with customizable line weights and label positioning.
TF2 Extended Lines (Default H4): Previous completed candle's key levels extended forward, showing immediate higher timeframe reference points for current price action.
TF3 Extended Lines (Default Daily): Longer-term reference levels from daily or weekly timeframes, providing macro trend context and major institutional levels.
Key Features:
Smart Timeframe Detection: Only displays boxes for timeframes higher than the current chart timeframe, preventing redundant information and maintaining chart clarity.
Global Box Limit Control: Intelligent cleanup system that maintains optimal performance by limiting total displayed elements while preserving the most recent and relevant timeframe periods.
Comprehensive Customization: Full control over colors, transparency, line weights, label sizes, and visibility for each timeframe component, allowing personalized setups for different trading styles.
Label System: Automatic timeframe identification labels (H4, M15, D1, etc.) positioned on each box for instant timeframe recognition and clear multi-timeframe organization.
Current Candle Options: Optional display of forming/current candles for each timeframe, enabling real-time monitoring of developing price action and potential setup completion.
This indicator is essential for traders utilizing multi-timeframe analysis, institutional trading concepts, and higher timeframe confluence strategies, providing clear visual representation of key levels and candle structures that drive major market movements.

S&R Zones MTF (TechnoBlooms)S&R Zones MTF – Multi-Timeframe Support & Resistance Boxes
🔍 Overview
S&R Zones MTF is a professional-grade yet beginner-friendly indicator that dynamically plots Support & Resistance zones across multiple timeframes, helping traders recognize high-probability reversal areas, entry confirmations, and price reaction points.
This tool visualizes structured zones as colored boxes, allowing both new and experienced traders to analyze multi-timeframe confluence with ease and clarity.
🧠 What Is This Indicator?
S&R Zones MTF automatically detects the most significant support and resistance levels from up to four custom timeframes, using a configurable lookback period. These zones are displayed as colored horizontal boxes directly on the chart, making it easy to:
Spot where price has historically reacted
Identify potential reversal or breakout zones
Confirm entries with institutional-style precision
🛠️ Key Features
✅ Multi-Timeframe Zone Detection (up to 4 timeframes)
📦 Auto Plotted Boxes for Support (Blue) & Resistance (Pink)
🧱 Dynamic Height based on average price range or fixed input
🏷️ Timeframe Labels to instantly identify zone origin
🎛️ Customizable inputs: Lookback length, box color, height style
🔁 Real-time updates as price structure changes
🎓 Educational & Easy to Use
Whether you’re a new trader learning about price structure, or a professional applying institutional concepts, this tool offers an educational layout to understand:
How price respects historic zones
Why multi-timeframe zones offer stronger confluence
How to use zones for entry, exit, or risk placement
📈 How to Use (Multi-Timeframe Strategy)
Select Your Timeframes – Customize up to 4 higher timeframes (e.g., 1m, 5m, 15m, 1h).
Observe Overlapping Zones – When multiple timeframes agree, those zones are more significant.
Entry Confirmation – Wait for price to reach a zone, then look for reversal patterns (engulfing candle, pin bar, etc.)
Combine with Other Tools – Use alongside indicators like RSI, MACD, or Order Blocks for added confidence.
💡 Pro Tips
Zones from higher timeframes (1H, 4H) are often more powerful and reliable.
Confluence matters: If a 15m support zone aligns with a 1H support zone — that's a high-probability reaction area.
Use break-and-retest strategies with zone rejections for sniper entries.
Enable "Auto Height" for a more adaptive, volatility-based zone display.
🌟 Summary
S&R Zones MTF blends precision, clarity, and professional analysis into a visual structure that’s easy to understand. Whether you're learning support & resistance or optimizing your MTF edge — this tool will bring clarity to your charts and confidence to your trades.

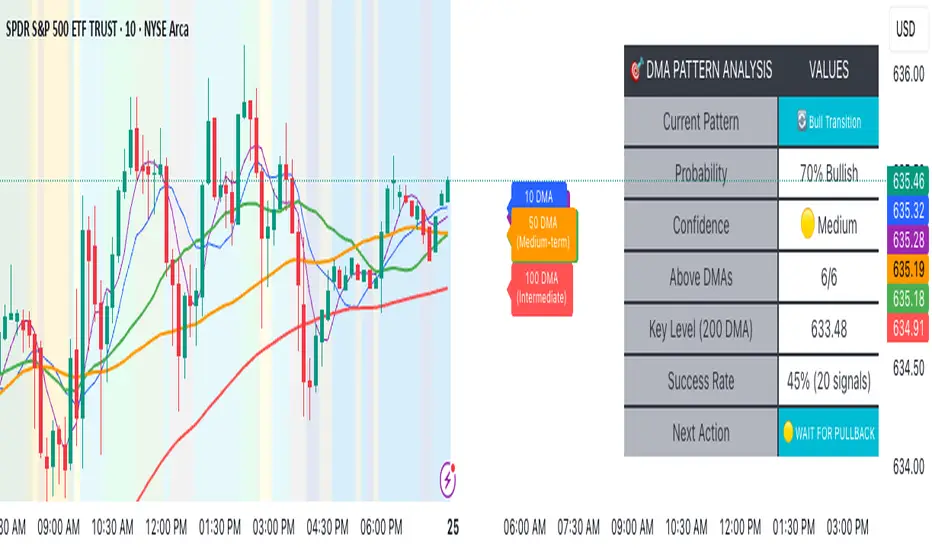
Advanced DMA Pattern Detection SystemAdvanced DMA Pattern Detection System with Smart Intelligence
Professional-grade moving average indicator that combines traditional DMA analysis with advanced pattern recognition and probabilistic forecasting.
Core Features:
6 Key DMAs (5, 10, 20, 50, 100, 200) with descriptive labels showing trading purpose
Advanced Pattern Recognition - Detects Institutional Accumulation, Distribution Phases, Bull/Bear Transitions, and Choppy Markets
Probability Engine - Assigns confidence scores (0-100%) with Low/Medium/High classifications
Historical Validation - Tracks success rate of last 20 pattern signals for real performance data
Smart Alert System - Only triggers on significant pattern changes (20%+ probability shifts)
Dual Display System:
Movable Information Table - Shows current pattern, probability, confidence level, success rate, and recommended action
Chart Alerts & Background Colors - Visual confirmation of high-confidence setups (80%+ patterns)
Traditional DMA Labels - Clear identification of each average's trading significance
Complete Customization:
Master on/off controls for entire system
Individual toggles for all components (DMAs, table, alerts, colors)
Adjustable alert sensitivity (Conservative/Medium/Aggressive)
6 table positions to fit any chart layout
Perfect For: Swing traders, position traders, and anyone wanting systematic trend analysis with quantified probability scores rather than subjective interpretation.
Bottom Line: Transforms basic moving averages into an intelligent trading system that tells you exactly what the market structure means and what to do about it.
BE-Indicator Aggregator toolkit█ Overview:
BE-Indicator Aggregator toolkit is a toolkit which is built for those we rely on taking multi-confirmation from different indicators available with the traders. This Toolkit aid's traders in understanding their custom logic for their trade setups and provides the summarized results on how it performed over the past.
█ How It Works:
Load the external indicator plots in the indicator input setting
Provide your custom logic for the trade setup
Set your expected SL & TP values
█ Legends, Definitions & Logic Building Rules:
Building the logic for your trade setup plays a pivotal role in the toolkit, it shall be broken into parts and toolkit aims to understand each of the logical parts of your setup and interpret the outcome as trade accuracy.
Toolkit broadly aims to understand 4 types of inputs in "Condition Builder"
Comments : Line which starts with single quotation ( ' ) shall be ignored by toolkit while understanding the logic.
Note: Blank line space or less than 3 characters are treated equally to comments.
Long Condition: Line which starts with " L- " shall be considered for identifying Long setups.
Short Condition: Line which starts with " S- " shall be considered for identifying Short setups.
Variables: Line which starts with " VAR- " shall be considered as variables. Variables can be one such criteria for Long or short condition.
Building Rules: Define all variables first then specify the condition. The usual declare and assign concept of programming. :p)
Criteria Rules: Criteria are individual logic for your one parent condition. multiple criteria can be present in one condition. Each parameter should be delimited with ' | ' key and each criteria should be delimited with ' , ' (Comma with a space - IMPORTANT!!!)
█ Sample Codes for Conditional Builder:
For Trading Long when Open = Low
For Trading Short when Open = High with a Red candle
'Long Setup <---- Comment
L-O|E|L
' E <- in the above line refers to Equals ' = '
'Short Setup
S-AND:O|E|H, O|G|C
' 2 Criteria for used building one condition. Since, both have to satisfied used "AND:" logic.
Understanding of Operator Legends:
"E" => Refers to Equals
"NE" => Refers to Not Equals
"NEOR" => Logical value is Either Comparing value 1 or Comparing value 2
"NEAND" => Logical value is Comparing value 1 And Comparing value 2
"G" => Logical value Greater than Comparing value 1
"GE" => Logical value Greater than and equal to Comparing value 1
"L" => Logical value Lesser than Comparing value 1
"LE" => Logical value Lesser than and equal to Comparing value 1
"B" => Logical value is Between Comparing value 1 & Comparing value 2
"BE" => Logical value is Between or Equal to Comparing value 1 & Comparing value 2
"OSE" => Logical value is Outside of Comparing value 1 & Comparing value 2
"OSI" => Logical value is Outside or Equal to Comparing value 1 & Comparing value 2
"ERR" => Logical value is 'na'
"NERR" => Logical value is not 'na'
"CO" => Logical value Crossed Over Comparing value 1
"CU" => Logical value Crossed Under Comparing value 1
Understanding of Condition Legends:
AND: -> All criteria's to be satisfied for the condition to be True.
NAND: -> Output of AND condition shall be Inversed for the condition to be True.
OR: -> One of criteria to be satisfied for the condition to be True.
NOR: -> Output of OR condition shall be Inversed for the condition to be True.
ATLEAST:X: -> At-least X no of criteria to be satisfied for the condition to be True.
Note: "X" can be any number
NATLEAST:X: -> Output of ATLEAST condition shall be Inversed for the condition to be True
WASTRUE:X: -> Single criteria WAS TRUE within X bar in past for the condition to be True.
Note: "X" can be any number.
ISTRUE:X: -> Single criteria is TRUE since X bar in past for the condition to be True.
Note: "X" can be any number.
Understanding of Variable Legends:
While Condition Supports 8 Types, Variable supports only 6 Types listed below
AND: -> All criteria's to be satisfied for the Variable to be True.
NAND: -> Output of AND condition shall be Inversed for the Variable to be True.
OR: -> One of criteria to be satisfied for the Variable to be True.
NOR: -> Output of OR condition shall be Inversed for the Variable to be True.
ATLEAST:X: -> At-least X no of criteria to be satisfied for the Variable to be True.
Note: "X" can be any number
NATLEAST:X: -> Output of ATLEAST condition shall be Inversed for the Variable to be True
█ Sample Outputs with Logics:
1. RSI Indicator + Technical Indicator: StopLoss: 2.25 against Reward ratio of 1.75 (3.94 value)
Plots Used in Indicator Settings:
Source 1:- RSI
Source 2:- RSI Based MA
Source 3:- Strong Buy
Source 4:- Strong Sell
Logic Used:
For Long Setup : RSI Should be above RSI Based MA, RSI has been Rising when compared to 3 candles ago, Technical Indicator signaled for a Strong Buy on the current candle, however in last 6 candles Technical indicator signaled for Strong Sell.
Similarly Inverse for Short Setup.
L-AND:ES1|GE|ES2, ES1|G|ES1
L-ES3|E|1
L-OR:ES4 |E|1, ES4 |E|1, ES4 |E|1, ES4 |E|1, ES4 |E|1, ES4 |E|1
S-AND:ES1|LE|ES2, ES1|L|ES1
S-ES4|E|1
S-OR:ES3 |E|1, ES3 |E|1, ES3 |E|1, ES3 |E|1, ES3 |E|1, ES3 |E|1
'Note: Last OR condition can also be written by using WASTRUE definition like below
'L-WASTRUE:6:ES4|E|1
'S-WASTRUE:6:ES3|E|1
Output:
2. Volumatic Support / Resistance Levels :
Plots Used in Indicator Settings:
Source 1:- Resistance
Source 2:- Support
Logic Used:
For Long Setup : Long Trade on Liquidity Support.
For Short Setup : Short Trade on Liquidity Resistance.
'Variable Named "ChkLowTradingAbvSupport" is declared to check if last 3 candles is trading above support line of liquidity.
VAR-ChkLowTradingAbvSupport:AND:L|G|ES2, L |G|ES2, L |G|ES2
'Variable Named "ChkCurBarClsdAbv4thBarHigh" is declared to check if current bar closed above the high of previous candle where the Liquidity support is taken (4th Bar).
VAR-ChkCurBarClsdAbv4thBarHigh:OR:C|GE|H , L|G|H
'Combining Condition and Variable to Initiate Long Trade Logic
L-L |LE|ES2
L-AND:ChkLowTradingAbvSupport, ChkCurBarClsdAbv4thBarHigh
VAR-ChkHghTradingBlwRes:AND:H|L|ES1, H |L|ES1, H |L|ES1
VAR-ChkCurBarClsdBlw4thBarLow:OR:C|LE|L , H|L|L
S-H |GE|ES1
S-AND:ChkHghTradingBlwRes, ChkCurBarClsdBlw4thBarLow
Output 1: Day Trading Version
Output 2: Scalper Version
Output 3: Position Version

Gold vs DXYThe 30-day rolling correlation between Gold (XAU/USD) and the US Dollar Index (DXY) shows how closely the two move together — or more often, in opposite directions — over the last 30 trading days. In most market environments, the relationship is pretty straightforward: when the dollar goes up, gold tends to go down, and vice versa. That’s because gold is priced in dollars, so a stronger dollar makes it more expensive for international buyers, which usually softens demand.
But it’s not always that simple. There are times when this inverse correlation breaks down. For example, if real yields (like the US 10-year yield minus inflation expectations) are rising, that can pressure gold even if the dollar is falling — because higher real returns elsewhere make gold less attractive. Another case is when other currencies, like the euro or yen, rally strongly on their own central bank decisions. This can pull DXY lower without necessarily signaling weakness in the U.S. economy — meaning gold might not benefit much.
There are also “risk-on” moments where investors rotate into equities or crypto, selling off both gold and the dollar in favor of yield or momentum. And during periods of crisis or uncertainty, both gold and the dollar can rise together as safe-haven assets, breaking the usual pattern entirely.
That’s why tracking the rolling correlation is helpful. It shows whether the historical relationship between gold and the dollar is still holding — or if we’re entering a different market regime. It’s not about predicting exact price moves, but about understanding the current backdrop. When gold and DXY are moving out of sync as expected, it can support your trade thesis. But when the correlation flattens or flips, it’s often a sign to dig deeper — macro forces may be shifting.

HMA Trend Line (Croc Signal Line)HMA Trend Line (Croc Signal Line) — The Ultimate Hull Moving Average Trend Indicator
Full English description here:
What is the HMA Trend Line (Croc Signal Line)?
The HMA Trend Line (Croc Signal Line) is a powerful, adaptive trend indicator for TradingView, based on the Hull Moving Average (HMA). This indicator is designed to help traders identify real market trends with less lag and reduced noise compared to traditional moving averages like SMA (Simple Moving Average) and EMA (Exponential Moving Average).
Why use the HMA Trend Line?
+ Faster Trend Detection: The Hull Moving Average (HMA) responds more quickly to price action, giving you earlier buy and sell signals.
+ Smoother and Cleaner: It provides a visually clean trend line that avoids the choppiness of classic EMAs and SMAs.
+ Reduced Lag: The HMA Trend Line follows the market closer, helping you avoid late entries or exits and spot trend reversals sooner.
+ Dynamic Support and Resistance: Use the line as a dynamic support or resistance to manage trades and identify pullbacks or breakouts.
What does “Croc Signal Line” mean?
The “Croc” in Croc Signal Line stands for:
+ Clean
+ Responsive
+ Optimized
+ Curve
This highlights the unique advantage of this indicator: a curve that is both fast-reacting and smooth, helping traders focus on real trends and filter out market noise.
How does the Hull Moving Average (HMA) work?
The HMA was developed by Alan Hull and uses weighted moving averages and a unique calculation to deliver both responsiveness and smoothness. Unlike standard moving averages, the HMA reacts faster to new price moves and avoids false signals in ranging or volatile markets.
How to use the HMA Trend Line (Croc Signal Line) on TradingView?
+ Watch for price crossing above the trend line for potential bullish signals, and below for bearish signals.
+ Use on any timeframe: from 1-minute scalping to daily, weekly, or even monthly charts.
+ Works with all asset classes: Forex, stocks, indices, cryptocurrencies, commodities, and futures.
+ Combine with other indicators (like Stochastics, RSI, or volume) for confirmation and to build your unique trading strategy.
+ Adjust the Signal Line Period for your market and style: shorter periods for faster markets, longer for smoother trends.
Who should use this indicator?
+ Day traders, swing traders, and long-term investors looking for reliable, actionable trend signals.
+ Anyone seeking a cleaner, more responsive alternative to the classic moving averages.
+ Traders who want a simple, visually clear way to filter out market noise and see real price direction.
Disclaimer:
This indicator is for educational and study purposes only. Please perform your own backtesting and analysis before using it in live trading. This script does not constitute financial advice. Use at your own risk.
--------

Fair Value MSThis indicator introduces rigid rules to familiar concepts to better capture and visualize Market Structure and Areas of Support and Resistance in a way that is both rule-based and reactive to market movements.
Typical "Market Structure" or "Zig-Zag" methods determine swing points based on fixed thresholds (length or percentage). While this does provide rigid structure, the results may be lagging or confusing due to the timing, since it is fixed to static parameters.
I believe the concept of Fair Value Gaps can solve this problem.
As you will notice, there are no length settings in this indicator.
> FVG Market Structure
Fair Value Gaps are a well known concept used to indicate directional intent, forming when price moves aggressively in one direction, leaving behind an imbalance between buyers and sellers. While the term FVG was popularized by ICT, the underlying concept predates them, known historically as imbalances, inefficiencies, or liquidity voids in institutional trading.
Note: For simplicity, in this indicator they'll be called FVGs.
By reading into this, we are able to clearly and rigidly define market structure simply by "looking" at the chart, using objective price events rather than subjective interpretation, or lengths.
By using FVGs to determine structure direction, the length, and speed of identification lies entirely on the market. If an FVG Down occurs immediately after a New Higher High forms, it is reasonable to assume there was a seller at that point, so the script would indicate a New Swing High.
The script is NOT stuck, waiting for a % retrace, or # bars to pass to identify it as such.
Sometimes the market is in a steady trend in a single direction and no FVGs form; therefore, no structure forms. -> Why would we try to impose structure on a clear trend?
Ultimately, the FVG Structure Method uses real reactions from the market to determine Market structure, and is not fixed to specific parameters.
As with other market structure indicators, "Market Structure Breaks" are still identifiable when price moves outside the most recent swing points.
These are helpful to indicate larger direction. In the following section you will see how these help us determine when we should start the search for an "Area of Interest (AOI)".
> Areas of Interest (AOIs)
"Area of Interest (AOI)" is a generalized term, and could refer to many types of zones you might recognize under different names. While the AOIs in this indicator are specialized in their own way, I have chosen to simply use the term "Area of Interest" because it’s more important to understand how they behave and why they exist than to focus on what they’re called.
The goal of an AOI is to point out reasonable areas where buyers or sellers may be staging, as is typical with support and resistance.
In order to reasonably identify these areas, we look for cause and effect relationships. When considering these relationships, it's easier to understand the placement of the points to define each zone.
(Buyer Examples)
Cause: Strong Buyers step in at Swing Low
Effect: Fair Value Gap Forms
Cause: Sustained Buying Pressure
Effect: Market Structure Breaks
In this example, The zone is drawn from the Swing Low, to the Bottom of the FVG closest to the swing point.
In theory, the participation at the swing point was strong and aggressive enough to create the FVG imbalance. Which then found acceptance and continued into a Market Structure Break. So with these AOIs, we are trying to locate the aggressive Buyers or Sellers which were positioned BEFORE the FVG.
These Zones are intended to act as areas to look for reactions from market participants, to judge where price may be going. When revisiting these zones, we look for a reaction or a break, to further provide us information to if the buyers or sellers are still there.
As seen in the screenshot above, The information we gain is not from the creation of these zones, but from the behavior we witness when these zones are revisited.
Technical Note: In this indicator, Market Structure Breaks are only considered when price closes outside the recent swing points. Wicks are not considered as confirmation, therefore are not used to detect structural breaks.
Inside each AOI you can optionally display a readout of the volume which accumulated during the time starting at the swing point and going until the closing bar of the FVG.
Note: We are counting volume until the closing bar of the FVG since the FVG is a 3 bar formation, and aggressive volume is required throughout to create the imbalance.
There are multiple FVGs that typically occur in a single direction, but we do not look to every single one to be indicative of structure, only the first FVG in the opposite direction of the previous direction (which is determined by previous FVGs)
You will probably notice, the AOIs do not form from the closest swing or FVG to the break, this is because we are targeting larger directional changes to draw these AOIs from.
Since they do not always happen perfectly every time, the AOI formation waits for an FVG to occur AND a Market structure break to happen. One without the other will result in no Zone displaying.
> Reflection Lines
While they may seem slightly redundant, Reflection Lines serve as reminders of previous support and resistance pivots. They are drawn at the same Pivots where and AOI is formed, and extend beyond the mitigation of the AOI.
These lines are often points of price to look for "Support Flips", a re-test pattern where price trades through previous support (or resistance) then returns to it and rejects, continuing into a larger move or trend.
Their namesake is based on the behavior of price, "reflecting" at these levels.
The Reflection lines are simple and change color based on price's location.
If price is above, we would typically look to a reflection line in with support in mind.
As a basic filter, these lines use an average price to determine their color, this way they will not change their color as frequently in choppy situations.
> Session Start/End Lines
For analysis purposes and trade review, it is helpful to analyze with context.
For that reason, I have implemented start and end session lines into the indicator, these are helpful when reviewing historical charts to not provide additional context.
By default, they are set to the NYSE Session, but can be changed to fit any needs.
These lines are not advanced, and simply draw a line as the chart passes the start and end of the sessions. It's very likely that you may need to adjust the session for your specific needs.
Note: The Timezone can be adjusted within the code if needed. By Default, the indicator uses "America/New_York" Timezone.
> Conclusion
If you’ve ever felt like your structure tools were confusing or lagging, drawing zones too late, or zones that simply don't make sense, this should feel like a breath of fresh air.
By removing arbitrary length settings and instead using FVGs to define structure and as a basis for AOIs, you're getting a more accurate look at what price is doing and where it's reacting from.
This indicator is rule-based, reactive, and aims to keep things logical without fluff or false confidence.
Enjoy!

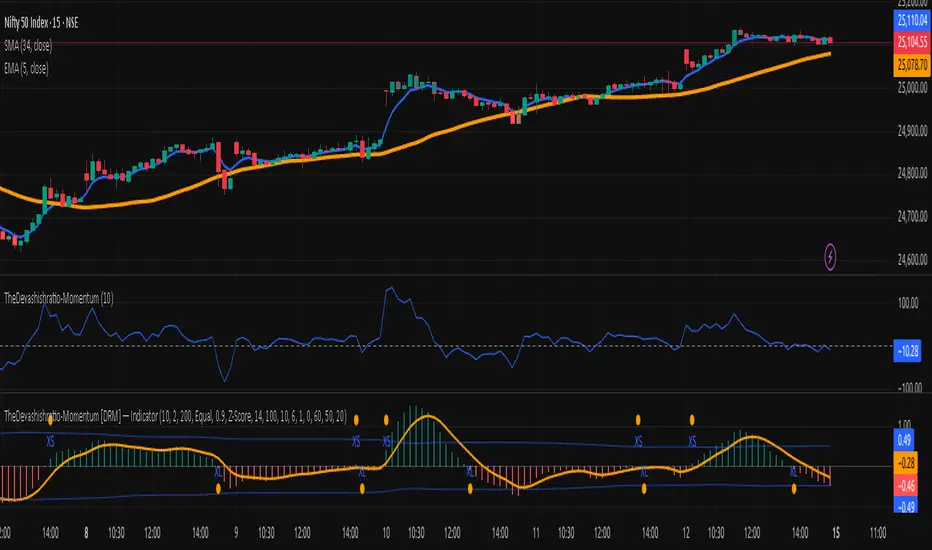
TheDevashishratio-MomentumThis custom momentum indicator is inspired by Fibonacci principles but builds a unique sequence with steps of 0.5 (i.e., 0, 0.5, 1, 1.5, 2, ...). Instead of traditional Fibonacci numbers, each step functions as a dynamic lookback period for a momentum calculation. By cycling through these fractional steps, you capture a layered view of price momentum over varying intervals.
The "Fibonacci" Series Used
Sequence:
0, 0.5, 1, 1.5, 2, … up to a user-defined maximum
For trading indicators, lag values (lookback) must be integers, so each step is rounded to the nearest integer and duplicates are removed, resulting in lookbacks:
1, 2, 3, 4, ... N
Indicator Logic
For each selected lookback, the indicator calculates momentum as:
Momentum
n
=
close
−
close
Momentum
n
=close−close
Where:
close = current price
n = integer from your series of
You can combine these momenta for an averaged or weighted momentum profile, displaying the composite as an oscillator.
How To Use
Bullish: Oscillator above zero indicates positive composite momentum.
Bearish: Oscillator below zero indicates negative composite momentum.
Crosses: A cross from below to above zero may signal emerging bullish momentum, and vice versa.
Customization
Adjust max_step to control how many interval lags you want in your composite.
This oscillator averages across many short and mid-term momenta, reducing noise while still being sensitive to changes.
Summary
TheDevashishratio-Momentum offers a fresh momentum oscillator, blending a "Fibonacci-like" progression with technical analysis, and can be easily copy-pasted into TradingView to experiment and refine your edge.
For more on momentum indicator logic or how to use arrays and series in Pine Script, explore TradingView's official documentation and open-source scripts
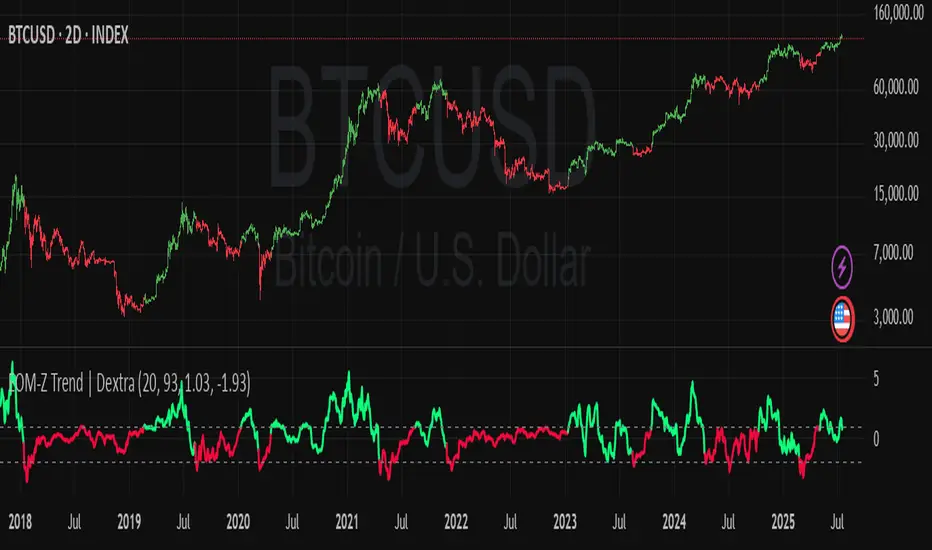
Ease of Movement Z-Score Trend | DextraGeneral Description:
The "Ease of Movement Z-Score Trend | Dextra" (EOM-Z Trend) is an innovative technical analysis tool that combines the Ease of Movement (EOM) concept with Z-Score to measure how easily price moves relative to volume, while identifying market trends with intuitive visualization. This indicator is designed to help traders detect uptrend and downtrend phases with precision, enhanced by candle coloring for direct trend representation on the chart.
Key Features
Ease of Movement (EOM): Measures how easily price moves based on the change in the midpoint price and volume, normalized with Z-Score for statistical analysis.
Z-Score Normalization: Provides an indication of deviations from the mean, enabling the identification of overbought or oversold conditions.
Adjustable Thresholds: Users can customize upper and lower thresholds to define trend boundaries.
Candle Coloring: Visual trend representation with green (uptrend), red (downtrend), and gray (neutral) candles.
Flexibility: Adjustable for different timeframes and assets.
How It Works
The indicator operates through the following steps:
EOM Calculation:
hl2 = (high + low) / 2: Calculates the average midpoint price per bar.
eom = ta.sma(10000 * ta.change(hl2) * (high - low) / volume, length): EOM is computed as the smoothed average of the price midpoint change multiplied by the price range per unit volume, scaled by 10,000, over length bars (default 20).
Z-Score Calculation:
mean_eom = ta.sma(eom, z_length): Average EOM over z_length bars (default 93).
std_dev_eom = ta.stdev(eom, z_length): Standard deviation of EOM.
z_score = (eom - mean_eom) / std_dev_eom: Z-Score indicating how far EOM deviates from its mean in standard deviation units.
Trend Detection:
upperthreshold (default 1.03) and lowerthreshold (default -1.63): Thresholds to classify uptrend (if Z-Score > upperthreshold) and downtrend (if Z-Score < lowerthreshold).
eom_is_up and eom_is_down: Logical variables for trend status.
Visualization:
plot(z_score, ...): Z-Score line plotted with green (uptrend), red (downtrend), or gray (neutral) coloring.
plotcandle(...): Candles colored green, red, or gray based on trend.
hline(...): Dashed lines marking the thresholds.
Input Settings
EOM Length (default 20): Period for calculating EOM, determining sensitivity to price changes.
Z-Score Lookback Period (default 93): Period for calculating the Z-Score mean and standard deviation.
Uptrend Threshold (default 1.03): Minimum Z-Score value to classify an uptrend.
Downtrend Threshold (default -1.93): Maximum Z-Score value to classify a downtrend.
How to Use
Installation: Add the indicator via the "Indicators" menu in TradingView and search for "EOM-Z Trend | Dextra".
Customization:
Adjust EOM Length and Z-Score Lookback Period based on the timeframe (e.g., 20 and 93 for daily timeframes).
Set Uptrend Threshold and Downtrend Threshold according to preference or asset characteristics (e.g., lower to 0.8 and -1.5 for volatile markets).
Interpretation:
Uptrend (Green): Z-Score above upperthreshold, indicating strong upward price movement.
Downtrend (Red): Z-Score below lowerthreshold, indicating significant downward movement.
Neutral (Gray): Conditions between thresholds, suggesting a sideways market.
Use candle coloring as the primary visual guide, combined with the Z-Score line for confirmation.
Advantages
Intuitive Visualization: Candle coloring simplifies trend identification without deep analysis.
Flexibility: Customizable parameters allow adaptation to various markets.
Statistical Analysis: Z-Score provides a robust perspective on price deviations from the norm.
No Repainting: The indicator uses historical data and does not alter values after a bar closes.
Limitations
Volume Dependency: Requires accurate volume data; an error occurs if volume is unavailable.
Market Context: Effectiveness depends on properly tuned thresholds for specific assets.
Lack of Additional Signals: No built-in alerts or supplementary confirmation indicators.
Recommendations
Ideal Timeframe: Daily (1D) or (2D) for stable trends.
Combination: Pair with others indicators for signal validation.
Optimization: Test thresholds on historical data of the traded asset for optimal results.
Important Notes
This indicator relies entirely on internal TradingView data (high, low, close, volume) and does not integrate on-chain data. Ensure your data provider supports volume to avoid errors. This version (1.0) is the initial release, with potential future updates including features like alerts or multi-timeframe analysis.
Max Drawdown (Asset-Based Lookback)Max Drawdown (Long-Term Trading)
🟦 Majors BTC, ETH, BNB, LTC 180 – 365
Captures full correction cycles and recovery patterns (6–12 months).
🟩 Altcoins SOL, ADA, DOT, LINK, AVAX 90 – 180
Alts move faster than majors; 3–6 months catches most large swings.
🟥 Meme coins DOGE, SHIB, PEPE, FLOKI 60 – 120
Volatile with quick trend reversals; 2–4 months captures parabolic runs + drawdowns.
📅 Chart Timeframe:
Use Daily (1D) timeframe for all these.
For extra macro insight, try Weekly (1W) with 52 bars (≈ 1 year).
Compare multiple assets using the same period to assess relative risk.
If you're building a long-term portfolio, combine this with:
200-day SMA or EMA for trend context.
Sharpe Ratio or Sortino Ratio if you're looking for risk-adjusted return metrics.

8 AM & 9 AM NY Candle HighlighterThis indicator helps me to know when the 9am NY candle has closed above or below the previous candle.

Expansion Triangle [TradingFinder] MegaPhone Broadening🔵 Introduction
The Expanding Triangle, also known as the Broadening Formation, is one of the key technical analysis patterns that clearly reflects growing market volatility, increasing indecision among participants, and the potential for sharp price explosions.
This pattern is typically defined by a sequence of higher highs and lower lows, forming within two diverging trendlines. Unlike traditional triangles that converge to a breakout point, the expanding triangle pattern becomes wider over time, leaving no precise apex for a breakout to occur.
From a price action perspective, the pattern represents a prolonged tug-of-war between buyers and sellers, where neither side has taken control yet. Each aggressive swing opens the door to new opportunities whether it's a trend reversal, range trading, or a momentum breakout. This dual nature makes the pattern highly versatile across market conditions, from exhausted trend ends to volatile consolidation zones.
The custom-built indicator for this pattern uses a combination of smart algorithms and detailed analysis of swing dynamics to automatically detect expanding triangles and highlight low-risk entry points.
Traders can use this tool to capitalize on high-probability setups from shorting near the upper edge of the structure with confirmation, to trading bearish breakouts during trend continuations, or entering long positions near the lower boundary during bullish reversals. The chart examples included in this article demonstrate these three highly practical trading scenarios in live market conditions.
A major advantage of this indicator lies in its structural filtering engine, which analyzes the behavior of each price leg in the triangle. With four adjustable filter levels from Very Aggressive, which highlights all potential patterns, to Very Defensive, which only triggers when price actually touches the triangle's trendlines the indicator ensures that only structurally sound and verified setups appear on the chart, reducing noise and false signals significantly.
Long Setup :
Short Setup :
🔵 How to Use
The pattern typically forms in conditions of heightened uncertainty and volatility, where price swings generate a series of higher highs and lower lows. The expanding triangle consists of three key legs bounded by diverging trendlines. The indicator intelligently analyzes each leg's direction and angle to determine whether a valid pattern is forming.
At the core of the indicator’s logic is its leg filtering system, which controls the quality of the pattern and filters out weak or noisy setups. Four structural filter modes are available to suit different trading styles and risk preferences. In Very Aggressive mode, filters are disabled, and the indicator detects any pattern purely based on the sequence of swing points.
This mode is ideal for traders who want to see everything and apply their own discretion.
In Aggressive mode, the indicator checks whether each new leg extends no more than twice the length of the previous one. If a leg overshoots excessively, the structure is invalidated.
In Defensive mode, the filter enforces a minimum movement requirement each leg must move at least 2% of the previous one. This prevents the formation of shallow, weak patterns that visually resemble triangles but lack substance.
The strictest setting, Very Defensive, combines all previous filters and additionally requires the price to physically touch the triangle’s trendlines before issuing a signal. This ensures that setups only appear when real market interaction with key structural levels has occurred, not based on assumptions or geometry alone. This mode is ideal for traders seeking maximum precision and minimal risk.
🟣 Bullish Setup
A bullish setup within the Expanding Triangle pattern occurs when price revisits the lower support boundary after a series of broad swings typically near the third leg of the formation. This area often represents a shift in momentum, where sellers begin to lose strength and buyers prepare to take control.
Ideally, the setup is accompanied by a bullish reversal candle (e.g. doji, pin bar, or engulfing) near the lower trendline. If the Very Defensive filter is active, the indicator will only issue a signal if price makes a confirmed touch on the trendline and reacts from that level. This significantly improves signal accuracy and filters out premature entries.
After confirmation, traders may choose to enter a long position on the bullish candle or shortly afterward. A logical stop-loss is placed just below the recent swing low within the pattern. The target can be set at or near the upper trendline, or projected using the full height of the triangle added to the breakout point. On higher timeframes, this reversal often marks the beginning of a strong uptrend.
🟣 Bearish Setup
A bearish setup forms when price climbs toward the upper resistance trendline, usually as the third leg completes. This is where buyers often begin to show exhaustion, and sellers step in with strength providing an ideal low-risk entry point for short positions.
As with the bullish setup, if the Candle Confirmation filter is enabled, the indicator will only show a signal when a bearish reversal candle forms at the point of contact. If Defensive or Very Defensive filters are also active, the setup must meet strict criteria of proportionate leg movement and an actual trendline touch to qualify.
Once confirmed, traders can enter on the reversal candle, placing a stop-loss slightly above the recent high. The target can be set at the lower trendline or calculated based on the triangle's full height, projected downward. This setup is particularly useful at the end of weak bullish trends or in volatile market tops.
🔵 Settings
🟣 Logic Settings
Pivot Period : Defines how many bars are analyzed to identify swing highs and lows. Higher values detect larger, slower structures, while lower values respond to faster patterns. The default value of 13 offers a balanced sensitivity.
Pattern Filter :
Very Aggressive : Detects all patterns based on point sequence with no structural checks.
Aggressive : Ensures each leg is no more than 2x the size of the previous one.
Defensive : Requires each leg to be at least 2% the size of the previous leg.
Very Defensive : The strictest level; only confirms patterns when price touches trendlines.
Candle Confirmation : When enabled, the indicator requires a valid confirmation candle (doji, pin bar, engulfing) at the interaction point with the trendline before issuing a signal. This reduces false entries and improves entry precision.
🟣 Alert Settings
Alert : Enables alerts for SSS.
Message Frequency : Determines the frequency of alerts. Options include 'All' (every function call), 'Once Per Bar' (first call within the bar), and 'Once Per Bar Close' (final script execution of the real-time bar). Default is 'Once per Bar'.
Show Alert Time by Time Zone : Configures the time zone for alert messages. Default is 'UTC'.
🔵 Conclusion
The Expanding Triangle pattern, with its wide structure and volatility-driven nature, represents chaos but also opportunity. For traders who can read its behavior, it provides some of the most powerful setups for reversals, breakouts, and range-based trades. While the pattern may seem messy at first glance, it is built on clear logic and when properly detected, it offers high-probability opportunities.
This indicator doesn’t just draw expanding triangles it intelligently evaluates their structural quality, validates price interaction through candle confirmation, and allows the trader to fine-tune the detection logic through adjustable filter levels. Whether you’re a reversal trader looking for a turning point, or a breakout trader hunting momentum, this tool adapts to your strategy.
In volatile or uncertain markets, where fakeouts and sudden shifts are common, this indicator can become a cornerstone of your trading system helping you turn volatility into structured, high-quality opportunities.

MA Signal IndicatorMA Signal Indicator
The MA Signal Indicator is a customizable designed to identify potential trading opportunities based on price interactions with a Simple Moving Average (SMA). It incorporates risk management features such as stop-loss (SL), take-profit (TP), and breakeven levels, calculated using the Average True Range (ATR). The indicator is visually intuitive, overlaying trade signals, price levels, and colored zones directly on the chart.
Key Features:
1. Moving Average-Based Signals:
• Generates buy (long) signals when the price crosses above a user-defined SMA (default: 55 periods).
• Generates sell (short) signals when the price crosses below the SMA.
• Long and short trades can be independently enabled or disabled via input settings.
2. Risk Management:
• Stop-Loss (SL): Set as a multiple of the ATR (default: 1x ATR) below the entry price for long trades or above for short trades.
• Take-Profit (TP): Set as a multiple of the ATR (default: 5x ATR) above the entry price for long trades or below for short trades.
• Breakeven Level: A trigger level (default: 2x ATR) where traders may choose to move their stop-loss to breakeven, optionally displayed on the chart.
3. Visual Feedback:
• SMA Line: Plotted in orange (default: 55-period SMA) for trend reference.
• Trade Zone: Highlights the area between the stop-loss and take-profit levels with a semi-transparent green (long) or red (short) background.
• Price Lines: Displays entry price (white), stop-loss (red), take-profit (green), and breakeven level (gray, optional) as horizontal lines during active trades.
• Signal Markers: Triangular markers indicate entry points (green triangle up for long, red triangle down for short).
• Exit Markers: Labels show when a trade hits the take-profit (green checkmark) or stop-loss (red cross).
4. Trade Logic:
• Only one trade is active at a time (long or short).
• Trades are exited when either the stop-loss or take-profit is hit, resetting the indicator for the next signal.
• Ensures signals are only triggered when not already in a trade, avoiding duplicate entries.
Inputs:
• MA Period: Length of the SMA (default: 55).
• ATR Period: Period for ATR calculation (default: 5).
• SL Multiplier: ATR multiplier for stop-loss (default: 1.0).
• TP Multiplier: ATR multiplier for take-profit (default: 5.0).
• Move to Breakeven After: ATR multiplier for breakeven trigger (default: 2.0).
• Show Break Even Line: Option to display the breakeven level (default: true).
• Allow Long Trades: Enable/disable long signals (default: true).
• Allow Short Trades: Enable/disable short signals (default: true).
Use Case:
This indicator is ideal for trend-following traders who want a clear, visual system for entering and exiting trades based on SMA crossovers, with predefined risk and reward levels. It suits both manual and automated trading strategies, providing flexibility to adjust parameters for different markets or timeframes.
Notes:
• The indicator is overlaid on the price chart for easy integration with other analysis tools.
• Users should test and adjust parameters (e.g., MA length, ATR multipliers) to suit their trading style and market conditions.
• The breakeven line is a visual guide; manual adjustment of stops is required as the indicator does not automatically modify trade positions.
This indicator provides a robust framework for disciplined trading with clear entry, exit, and risk management visuals.
Liquidity Swings [Nix]Liquidity Swings Indicator!
It marks recent swing highs and lows on the chart using lines and labels.
Another great feature is that it tracks whether those swing levels are SWEPT (price crosses them again) and either:
Removes swept levels, or
Fades them to indicate they’ve been taken.
You can customize:
Number of swings shown.
Colors, styles, and visibility of lines/labels.
Whether to show highs, lows, or both.
Useful for liquidity analysis.
Usually when these special swings are swept, you can consider moving stops to BE. This is because there should be enough stop losses at the swing points to liquidate others and give more fuel to your trade direction!

Economy RadarEconomy Radar — Key US Macro Indicators Visualized
A handy tool for traders and investors to monitor major US economic data in one chart.
Includes:
Inflation: CPI, PCE, yearly %, expectations
Monetary policy: Fed funds rate, M2 money supply
Labor market: Unemployment, jobless claims, consumer sentiment
Economy & markets: GDP, 10Y yield, US Dollar Index (DXY)
Options:
Toggle indicators on/off
Customizable colors
Tooltips explain each metric (in Russian & English)
Perfect for spotting economic cycles and supporting trading decisions.
Add to your chart and get a clear macro picture instantly!
