SNP420_Five_to_Five_INDIFor consistent 9-5 traders.
Use for your traidingroutine.
Change colours and time for your strategy.
Peace and love! SNP420
Educational

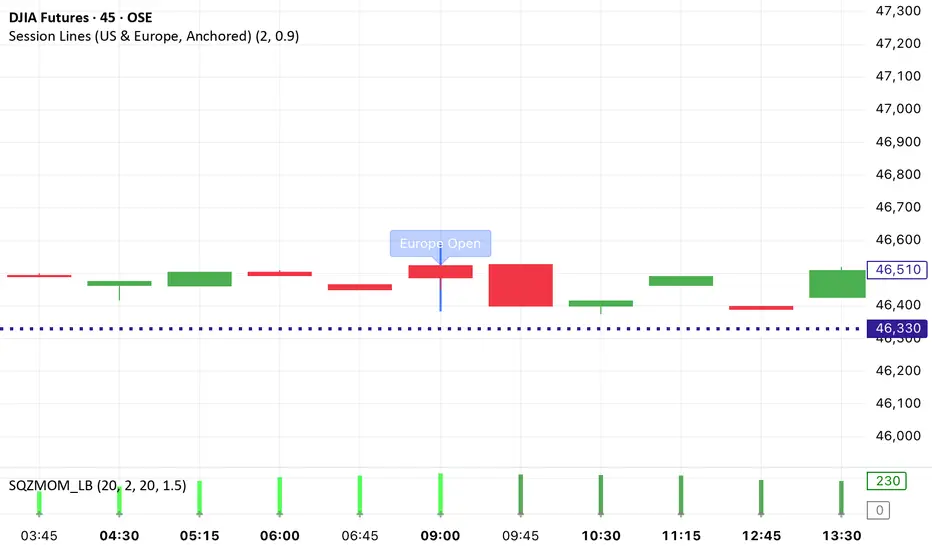
Session Lines (US & Europe, Anchored and Adaptive)A sleek indicator that marks the London (blue) and New York (red) trading sessions with perfectly aligned vertical lines both open and close times.
Lines automatically scale with your chart, adapt to any timeframe, and fade smoothly on higher intervals to keep your layout clean and professional.
Static K-means Clustering | InvestorUnknownStatic K-Means Clustering is a machine-learning-driven market regime classifier designed for traders who want a data-driven structure instead of subjective indicators or manually drawn zones.
This script performs offline (static) K-means training on your chosen historical window. Using four engineered features:
RSI (Momentum)
CCI (Price deviation / Mean reversion)
CMF (Money flow / Strength)
MACD Histogram (Trend acceleration)
It groups past market conditions into K distinct clusters (regimes). After training, every new bar is assigned to the nearest cluster via Euclidean distance in 4-dimensional standardized feature space.
This allows you to create models like:
Regime-based long/short filters
Volatility phase detectors
Trend vs. chop separation
Mean-reversion vs. breakout classification
Volume-enhanced money-flow regime shifts
Full machine-learning trading systems based solely on regimes
Note:
This script is not a universal ML strategy out of the box.
The user must engineer the feature set to match their trading style and target market.
K-means is a tool, not a ready made system, this script provides the framework.
Core Idea
K-means clustering takes raw, unlabeled market observations and attempts to discover structure by grouping similar bars together.
// STEP 1 — DATA POINTS ON A COORDINATE PLANE
// We start with raw, unlabeled data scattered in 2D space (x/y).
// At this point, nothing is grouped—these are just observations.
// K-means will try to discover structure by grouping nearby points.
//
// y ↑
// |
// 12 | •
// | •
// 10 | •
// | •
// 8 | • •
// |
// 6 | •
// |
// 4 | •
// |
// 2 |______________________________________________→ x
// 2 4 6 8 10 12 14
//
//
//
// STEP 2 — RANDOMLY PLACE INITIAL CENTROIDS
// The algorithm begins by placing K centroids at random positions.
// These centroids act as the temporary “representatives” of clusters.
// Their starting positions heavily influence the first assignment step.
//
// y ↑
// |
// 12 | •
// | •
// 10 | • C2 ×
// | •
// 8 | • •
// |
// 6 | C1 × •
// |
// 4 | •
// |
// 2 |______________________________________________→ x
// 2 4 6 8 10 12 14
//
//
//
// STEP 3 — ASSIGN POINTS TO NEAREST CENTROID
// Each point is compared to all centroids.
// Using simple Euclidean distance, each point joins the cluster
// of the centroid it is closest to.
// This creates a temporary grouping of the data.
//
// (Coloring concept shown using labels)
//
// - Points closer to C1 → Cluster 1
// - Points closer to C2 → Cluster 2
//
// y ↑
// |
// 12 | 2
// | 1
// 10 | 1 C2 ×
// | 2
// 8 | 1 2
// |
// 6 | C1 × 2
// |
// 4 | 1
// |
// 2 |______________________________________________→ x
// 2 4 6 8 10 12 14
//
// (1 = assigned to Cluster 1, 2 = assigned to Cluster 2)
// At this stage, clusters are formed purely by distance.
Your chosen historical window becomes the static training dataset , and after fitting, the centroids never change again.
This makes the model:
Predictable
Repeatable
Consistent across backtests
Fast for live use (no recalculation of centroids every bar)
Static Training Window
You select a period with:
Training Start
Training End
Only bars inside this range are used to fit the K-means model. This window defines:
the market regime examples
the statistical distributions (means/std) for each feature
how the centroids will be positioned post-trainin
Bars before training = fully transparent
Training bars = gray
Post-training bars = full colored regimes
Feature Engineering (4D Input Vector)
Every bar during training becomes a 4-dimensional point:
This combination balances: momentum, volatility, mean-reversion, trend acceleration giving the algorithm a richer "market fingerprint" per bar.
Standardization
To prevent any feature from dominating due to scale differences (e.g., CMF near zero vs CCI ±200), all features are standardized:
standardize(value, mean, std) =>
(value - mean) / std
Centroid Initialization
Centroids start at diverse coordinates using various curves:
linear
sinusoidal
sign-preserving quadratic
tanh compression
init_centroids() =>
// Spread centroids across using different shapes per feature
for c = 0 to k_clusters - 1
frac = k_clusters == 1 ? 0.0 : c / (k_clusters - 1.0) // 0 → 1
v = frac * 2 - 1 // -1 → +1
array.set(cent_rsi, c, v) // linear
array.set(cent_cci, c, math.sin(v)) // sinusoidal
array.set(cent_cmf, c, v * v * (v < 0 ? -1 : 1)) // quadratic sign-preserving
array.set(cent_mac, c, tanh(v)) // compressed
This makes initial cluster spread “random” even though true randomness is hardly achieved in pinescript.
K-Means Iterative Refinement
The algorithm repeats these steps:
(A) Assignment Step, Each bar is assigned to the nearest centroid via Euclidean distance in 4D:
distance = sqrt(dx² + dy² + dz² + dw²)
(B) Update Step, Centroids update to the mean of points assigned to them. This repeats iterations times (configurable).
LIVE REGIME CLASSIFICATION
After training, each new bar is:
Standardized using the training mean/std
Compared to all centroids
Assigned to the nearest cluster
Bar color updates based on cluster
No re-training occurs. This ensures:
No lookahead bias
Clean historical testing
Stable regimes over time
CLUSTER BEHAVIOR & TRADING LOGIC
Clusters (0, 1, 2, 3…) hold no inherent meaning. The user defines what each cluster does.
Example of custom actions:
Cluster 0 → Cash
Cluster 1 → Long
Cluster 2 → Short
Cluster 3+ → Cash (noise regime)
This flexibility means:
One trader might have cluster 0 as consolidation.
Another might repurpose it as a breakout-loading zone.
A third might ignore 3 clusters entirely.
Example on ETHUSD
Important Note:
Any change of parameters or chart timeframe or ticker can cause the “order” of clusters to change
The script does NOT assume any cluster equals any actionable bias, user decides.
PERFORMANCE METRICS & ROC TABLE
The indicator computes average 1-bar ROC for each cluster in:
Training set
Test (live) set
This helps measure:
Cluster profitability consistency
Regime forward predictability
Whether a regime is noise, trend, or reversion-biased
EQUITY SIMULATION & FEES
Designed for close-to-close realistic backtesting.
Position = cluster of previous bar
Fees applied only on regime switches. Meaning:
Staying long → no fee
Switching long→short → fee applied
Switching any→cash → fee applied
Fee input is percentage, but script already converts internally.
Disclaimers
⚠️ This indicator uses machine-learning but does not predict the future. It classifies similarity to past regimes, nothing more.
⚠️ Backtest results are not indicative of future performance.
⚠️ Clusters have no inherent “bullish” or “bearish” meaning. You must interpret them based on your testing and your own feature engineering.

[CASH] Crypto And Stocks Helper (MultiPack w. Alerts)ATTENTION! I'm not a good scripter. I have just learned a little basics for this project, stolen code from other public scripts and modified it, and gotten help from AI LLM's.
If you want recognition from stolen code please tell me to give you the credit you deserve.
The script is not completely finished yet and contains alot of errors but my friends and family wants access so I made it public.
_________________________________________________________________________________
CASH has multiple indicators (a true all-in-one multipack), guides and alerts to help you make better trades/investments. It has:
- Bitcoin Bull Market Support Band
- Dollar Volume
- 5 SMA and 5 EMA
- HODL Trend (a.k.a SuperTrend) indicator
- RSI, Volume and Divergence indicators w. alerts
More to come as well, like Backburner and a POC line from Volume Profile.
Everything is fully customizable, appearance and off/on etc.
More information and explainations along with my guides you can find in settings under "Input" and "Style".

🔥 SMC Reversal Engine v3.5 – Clean FVG + DashboardSMC Reversal Engine v3.5 – Clean FVG + Dashboard
The SMC Reversal Engine is a precision-built Smart Money Concepts tool designed to help traders understand market structure the single most important foundation in reading price action. It reveals how institutions move liquidity, where structure shifts occur, and how Fair Value Gaps (FVGs) align with these changes to signal potential reversals or continuations.
Understanding How It Works
At its core, the script detects CHoCH (Change of Character) and BOS (Break of Structure)—the two key turning points in institutional order flow. A CHoCH shows that the market has reversed intent (for example, from bearish to bullish), while a BOS confirms a continuation of the current trend. Together, they form the backbone of structure-based trading.
To refine this logic, the engine uses fractal pivots clusters of candles that confirm swing highs and lows. Fractals filter out noise, identifying points where price truly changes direction. The script lets you set this sensitivity manually or automatically adapts it depending on the timeframe. Lower fractal sensitivity captures smaller intraday swings for scalpers, while higher sensitivity locks onto major swing structures for swing and position traders.
The dashboard gives you a real-time reading of the trend, the last high and low, and what the market is likely to do next—for example, “Expect HL” or “Wait for LH.” It even tracks the accuracy of these structure predictions over time, giving an educational feedback loop to help you learn price behavior.
Fair Value Gaps and Tap Entries
Fair Value Gaps (FVGs) mark moments when price moves too quickly, leaving inefficiencies that institutions often revisit. When price taps into an FVG, it often acts as a high-probability entry zone for reversals or continuations. The script automatically detects, extends, and deletes old FVGs, keeping only relevant zones visible for a clean chart.
Traders can enable markTapEntry to visually confirm when an FVG gets filled. This is a simple but powerful trigger that often aligns with CHoCH or BOS moments.
Recommended Settings for Different Traders
For Scalpers, use a lower HTF structure such as 1 minute or 5 minutes. Keep Auto Fractals on for faster reaction, and limit FVG zones to 2–3. This gives you a clean, real-time reflection of order flow.
For Intraday Traders, 15-minute to 1-hour structure gives the perfect balance between reactivity and stability. Fractal sensitivity around 3–5 captures the most actionable levels without excessive noise.
For Swing Traders, use 4-hour, 1-day, or even 3-day structure. The chart becomes smoother, showing higher-order CHoCH and BOS that define true institutional transitions. Combine this with EMA confirmation for higher conviction.
For Position or Macro Traders, select Weekly or Monthly structure. The dynamic label system expands automatically to keep more historical BOS/CHoCH points visible, allowing you to see long-term shifts clearly.
Educational Value
This indicator is built to teach traders how to see structure the way professionals and smart money do. You’ll learn to recognize how markets transition from one phase to another from accumulation to manipulation to expansion. Each CHoCH or BOS helps you decode where liquidity is being taken and where new intent begins.
The included SMC Quick Guide explains each structural cue right on your chart. Within days of using it, you’ll start noticing patterns that reveal how price really moves, instead of guessing based on indicators.
Settings and How to Use Them
Everything in the SMC Reversal Engine is designed to adapt to your trading style and help you read structure like a professional.
When you open the Inputs Panel, you’ll see sections like Fractal Settings, FVG Settings, Buy/Sell Confirmation, and Educational Tools.
Under Fractal Settings, you can choose the higher timeframe (HTF) that defines structure—from minutes to weeks. The Auto Fractal Sensitivity option automatically adjusts how tight or wide swing points are detected. Lower sensitivity captures short-term fluctuations (great for scalpers), while higher values filter noise and isolate major swing highs and lows (perfect for swing traders).
The Fair Value Gap (FVG) options manage imbalance zones—the footprints of institutional orders. You can show or hide these zones, extend them into the future, and control how long they remain before auto-deletion. The Mark Entry When FVG is Tapped option places a small label when price revisits the gap—a potential entry signal that aligns with smart money logic.
EMA Confirmation adds a layer of confluence. The script can automatically scale EMA lengths based on timeframe, or you can input your preferred values (for example, 9/21 for intraday, 50/200 for swing). Require EMA Crossover Confirmation helps filter false moves, keeping you trading only with aligned momentum.
The Educational section gives traders visual reinforcement. When enabled, you’ll see tags like HH (Higher High), HL (Higher Low), LH (Lower High), and LL (Lower Low). These show structure shifts in real time, helping you learn visually what market structure really means. The Cheat Sheet panel summarizes each term, always visible in the corner for quick reference.
Early Top Warnings use wick size and RSI divergence to signal when price may be overextended—a useful heads-up before potential CHoCH formations.
Finally, the Narrative and Accuracy System translates structure into simple English—messages like Trend Bullish → Wait for HL or BOS Bearish → Expect LL. Over time, you can monitor how accurate these expectations have been, training your pattern recognition and confidence.
Pro Tips for Getting the Most Out of the SMC Reversal Engine
1. Start on Higher Timeframes First: Begin on the 4H or Daily chart where structure is cleaner and signals have more weight. Then scale down for entries once you grasp directional intent.
2. Use FVGs for Context, Not Just Entries: Observe how price behaves around unfilled FVGs—they often act as magnets or barriers, offering insight into where liquidity lies.
3. Combine With HTF Bias: Always trade in the direction of your higher timeframe trend. A bullish weekly BOS means lower timeframes should ideally align bullishly for optimal setups.
4. Clean Charts = Clear Mind: Use Minimal Mode when focusing on price action, then toggle the educational tools back on to review structure for learning.
5. Don’t Chase Every CHoCH or BOS: Focus on significant breaks that align with broader context and liquidity sweeps, not minor fluctuations.
6. Accuracy Rate Is a Feedback Tool: Use the accuracy stat as a reflection of consistency—not a trade trigger.
7. Build Narrative Awareness: Read the on-chart narrative messages to reinforce structured thinking and stay disciplined.
8. Practice Replay Mode: Step through past structures to visually connect CHoCH, BOS, and FVG behavior. It’s one of the best ways to train pattern recognition.
Summary
* Detects CHoCH and BOS automatically with fractal precision
* Identifies and manages Fair Value Gaps (FVGs) in real time
* Displays a smart dashboard with accuracy tracking
* Adapts label visibility dynamically by timeframe
* Perfect for both learning and trading with institutional clarity
This tool isn’t about predicting the market—it’s about understanding it. Once you can read structure, everything else in trading becomes secondary.


Trader Dogout
“Trader Dogout — Official team template.
Combines EMA20, EMA200, and optimized volume for a clear read of trend, momentum, and decision zones.
Designed for traders who operate with precision, simplicity, and zero distractions.
Perfect for both day trading and swing trading.”

ICT Macro Slot Algo Event📊 Overview
A powerful multi-timeframe trading indicator that combines Institutional Macro Session Tracking identify optimal trading windows throughout the day. This tool helps traders align with institutional flow patterns and algorithmic activity across major sessions.
🎯 Key Features
1. Macro Algo Event Sessions
Tracks 6 key institutional time windows during NY Session:
NY Sweep (08:50-09:10) - Opening balance flows
Silver Bullet #1 (09:50-10:10) - First major macro move
Silver Bullet #2 (10:50-11:10) - Second chance/retest opportunity
Lunch Macro (11:50-12:10) - Mid-day repositioning
Post-Lunch Rebalance (13:10-13:40) - Post-lunch adjustments
NY Closing Macros (15:15-15:45) - End-of-day flows

ICT Macro Slot Algo Event📊 Overview
A powerful multi-timeframe trading indicator that combines Institutional Macro Session Tracking to identify optimal trading windows throughout the day. This tool helps traders align with institutional flow patterns and algorithmic activity across major sessions.
🎯 Key Features
1. Macro Algo Event Sessions
Tracks 6 key institutional time windows during NY Session:
NY Sweep (08:50-09:10) - Opening balance flows
Silver Bullet #1 (09:50-10:10) - First major macro move
Silver Bullet #2 (10:50-11:10) - Second chance/retest opportunity
Lunch Macro (11:50-12:10) - Mid-day repositioning
Post-Lunch Rebalance (13:10-13:40) - Post-lunch adjustments
NY Closing Macros (15:15-15:45) - End-of-day flows

Exchanges OpeningProvides an indicator 5 minutes before New York, London, Frankfurt, Tokyo, Hong Kong or Sydney Stock exchanges open with optional alerts if you create one for the script.

Rotation SentinelROTATION SENTINEL v1.1 — OVERVIEW
Rotation Sentinel is a macro rotation engine that tracks 10 institutional-grade dominance, liquidity, and trend signals to identify when capital is flowing into altcoins.
Each row outputs Green / Yellow / Red, and the system produces a 0–10 Rotation Score plus a final regime:
🔴 NO ROTATION (0–4)
🟡 ROTATION STARTING (5–6)
🟢 ALTSEASON (7–10)
Use on Daily timeframe for best accuracy.
KEY SIGNALS
1️⃣ BTC.D ex-stables
Shows true BTC vs alt strength.
🟢 Falling = capital rotating into alts.
🔴 Rising = alts bleeding. (Master switch.)
2️⃣ OTHERS.D
Broad altcoin dominance.
🟢 Rising = early alt strength.
🔴 Falling = weak participation.
3️⃣ ETH/BTC
Rotation ignition.
🟢 ETH outperforming = rotation can start.
🔴 ETH lagging = altseason impossible.
4️⃣ STABLE.C.D
Crypto “fear index.”
🟢 Falling = risk-on environment.
🔴 Rising = capital hiding in stables.
5️⃣ USDT.D
Real-time risk positioning.
🟢 Falling = capital deploying.
🔴 Rising = defensive.
6️⃣ TOTAL3 (HTF Trend)
Structural alt market health.
🟢 Above SMA + rising = bullish structure.
🔴 Below SMA + falling = systematic weakness.
7️⃣ TOTAL3 / TOTAL2
Depth of rotation.
🟢 Mid/small caps outperforming = deep rotation.
🔴 Only large caps moving = shallow cycle.
8️⃣ Risk Ratio (OTHERS.D / STABLE.C.D)
Pure risk appetite.
🟢 Alts gaining on stables = risk-on.
9️⃣ OTHERS/BTC
Alt value vs BTC.
🟢 Rising = alts outperforming BTC.
🔟 Liquidation Heatmap (Manual)
Update from Hyblock/Coinalyze.
🟢 Liquidity above = upside easier.
ALTSEASON TRIGGER
Fires only when all 6 core conditions turn GREEN:
BTC.D ex-stables
OTHERS.D
ETH/BTC
STABLE.C.D
TOTAL3 structure
Rotation Score ≥ threshold (default 7)
BEST PRACTICES
Use Daily timeframe (macro rotation, not intraday noise)
Score < 5 → defensive / selective trades
Score 5–6 → early rotation window
Score ≥ 7 → confirmed altseason regime
Let alerts notify you; no need to manually monitor
INCLUDED ALERTS
🚨 ALTSEASON TRIGGERED
⚠️ Rotation Score Crossed Threshold
📈 ETH/BTC Rotation Clock Activated
🔥 OTHERS.D Breaking Higher

Steff- OBX- DTA OBX – US Open 15-Minute Zone Indicator
This indicator highlights the first 15 minutes of the U.S. stock market opening, also known as the OBX (Opening Balance Extension).
It is designed specifically for Nasdaq and S&P 500, which open at 09:30 New York time — corresponding to 15:30 Danish time.
What this indicator does:
• Marks the price range from 09:30–09:45 (U.S. time) as a zone on your chart
• Automatically adjusts to your local timezone, so the zone always aligns with Danish time
• Extends the zone to the right so you can track how price interacts with OBX throughout the day
• Draws all historical OBX zones so you can analyze previous reactions
• Rebuilds zones automatically when switching timeframes
• Detects breakouts from the zone
• Tracks balancing time only after a real breakout occurs
• Can automatically remove a zone if price spends a continuous amount of time inside it after the breakout (you set the minutes yourself)
• Allows full customization of OBX start time, duration, and behavior
• Individual zones can be manually deleted without being redrawn by the indicator
Why the OBX matters:
The OBX represents one of the most influential time windows in intraday trading because it reflects:
• The first injection of liquidity after the U.S. market opens
• Institutional positioning and algorithmic adjustments
• Early volatility and directional bias
• Common zones for reversals, breakouts, or mean reversion
• Key high-probability reaction levels used by professional traders
This indicator gives you a clear visual representation of when the market reacts to the U.S. open and how price interacts with the opening range throughout the session.


Previous Day Candle [ApexFX]Previous Day Candle is a precision tool designed for intraday traders who rely on previous daily structures to find support and resistance.
While most indicators simply mark the previous high and low, this tool focuses on Session Continuity. It highlights the full 24-hour range of the previous day and extends those levels into the "Killzone" of the current trading day (up to 2:00 PM EST / 12:00 PM MST).
Why use this? Market reaction often occurs at the previous day's extremes. By extending these lines into the current session, you can easily spot:
Breakouts: Price pushing through yesterday's high.
Failed Auctions: Price sweeping yesterday's low and reversing.
Support/Resistance Flips: Old highs becoming new support.
Main Features:
Asset Class Presets: Don't worry about timezones. Simply select your market:
Forex: Aligns to the standard 5:00 PM EST New York Open.
Indices: Aligns to the 6:00 PM EST Globex Open.
Crypto: Aligns to UTC Midnight.
Custom: Full manual control for specific needs.
Visual "Boxing": Vertical dotted lines clearly demarcate the start and end of the previous trading day.
Dynamic History: Choose to show just yesterday's levels or look back at the last 5+ days.
Smart Color Coding: The indicator automatically cycles colors for each day (Blue = Yesterday, Green = 2 Days Ago, etc.), making it instant to read historical price action.
Best Used On: Intraday timeframes (5m, 15m, 1h).

Forward Returns – (Next Month Start)This indicator calculates 1-month, 3-month, 6-month, and 12-month forward returns starting from the first trading day of the month following a defined price event.
A price event occurs when the selected asset drops below a user-defined threshold over a chosen timeframe (Day, Week, or Month).
For monthly conditions, the script evaluates the entire performance of the previous calendar month and triggers the event only at the first trading session of the next month, ensuring accurate forward-return alignment with historical monthly cycles.
The forward returns for each detected event are displayed in a paginated performance table, allowing users to navigate through large datasets using a page selector. Each page includes:
Entry Date
Forward returns (1M, 3M, 6M, 12M)
Average forward return
Win rate (percentage of positive outcomes)
This tool is useful for studying historical performance after major drawdowns, identifying seasonal patterns, and building evidence-based risk-management or timing models.


Liquidity ThermometerThis is a universal indicator that assesses market liquidity based on five key market parameters: volume, volatility, candlestick range, body size, and price momentum.
The indicator does not use open interest data and is suitable for all markets, including spot, futures, and Forex.
This indicator normalizes each metric historically and creates a composite index between 0 and 1, where higher values correspond to a stable and calm market environment, and lower values indicate periods of increased risk and potential liquidity stress.
LT generates an integral liquidity index in the range based on five normalized components:
-nVol — normalized volume, reflecting trading density and activity.
-nATR — the volatility component (ATR), inverted, as high volatility is typically associated with declining liquidity.
-nRange — the normalized candlestick range, also inverted to assess the structural narrowness of the price movement.
-nBody — the normalized candlestick body size (|close − open|), inverted to assess the balance of supply and demand.
-nMove — the normalized value of the price impulse movement (|Δclose|), reflecting short-term price spikes.
Each metric is linearly normalized over a sliding window (200 bars) using the formula:
norm(x) = (x − min) / (max − min),
where at max = min, the value is fixed at 0.5 to ensure stability.
The ALT index is calculated as a weighted combination:
ALT = 0.35 nVol + 0.20 (1 − nATR) + 0.20 (1 − nRange) + 0.15 (1 − nBody) + 0.10 (1 − nMove)
The result is further smoothed using EMA(3) to reduce micronoise.
Red Zone (MLI < 0.25) — Risk, Thin Liquidity
When the indicator falls into the red zone, it means the market is extremely volatile:
Characteristics:
Low volume — small trades have a strong impact on the price.
High volatility — candlesticks rise or fall sharply.
Wide candlestick range — the market is "breathing heavily," easily breaking price extremes.
Impulsive movements — small market shocks lead to sharp spikes.
Thin liquidity — few orders in the order book, large orders "eat up" the market.
What this means for a trader:
🔥 High risk of spikes and false breakouts.
⚠ Possible series of liquidations on leverage.
❌ It is not recommended to enter long or short positions without a filter or protection.
✅ Can be used for short scalping strategies if you know the entry point, but very carefully.
Green Zone (MLI > 0.75) — High Liquidity, Safe Zone
When the indicator rises into the green zone, it means the market is stable and balanced:
Characteristics:
High volume — the market is deep, orders are executed without a strong impact on the price.
Low volatility — candlesticks are stable, no sharp spikes.
Narrow candlestick range — price moves calmly.
Weak impulse movements — no sharp surges.
Sufficient liquidity — the market can handle large orders.
What this means for a trader:
✅ Safe zone for opening positions.
🔄 Easier to set stop-loss and take-profit orders.
💡 You can trade both up and down, the risk of sharp movements is minimal.
⚡ Under these conditions, there is a lower risk of spikes and accidental liquidations.
It does not predict price movements or guarantee results. It is an analytical tool intended for additional research into market structure.

PP/EMA Crossover Buffer CounterPP/EMA Crossover Buffer Counter Tells pivot price crossing 9 EMA for a Trending Market

Trend Line Methods (TLM)Trend Line Methods (TLM)
Overview
Trend Line Methods (TLM) is a visual study designed to help traders explore trend structure using two complementary, auto-drawn trend channels. The script focuses on how price interacts with rising or falling boundaries over time. It does not generate trade signals or manage risk; its purpose is to support discretionary chart analysis.
Method 1 – Pivot Span Trendline
The Pivot Span Trendline method builds a dynamic channel from major swing points detected by pivot highs and pivot lows.
• The script tracks a configurable number of recent pivot highs and lows.
• From the oldest and most recent stored pivot highs, it draws an upper trend line.
• From the oldest and most recent stored pivot lows, it draws a lower trend line.
• An optional filled area can be drawn between the two lines to highlight the active trend span.
As new pivots form, the lines are recalculated so that the channel evolves with market structure. This method is useful for visualising how price respects a trend corridor defined directly by swing points.
Method 2 – 5-Point Straight Channel
The 5-Point Straight Channel method approximates a straight trend channel using five key points extracted from a fixed lookback window.
Within the selected window:
• The window is divided into five segments of similar length.
• In each segment, the highest high is used as a representative high point.
• In each segment, the lowest low is used as a representative low point.
• A straight regression-style line is fitted through the five high points to form the upper boundary.
• A second straight line is fitted through the five low points to form the lower boundary.
The result is a pair of straight lines that describe the overall directional channel of price over the chosen window. Compared to Method 1, this approach is less focused on the very latest swings and more on the broader slope of the market.
Inputs & Menus
Pivot Span Trendline group (Method 1)
• Enable Pivot Span Trendline – Turns Method 1 on or off.
• High trend line color / Low trend line color – Colors of the upper and lower trend lines.
• Fill color between trend lines – Base color used to shade the area between the two lines. Transparency is controlled internally.
• Trend line thickness – Line width for both high and low trend lines.
• Trend line style – Line style (solid, dashed, or dotted).
• Pivot Left / Pivot Right – Number of bars to the left and right used to confirm pivot highs and lows. Larger values produce fewer but more significant swing points.
• Pivot Count – How many historical pivot points are kept for constructing the trend lines.
• Lookback Length – Number of bars used to keep pivots in range and to extend the trend lines across the chart.
5-Point Straight Channel group (Method 2)
• Enable 5-Point Straight Channel – Turns Method 2 on or off.
• High channel line color / Low channel line color – Colors of the upper and lower channel lines.
• Channel line thickness – Line width for both channel lines.
• Channel line style – Line style (solid, dashed, or dotted).
• Channel Length (bars) – Lookback window used to divide price into five segments and build the straight high/low channel.
Using Both Methods Together
Both methods are designed to visualise the same underlying idea: price tends to move inside rising or falling channels. Method 1 emphasises the most recent swing structure via pivot points, while Method 2 summarises the broader channel over a fixed window.
When the Pivot Span Trendline corridor and the 5-Point Straight Channel boundaries align or intersect, they can highlight zones where multiple ways of drawing trend lines point to similar support or resistance areas. Traders can use these confluence zones as a visual reference when planning their own entries, exits, or risk levels, according to their personal trading plan.
Notes
• This script is meant as an educational and analytical tool for studying trend lines and channels.
• It does not generate trading signals and does not replace independent analysis or risk management.
• The behaviour of both methods is timeframe- and symbol-agnostic; they will adapt to whichever chart you apply them to.

GME Cash FloorsPlots three fundamental “floor value” lines for GameStop based on its balance sheet:
Cash/Share (Gross + BTC) – total cash & equivalents per share, optionally including the BTC treasury at current BTCUSD price.
Net Cash/Share – cash (plus optional BTC) minus total debt, per share.
2030 Carry Floor – projected net cash per share in 2030 assuming the cash portion compounds at a user-set rate while the 0% notes are repaid at maturity.
Inputs let you update cash, debt, share count, interest rate, years to 2030, and toggle BTC on/off so the lines stay in sync with the latest 10-Q.

Global M2 Money Supply Growth (GDP-Weighted)📊 Global M2 Money Supply Growth (GDP-Weighted)
This indicator tracks the weighted aggregate M2 money supply growth across the world's four largest economies: United States, China, Eurozone, and Japan. These economies represent approximately 69.3 trillion USD in combined GDP and account for the majority of global liquidity, making this a comprehensive macro indicator for analyzing worldwide monetary conditions.
════════════════════════════════════════════
🔧 KEY FEATURES:
📈 GDP-Weighted Aggregation
Each economy is weighted proportionally by its nominal GDP using 2025 IMF World Economic Outlook data:
• United States: 44.2% (30.62 trillion USD)
• China: 28.0% (19.40 trillion USD)
• Eurozone: 21.6% (15.0 trillion USD)
• Japan: 6.2% (4.28 trillion USD)
The weights are fully adjustable through the indicator settings, allowing you to update them annually as new IMF forecasts are released (typically April and October).
⏱️ Multiple Time Period Options
Choose between three calculation methods to analyze different timeframes:
• YoY (Year-over-Year): 12-month growth rate for identifying long-term liquidity trends and cycles
• MoM (Month-over-Month): 1-month growth rate for detecting short-term monetary policy shifts
• QoQ (Quarter-over-Quarter): 3-month growth rate for medium-term trend analysis
🔄 Advanced Offset Function
Shift the entire indicator forward by 0-365 days to test lead/lag relationships between global liquidity and asset prices. Research suggests a 56-70 day lag between M2 changes and Bitcoin price movements, but you can experiment with different offsets for various assets (equities, gold, commodities, etc.).
🌍 Individual Country Breakdown
Real-time display of each economy's M2 growth rate with:
• Current percentage change (YoY/MoM/QoQ)
• GDP weight contribution
• Color-coded values (green = monetary expansion, red = contraction)
📊 Smart Overlay Capability
Displays directly on your main price chart with an independent left-side scale, allowing you to visually correlate global liquidity trends with any asset's price action without cluttering the chart.
🔧 Customizable GDP Weights
All GDP values can be adjusted through the indicator settings without editing code, making annual updates simple and accessible for all users.
════════════════════════════════════════════
📡 DATA SOURCES:
All M2 money supply data is sourced from ECONOMICS (Trading Economics) for consistency and reliability:
• ECONOMICS:USM2 (United States)
• ECONOMICS:CNM2 (China)
• ECONOMICS:EUM2 (Eurozone)
• ECONOMICS:JPM2 (Japan)
All values are normalized to USD using current daily exchange rates (USDCNY, EURUSD, USDJPY) before GDP-weighted aggregation, ensuring accurate cross-country comparisons.
══════════════════════════════════════════════
💡 USE CASES & APPLICATIONS:
🔹 Liquidity Cycle Analysis
Track global monetary expansion/contraction cycles to identify when central banks are coordinating loose or tight monetary policies.
🔹 Market Timing & Risk Assessment
High M2 growth (>10%) historically correlates with risk-on environments and rising asset prices across crypto, equities, and commodities. Negative M2 growth signals monetary tightening and potential market corrections.
🔹 Bitcoin & Crypto Correlation
Compare with Bitcoin price using the offset feature to identify the optimal lag period. Many traders use 60-70 day offsets to predict crypto market movements based on liquidity changes.
🔹 Macro Portfolio Allocation
Use as a regime filter to adjust portfolio exposure: increase risk assets during liquidity expansion, reduce during contraction.
🔹 Central Bank Policy Divergence
Monitor individual country metrics to identify when major central banks are pursuing divergent policies (e.g., Fed tightening while China eases).
🔹 Inflation & Economic Forecasting
Rapid M2 growth often leads inflation by 12-18 months, making this a leading indicator for future inflation trends.
🔹 Recession Early Warning
Negative M2 growth is extremely rare and has preceded major recessions, making this a valuable risk management tool.
════════════════════════════════════════════
📊 INTERPRETATION GUIDE:
🟢 +10% or Higher
Aggressive monetary expansion, typically during crises (2001, 2008, 2020). The COVID-19 period saw M2 growth reach 20-27%, which preceded significant inflation and asset price surges. Strong bullish signal for risk assets.
🟢 +6% to +10%
Above-average liquidity growth. Central banks are providing stimulus beyond normal levels. Generally favorable for equities, crypto, and commodities.
🟡 +3% to +6%
Normal/healthy growth rate, roughly in line with GDP growth plus 2% inflation targets. Neutral environment with moderate support for risk assets.
🟠 0% to +3%
Slowing liquidity, potential tightening phase beginning. Central banks may be raising rates or reducing balance sheets. Caution warranted for high-beta assets.
🔴 Negative Growth
Monetary contraction - extremely rare. Only occurred during aggressive Fed tightening in 2022-2023. Strong warning signal for risk assets, often precedes recessions or major market corrections.
════════════════════════════════════════════
🎯 OPTIMAL USAGE:
📅 Recommended Timeframes:
• Daily or Weekly charts for macro analysis
• Monthly charts for very long-term trends
💹 Compatible Asset Classes:
• Cryptocurrencies (especially Bitcoin, Ethereum)
• Equity indices (S&P 500, NASDAQ, global markets)
• Commodities (Gold, Silver, Oil)
• Forex majors (DXY correlation analysis)
⚙️ Suggested Settings:
• Default: YoY calculation with 0 offset for current liquidity conditions
• Bitcoin traders: YoY with 60-70 day offset for predictive analysis
• Short-term traders: MoM with 0 offset for recent policy changes
• Quarterly rebalancers: QoQ with 0 offset for medium-term trends
════════════════════════════════════════════
📋 VISUAL DISPLAY:
The indicator plots a blue line showing the selected growth metric (YoY/MoM/QoQ), with a dashed reference line at 0% to clearly identify expansion vs. contraction regimes.
A comprehensive table in the top-right corner displays:
• Current global M2 growth rate (large, prominent display)
• Individual country breakdowns with their GDP weights
• Color-coded growth rates (green for positive, red for negative)
════════════════════════════════════════════
🔄 MAINTENANCE & UPDATES:
GDP weights should be updated annually (ideally in April or October) when the IMF releases new World Economic Outlook forecasts. Simply adjust the four GDP input parameters in the indicator settings - no code editing required.
The relative GDP proportions between the Big 4 economies change very gradually (typically <1-2% per year), so even if you update weights once every 1-2 years, the impact on the indicator's accuracy is minimal.
════════════════════════════════════════════
💭 TRADING PHILOSOPHY:
This indicator embodies the principle that "liquidity drives markets." By tracking the combined M2 money supply of the world's largest economies, weighted by their economic size, you gain insight into the fundamental liquidity conditions that underpin all asset prices.
Unlike single-country M2 indicators, this GDP-weighted approach captures the true global picture, accounting for the fact that US monetary policy has 2x the impact of Japanese policy due to economic size differences.
Perfect for macro-focused traders, long-term investors, and anyone seeking to understand the "tide that lifts all boats" in financial markets.
════════════════════════════════════════════
Created for traders and investors who incorporate global liquidity trends into their decision-making process. Best used alongside other technical and fundamental analysis tools for comprehensive market assessment.
⚠️ Disclaimer: M2 money supply is a lagging macroeconomic indicator. Past correlations do not guarantee future results. Always use proper risk management and combine with other analysis methods.

Fear & Greed Oscillator - Risk SentimentThe Fear & Greed Oscillator – Risk Sentiment is a macro-driven sentiment indicator inspired by the popular Fear & Greed Index , but rebuilt from the ground up using real, market-based economic data and statistical normalization.
While the traditional Fear & Greed Index uses components like volatility, volume, and social media trends to estimate sentiment, this version is powered by the Copper/Gold ratio — a historically respected gauge of macroeconomic confidence and risk appetite.
📈 Expansion vs. Contraction Theory
At the heart of this oscillator is a simple macroeconomic insight:
🟢 Copper performs well during periods of economic expansion and risk-on behavior (industrials, construction, manufacturing growth).
🔴 Gold performs well during periods of economic contraction , as a classic risk-off, capital-preserving asset.
By tracking the ratio of Copper to Gold prices over time and converting it into a Z-score , this tool shows when macro sentiment is statistically stretched toward greed or fear — based on how unusually strong one side of the ratio is relative to its historical average.
⚙️ How It Works
The script takes two user-defined tickers (default: Copper and Gold) and calculates their ratio.
It then applies Z-score normalization over a user-defined period (default: 200 bars).
A color gradient line is plotted:
🔴 Z < -2 = Extreme Fear
🟣 -2 to 0 = Mild Fear to Neutral
🔵 0 to 2 = Neutral to Greed
🟢 Z > 2 = Extreme Greed
Visual guides at ±1, ±2, ±3 standard deviations give immediate context.
Includes alert conditions when the Z-score crosses above +2 (Greed) or below -2 (Fear).
🔔 Alerts
“Z-Score has entered the Greed Zone ” when Z > 2
“Z-Score has entered the Fear Zone ” when Z < -2
These are designed to help catch macro sentiment extremes before or during large shifts in market behavior.
⚠️ Disclaimer
This indicator is a macro sentiment tool, not a direct trading signal. While the Copper/Gold ratio often reflects economic risk trends, correlation with risk assets (like Bitcoin or equities) is not guaranteed and may vary by cycle. Always use this indicator in conjunction with other tools and contextual analysis.

Argentina Price per m² (USD) — (1999–2025)Overview
This indicator plots the historical USD price per square meter of apartments in CABA (Buenos Aires City), Argentina, combining annual data (1999–2011) from Maure Real Estate Market Reports with monthly data (2012–2025) from UCEMA and private market sources.
All values were manually digitized, cleaned, and consolidated to reconstruct the most complete long-term pricing series publicly available.
The script also includes SMA20, SMA50, and SMA100 over the custom dataset to support long-term trend analysis, cycle detection, and macro technical structure.
Data Sources
1999–2011 (Annual): Maure Real Estate Market Reports
2012–2020 (Monthly): UCEMA Real Estate Index
2020–2025 (Monthly): RE/MAX – UCEMA Market Monitor
How to Use This Indicator
This tool allows investors, developers, and analysts to:
Identify multiyear trend shifts
Compare cycles vs. Argentine macro environments
Map long-term support/resistance zones in real estate
Detect early signs of market recovery or contraction
Combine real estate fundamentals with technical analysis
The SMAs help visualize structural trends normally hidden in real estate data.
About This Work
This series was fully reconstructed and coded by engineer Francisco Michelich (@esFranMiche on X), combining market research, statistical consolidation, and technical analysis.
It is intended as an analytical tool, not an official financial index.
If you find this useful, feel free to follow and connect — feedback and collaboration are welcome.
Linkedin
X
