Trend Compass (Manual)## Trend Compass (Manual) - A Discretionary Trader's Dashboard
### Summary
Trend Compass is a simple yet powerful dashboard designed for discretionary traders who want a constant, visual reminder of their market analysis directly on their chart. Instead of relying on automated indicators, this tool gives you **full manual control** to define the market state across different timeframes or conditions.
It helps you stay aligned with your higher-level analysis (e.g., HTF bias, current market structure) and avoid making impulsive decisions that go against your plan.
### Key Features
- **Fully Manual Control:** You decide the trend. No lagging indicators, no confusing signals. Just your own analysis, displayed clearly.
- **Multiple Market States:** Define each row as an `Uptrend`, `Downtrend`, `Pullback`, or `Neutral` market.
- **Customizable Rows:** Display up to 8 rows. You can label each one however you like (e.g., "D1", "H4", "Market Structure", "Liquidity Bias").
- **Flexible Panel:** Change all colors, text sizes, and place the panel in any of the 9 positions on your chart.
- **Clean & Minimalist:** Designed to provide essential information at a glance without cluttering your chart.
### How to Use
1. **Add to Chart:** Add the indicator to your chart.
2. **Open Settings:** Go into the indicator settings.
3. **Configure Rows:**
- In the "Rows (Manual Control)" section, set the "Number of rows" you want to display.
- For each row, give it a custom **Label** (e.g., "m15").
- Select its current state from the dropdown menu (`Uptrend`, `Downtrend`, etc.).
- To remove a row, simply set its state to `Hidden`.
4. **Customize Style:**
- In the "Panel & Visual Style" section, adjust colors, text sizes, and the panel's position to match your chart's theme.
This tool is perfect for price action traders, ICT/SMC traders, or anyone who values a clean chart and a disciplined approach to their analysis.
Educational

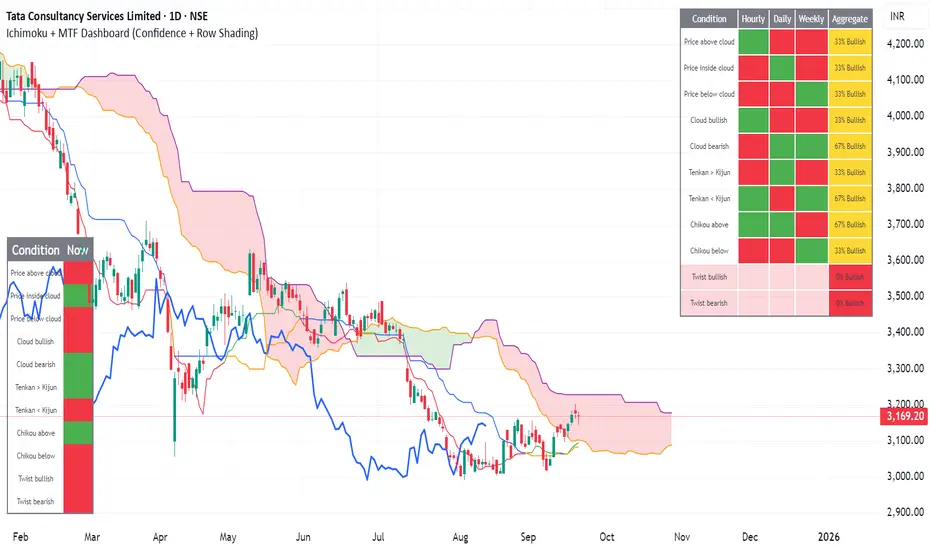
Ichimoku + MTF Dashboard (Confidence + Row Shading)Name: Ichimoku + Multi-Timeframe (MTF) Dashboard
Purpose
This indicator is designed to give a complete trend, momentum, and alignment picture of a stock across multiple timeframes (hourly, daily, weekly) using the Ichimoku Kinko Hyo system. It combines:
Classic Ichimoku signals: Tenkan/Kijun crossovers, cloud position (Kumo), Chikou span, and cloud twists.
MTF Dashboard: Aggregates hourly, daily, and weekly Ichimoku conditions into a clean visual table.
Dynamic coloring: Each signal is represented with green/red fills, and rows are shaded for full alignment. Aggregate column highlights mixed signals in yellow.
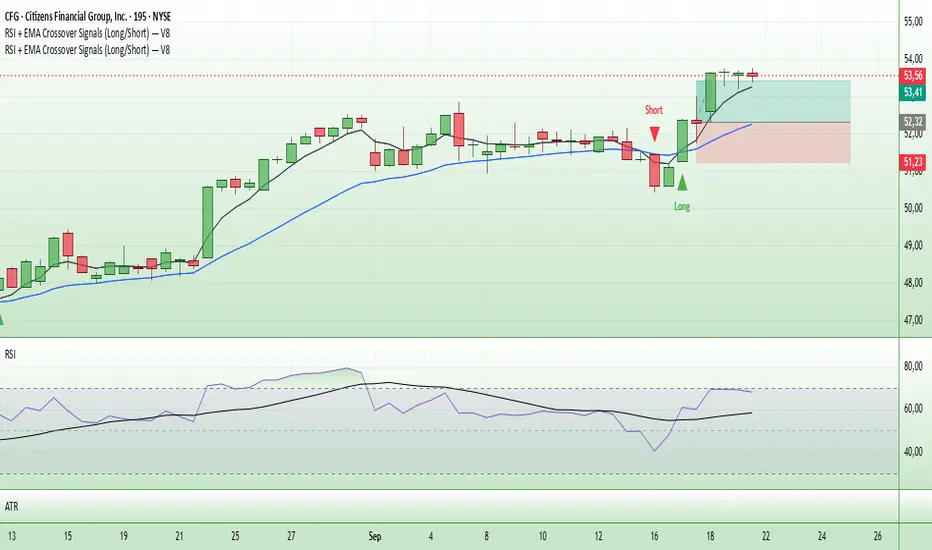
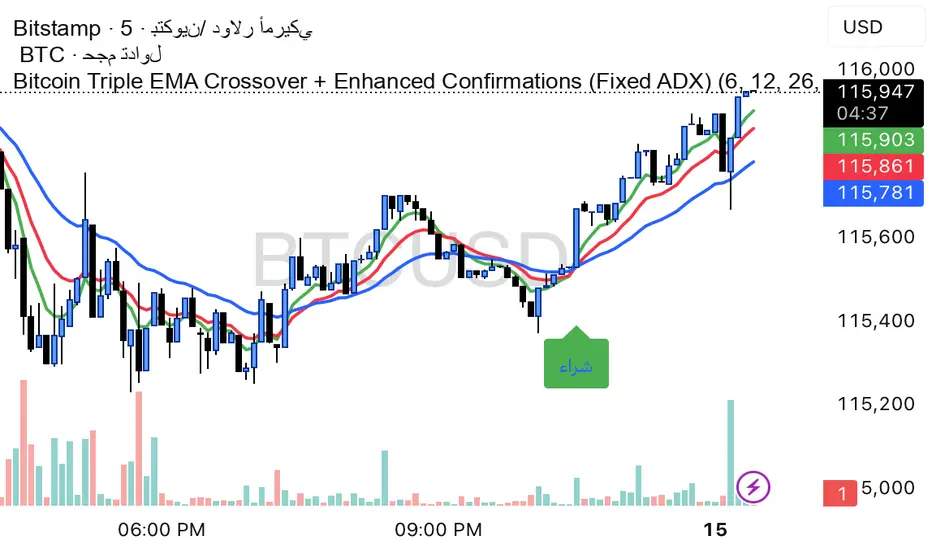
Entry Signals (Long/Short)The indicator visualizes precise entry signals for long and short setups directly on the price chart. Long is marked with a green triangle-up, short with a red triangle-down. To contextualize trend structure, the Fast EMA (5) is plotted in black and the Slow EMA (20) in blue (line width 1). Signals print only at bar close for reproducible execution. Applicable across all timeframes—ideal for top-down analysis from the 195-minute chart through daily to weekly.
Trend Magic EMA RMI Trend Sniper📌 Indicator Name:
Trend Magic + EMA + MA Smoothing + RMI Trend Sniper
📝 Description:
This is a multi-functional trend and momentum indicator that combines four powerful tools into a single overlay:
Trend Magic – Plots a dynamic support/resistance line based on CCI and ATR.
Helps identify trend direction (green = bullish, red = bearish).
Acts as a trailing stop or dynamic level for trade entries/exits.
Exponential Moving Average (EMA) – Smooths price data to highlight the underlying trend.
Customizable length, source, and offset.
Serves as a trend filter or moving support/resistance.
MA Smoothing + Bollinger Bands (Optional) – Adds a secondary smoothing filter based on your choice of SMA, EMA, WMA, VWMA, or SMMA.
Optional Bollinger Bands visualize volatility expansion/contraction.
Great for spotting consolidations and breakout opportunities.
RMI Trend Sniper – A momentum-based system combining RSI and MFI.
Highlights bullish (green) or bearish (red) conditions.
Plots a Range-Weighted Moving Average (RWMA) channel to gauge price positioning.
Provides visual BUY/SELL labels and optional bar coloring for fast decision-making.
📊 Uses & Trading Applications:
✅ Trend Identification: Spot the dominant market direction quickly with Trend Magic & EMA.
✅ Momentum Confirmation: RMI Sniper helps confirm whether the market has strong bullish or bearish pressure.
✅ Dynamic Support/Resistance: Trend Magic & EMA act as adaptive levels for stop-loss or trailing positions.
✅ Volatility Analysis: Optional Bollinger Bands show squeezes and potential breakout setups.
✅ Entry/Exit Signals: BUY/SELL alerts and color-coded candles make spotting trade opportunities simple.
💡 Best Use Cases:
Swing Trading: Follow Trend Magic + EMA alignment for higher probability trades.
Scalping/Intraday: Use RMI signals with bar coloring for quick momentum entries.
Trend Following Strategies: Ride trends until Trend Magic flips direction.
Breakout Trading: Watch for price closing outside the Bollinger Bands with RMI confirmation.

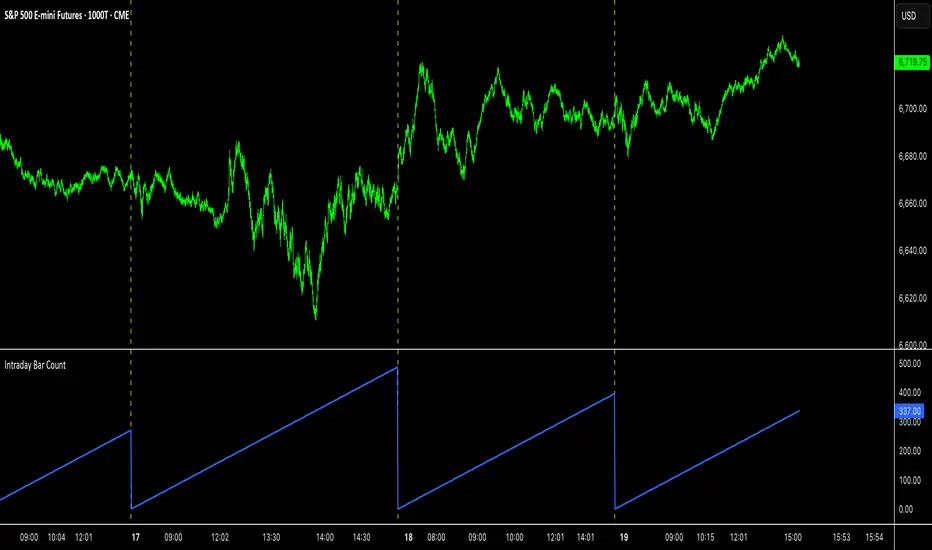
Intraday Bar CounterThis indicator plots a counter on the chart that tracks the number of bars since the beginning of the current day.
The counter resets to zero on the first bar of each new calendar day (midnight). This functionality is provided only on intraday and tick charts.
The indicator is designed to operate on a wide range of symbols without requiring manual adjustments for specific trading sessions.
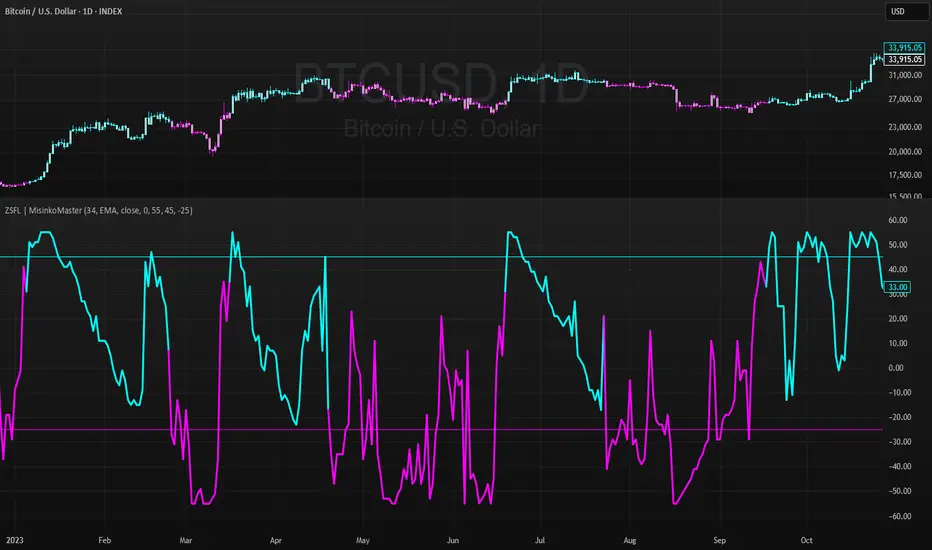
Z-Score For Loop | MisinkoMasterThe Z-Score For Loop (ZSFL) is a unique trend-following oscillator designed to detect potential reversals and momentum shifts earlier than traditional tools, providing traders with fast, adaptive, and reliable signals.
Unlike common smoothing techniques (moving averages, medians, or modes), the ZSFL introduces a for-loop comparison method that balances speed and noise reduction, resulting in a powerful reversal-detection system.
🔎 Methodology
The indicator is built in two main stages:
Z-Score Calculation
Formula:
Z=(Source−Mean)/Standard Deviation
Z=
Standard Deviation
(Source−Mean)
The user can select the averaging method for the mean: SMA, EMA, WMA, HMA, DEMA, or TEMA.
Recommended: EMA, SMA, or WMA for balanced accuracy.
The choice of biased (sample) or unbiased (population) standard deviation is also available.
➝ On its own, the raw Z-score is fast but noisy, requiring additional filtering.
For Loop Logic (Noise Reduction)
Instead of using traditional smoothing (which adds lag), the indicator applies a for loop comparison.
The current Z-score is compared against previous values over a user-defined range (start → end).
Each comparison adds or subtracts “points”:
+1 point if the current Z-score is higher than a past Z-score.
-1 point if it is lower.
The final value is the cumulative score, reflecting whether the Z-score is generally stronger or weaker than its historical context.
➝ This approach keeps speed intact while removing much of the false noise that raw Z-scores generate.
📈 Trend Logic
Bullish Signal (Cyan) → Triggered when the score crosses above the upper threshold (default +45).
Bearish Signal (Magenta) → Triggered when the score crosses below the lower threshold (default -25).
Neutral → When the score remains between the thresholds.
Thresholds are adjustable, making the tool flexible for different assets and timeframes.
🎨 Visualization
The ZSFL score is plotted as a main oscillator line.
Upper and lower thresholds are plotted as static reference levels.
The price chart can also be color-coded with trend signals (cyan for bullish, magenta for bearish) to provide immediate visual confirmation.
⚡ Features
Adjustable Z-score length (len).
Multiple average types for the mean (SMA, EMA, WMA, HMA, DEMA, TEMA).
Toggle between biased vs. unbiased SD calculations.
Adjustable For Loop range (start, end).
Adjustable upper and lower thresholds for signal generation.
Works as both an oscillator and a price overlay tool.
✅ Use Cases
Reversal Detection → Spot early shifts before price confirms them.
Trend Confirmation → Use thresholds to filter false reversals.
System Filter → Combine with trend indicators to refine entries.
Multi-Timeframe Setup → Works well across different timeframes for swing, day, or intraday trading.
⚠️ Limitations
As with all oscillators, the ZSFL will generate false signals in sideways/choppy markets.
Optimal parameters (length, loop size, thresholds) may differ across assets.
It is not a standalone trading system — use alongside other forms of analysis (trend filters, volume, higher timeframe confluence).
Double Median SD Bands | MisinkoMasterThe Double Median SD Bands (DMSDB) is a trend-following tool designed to capture market direction in a way that balances responsiveness and smoothness, filtering out excessive noise without introducing heavy lag.
Think of it like a house:
A jail (too restrictive) makes you miss opportunities.
No house at all (too unsafe) leaves you exposed to false signals.
DMSDB acts like a comfortable house with windows—protecting you from the noise while still letting you see what’s happening in the market.
🔎 Methodology
The script works in the following steps:
Standard Deviation (SD) Calculation
Computes the standard deviation of the selected price source (ohlc4 by default).
The user can choose whether to use biased (sample) or unbiased (population) standard deviation.
Raw Bands Construction
Upper Band = source + (SD × multiplier)
Lower Band = source - (SD × multiplier)
The multiplier can be adjusted for tighter or looser bands.
First Median Smoothing
Applies a median filter over half of the length (len/2) to both bands.
This reduces noise without creating excessive lag.
Second Median Smoothing
Applies another median filter over √len to the already smoothed bands.
This produces a balance:
Cutting the length → maintains responsiveness.
Median smoothing → reduces whipsaws.
The combination creates a fast yet clean band system ideal for trend detection.
📈 Trend Logic
The trend is detected based on price crossing the smoothed bands:
Long / Bullish (Purple) → when price crosses above the upper band.
Short / Bearish (Gold) → when price crosses below the lower band.
Neutral → when price remains between the bands.
🎨 Visualization
Upper and lower bands are plotted as colored lines.
The area between the bands is filled with a transparent zone that reflects the current bias:
Purple shading = Bullish zone.
Golden shading = Bearish zone.
This creates a visual tunnel for trend confirmation, helping traders quickly identify whether price action is trending or consolidating.
⚡ Features
Adjustable Length parameter (len) for dynamic control.
Adjustable Band Multiplier for volatility adaptation.
Choice between biased vs. unbiased standard deviation.
Double median smoothing for clarity + responsiveness.
Works well on cryptocurrencies (e.g., BTCUSD) but is flexible enough for stocks, forex, and indices.
✅ Use Cases
Trend Following → Ride trends by staying on the correct side of the bands.
Entry Timing → Use crossovers above/below bands for entry triggers.
Filter for Other Strategies → Can serve as a directional filter to avoid trading against the trend.
⚠️ Limitations & Notes
This is a trend-following tool, so it will perform best in trending conditions.
In sideways or choppy markets, whipsaws may still occur (although smoothing reduces them significantly).
The indicator is not a standalone buy/sell system. For best results, combine with volume, momentum, or higher-timeframe confluence.
All of this makes for a really unique & original tool, as it removes noise but keeps good responsitivity, using methods from many different principles which make for a smooth a very useful tool

Whale Money Flow DetectorKey Components:
Volume Analysis: Detects unusual volume spikes compared to average
Money Flow Index: Shows buying vs selling pressure
Whale Detection: Identifies large moves with high volume
Cumulative Flow: Tracks net whale activity over time
Visual Signals: Background colors and whale emoji labels
What it detects:
Large volume transactions (configurable multiplier)
Significant price moves with corresponding volume
Buying vs selling pressure from large players
Cumulative whale flow momentum
Customizable Parameters:
Volume MA Length (default: 20)
Whale Volume Multiplier (default: 2.0x)
Money Flow Length (default: 14)
Detection Sensitivity (default: 1.5)
Visual Features:
Green background for whale buying
Red background for whale selling
Whale emoji labels on significant moves
Real-time stats table
Multiple plot lines for different metrics
How to use:
Copy the code to TradingView's Pine Editor
Apply to your chart
Adjust sensitivity settings based on your asset's behavior
Set up alerts for whale buy/sell signals

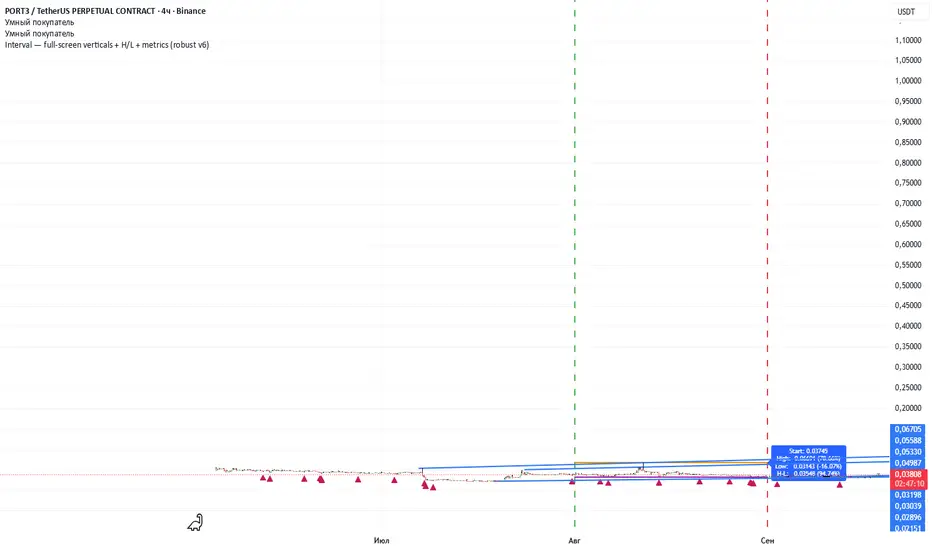
Interval — full-screen verticals + H/L + metrics (robust v6)Specify the start date of the analysis and the end date of the analysis, after which 2 vertical lines will appear, the extremes in this period will be marked, and the percentage of deviations will be shown. Next, you can switch assets and see how they behave over the same time interval.
Simple Technicals Table📊 Simple Technicals Table
🎯 A comprehensive technical analysis dashboard displaying key pivot points and moving averages across multiple timeframes
📋 OVERVIEW
The Simple Technicals Table is a powerful indicator that organizes essential trading data into a clean, customizable table format. It combines Fibonacci-based pivot points with critical moving averages for both daily and weekly timeframes, giving traders instant access to key support/resistance levels and trend information.
Perfect for:
Technical analysts studying multi-timeframe data
Chart readers needing quick reference levels
Market researchers analyzing price patterns
Educational purposes and data visualization
🚀 KEY FEATURES
📊 Dual Timeframe Analysis
Daily (D1) and Weekly (W1) data side-by-side
Real-time updates as market conditions change
Seamless comparison between timeframes
🎯 Fibonacci Pivot Points
R3, R2, R1 : Resistance levels using Fibonacci ratios (38.2%, 61.8%, 100%)
PP : Central pivot point from previous period's data
S1, S2, S3 : Support levels with same methodology
📈 Complete EMA Suite
EMA 10 : Short-term trend identification
EMA 20 : Popular swing trading reference
EMA 50 : Medium-term trend confirmation
EMA 100 : Institutional support/resistance
EMA 200 : Long-term trend determination
📊 Essential Indicators
RSI 14 : Momentum for overbought/oversold conditions
ATR 14 : Volatility measurement for risk management
🎨 Full Customization
9 table positions : Place anywhere on your chart
5 text sizes : Tiny to huge for optimal visibility
Custom colors : Background, headers, and text
Optional pivot lines : Visual weekly levels on chart
⚙️ HOW IT WORKS
Fibonacci Pivot Calculation:
Pivot Point (PP) = (High + Low + Close) / 3
Range = High - Low
Resistance Levels:
R1 = PP + (Range × 0.382)
R2 = PP + (Range × 0.618)
R3 = PP + (Range × 1.000)
Support Levels:
S1 = PP - (Range × 0.382)
S2 = PP - (Range × 0.618)
S3 = PP - (Range × 1.000)
Smart Price Formatting:
< $1: 5 decimal places (crypto-friendly)
$1-$10: 4 decimal places
$10-$100: 3 decimal places
> $100: 2 decimal places
📊 TECHNICAL ANALYSIS APPLICATIONS
⚠️ EDUCATIONAL PURPOSE ONLY
This indicator is designed solely for technical analysis and educational purposes . It provides data visualization to help understand market structure and price relationships.
📈 Data Analysis Uses
Support & Resistance Identification : Visualize Fibonacci-based pivot levels
Trend Analysis : Study EMA relationships and price positioning
Multi-Timeframe Study : Compare daily and weekly technical data
Market Structure : Understand key technical levels and indicators
📚 Educational Benefits
Learn about Fibonacci pivot point calculations
Understand moving average relationships
Study RSI and ATR indicator values
Practice multi-timeframe technical analysis
🔍 Data Visualization Features
Organized table format for easy data reading
Color-coded levels for quick identification
Real-time technical indicator values
Historical data integrity maintained
🛠️ SETUP GUIDE
1. Installation
Search "Simple Technicals Table" in indicators
Add to chart (appears in middle-left by default)
Table displays automatically on any timeframe
2. Customization
Table Position : Choose from 9 locations
Text Size : Adjust for screen resolution
Colors : Match your chart theme
Pivot Lines : Toggle weekly level visualization
3. Optimization Tips
Use larger text on mobile devices
Dark backgrounds work well with light text
Enable pivot lines for visual reference
✅ BEST PRACTICES
Recommended Usage:
Use for technical analysis and educational study only
Combine with other analytical methods for comprehensive analysis
Study multi-timeframe data relationships
Practice understanding technical indicator values
Important Notes:
Levels based on previous period's data
Most effective in trending markets
No repainting - uses confirmed data only
Works on all instruments and timeframes
🔧 TECHNICAL SPECS
Performance:
Pine Script v5 optimized code
Minimal CPU/memory usage
Real-time data updates
No lookahead bias
Compatibility:
All chart types (Candlestick, Bar, Line)
Any instrument (Stocks, Forex, Crypto, etc.)
All timeframes supported
Mobile and desktop friendly
Data Accuracy:
Precise floating-point calculations
Historical data integrity maintained
No future data leakage
📱 DEVICE SUPPORT
✅ Desktop browsers (Chrome, Firefox, Safari, Edge)
✅ TradingView mobile app (iOS/Android)
✅ TradingView desktop application
✅ Light and dark themes
✅ All screen resolutions
📋 VERSION INFO
Version 1.0 - Initial Release
Fibonacci-based pivot calculations
Dual timeframe support (Daily/Weekly)
Complete EMA suite (10, 20, 50, 100, 200)
RSI and ATR indicators
Fully customizable interface
Optional pivot line visualization
Smart price formatting
Mobile-optimized display
⚠️ DISCLAIMER
This indicator is designed for technical analysis, educational and informational purposes ONLY . It provides data visualization and technical calculations to help users understand market structure and price relationships.
⚠️ NOT FOR TRADING DECISIONS
This tool does NOT provide trading signals or investment advice
All data is for analytical and educational purposes only
Users should not base trading decisions solely on this indicator
Always conduct thorough research and analysis before making any financial decisions
📚 Educational Use Only
Use for learning technical analysis concepts
Study market data and indicator relationships
Practice chart reading and data interpretation
Understand mathematical calculations behind technical indicators
The Simple Technicals Table provides technical data visualization to assist in market analysis education. It does not constitute financial advice, trading recommendations, or investment guidance. Users are solely responsible for their own research and decisions.
Author: ToTrieu
Version: 1.0
Category: Technical Analysis / Support & Resistance
License: Open source for educational use
💬 Questions? Comments? Feel free to reach out!

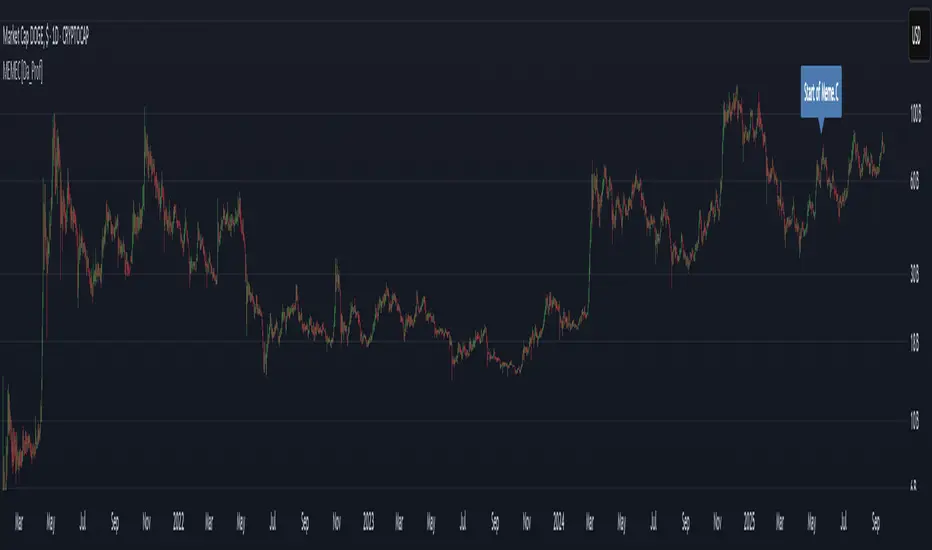
MEMEC - Meme Coin Market Cap [Da_Prof]For this indicator, the meme coin market cap of the top meme coins are added together to get an estimate of the total meme coin market cap back to the first meme coin, DOGE. Meme.C does this natively on TradingView, but its data only goes back to 19 May 2025. For the indicator, MEME.C supersedes the addition of all the individual meme coins (i.e., from 19 May 2025 to present). The start of MEME.C is labeled on the chart by default, but can be removed by deselecting the label in the settings.
After the creation of DOGE, but before data is available for Meme.C, the highest market cap meme coins are added together to estimate the meme coin market cap. The meme coins used by default are DOGE, SHIB, PEPE, BONK, FLOKI, PENGU, TRUMP, SPX6900, FARTCOIN, WIF, M, BRETT, B, MOG, APE, TURBO, DOG, and POPCAT. Users can select if they wish to disregard any or all of these coins. As of the creation of the indicator, DOGE, SHIB, and PEPE have CRYPTOCAP symbols on TradingView. Therefore, the true market cap of these coins is integrated into this indicator. The other meme coin market caps are estimated using price and the circulating supply as of 09/16/2025. I make no claims as to the indicator's exact accuracy. In fact, it isn't exactly accurate since I utilized the circulating supply on the day it was created, so for meme coins that have a changing supply, the market cap will be at least slightly inaccurate. Use this indicator at your own risk.
To use the indicator, it is best to plot overlayed on the CRYPTOCAP:DOGE chart. You can decide whether or not to hide the DOGE market cap.
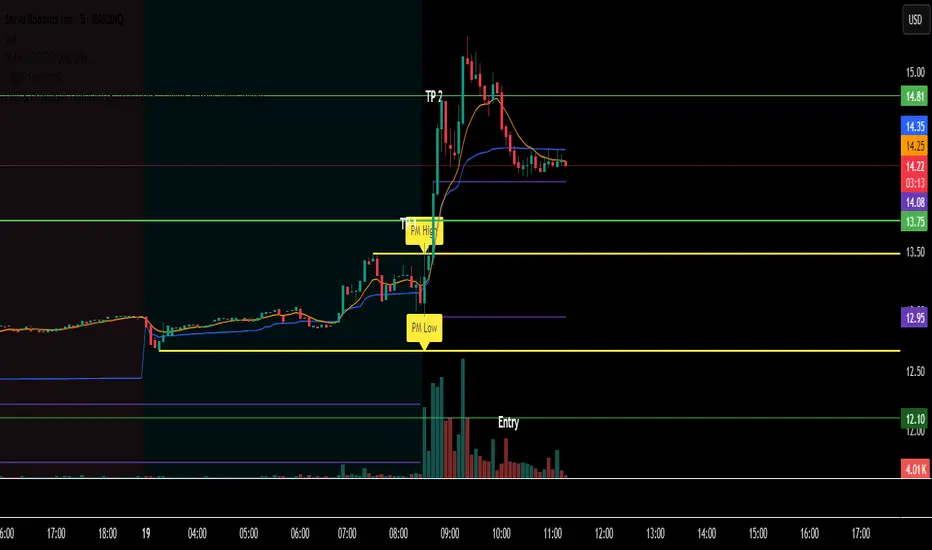
Otekura Range Trade Algorithm [Tradebuddies]The Range Trade Algorithm calculates the levels for Monday.
On the chart you will see that the Monday levels will be marked as 1 0 -1.
The M High level calculates Monday's high close and plots it on the screen.
M Low calculates the low close of Monday and plots it on the screen.
The coloured lines on the screen are the points of the range levels formulated with fibonacci values.
The indicator has its own Value table. The prices of the levels are written.
Potential Range breakout targets tell prices at points matching the fibonacci values. These are Take profit or reversal points.
Buy and Sell indicators are determined by the range breakout.
Users can set an alarm on the indicator and receive direct notification with their targets when a new range occurs.
Fib values are multiplied by range values and create an average target according to the price situation. These values represent an area. Breakdown targets show that the target is targeted until the area.

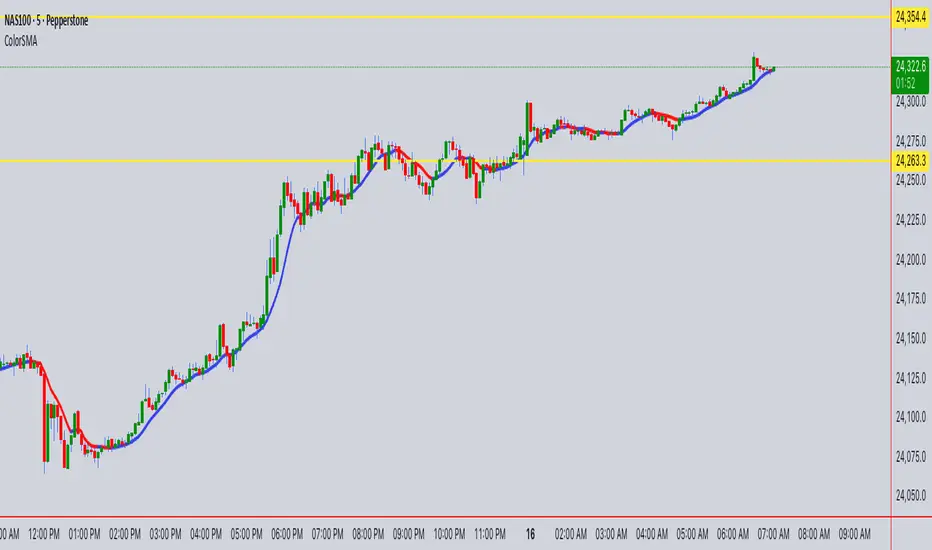
ColorSMAColorSMA Indicator – Description & Usage Guide
Overview
The ColorSMA indicator is a dynamic trend-following moving average designed to adapt to volatility and provide clearer visual cues for traders. Unlike a standard simple moving average (SMA), this tool applies a volatility filter using a standard deviation channel and then smooths the price before calculating the moving average.
The result is a single line on the chart that changes color depending on its trend direction:
Blue (Uptrend) – The moving average is rising compared to the previous bar.
Red (Downtrend) – The moving average is falling compared to the previous bar.
This visual coloring makes it easier to spot the trend direction at a glance.
How It Works
Baseline SMA
The script first calculates a classic SMA based on the selected Length (default = 9).
This baseline acts as the foundation of the indicator.
Volatility Filter (SD Channel)
A standard deviation multiplier is applied to create an upper and lower channel around the SMA.
If price moves outside this channel, it gets “clamped” back within the channel range.
This reduces noise and prevents false signals in highly volatile conditions.
Smoothed Price (Extra Smooth)
The filtered price is then smoothed with another SMA (default = 3).
This step makes the line cleaner and easier to interpret.
Trend Coloring
If the current smoothed SMA is higher than its previous value → the line is Blue.
If it is lower → the line is Red .
This simple but effective color-coding highlights trend shifts without cluttering the chart.
Inputs & Settings
Source: The price source used in the calculation (default = close).
Length: The SMA period length (default = 9).
Extra Smooth : Additional smoothing for the final line (default = 3). Lower values make it more responsive, higher values make it smoother.
Width (Volatility Filter – SD Channel): The multiplier applied to the standard deviation. Controls how wide the channel is (default = 0.3).
Length (Volatility Filter – SD Channel): The period for calculating standard deviation (default = 1).
What You See on the Chart
A single moving average line that changes color:
Blue (Up) = trend strength or bullish direction.
Red (Down) = trend weakness or bearish direction.
The line itself is already filtered through a volatility channel and smoothing, so it reacts to market conditions while reducing noise.
How to Use It
Trend Identification
Use the color changes (Blue/Red) to quickly identify short-term trend shifts.
Blue phases suggest bullish bias, Red phases suggest bearish bias.
Entry/Exit Guidance
Traders can align entries with the trend color (e.g., buy when it turns Blue, sell/short when it turns Red).
Combine with price action or other indicators for confirmation.
Volatility Filtering
Adjust the Width and SD Length parameters to tune how sensitive the indicator is to price fluctuations. Narrower channels give more signals; wider channels filter out more noise.
Smoothing Control
If you prefer faster reactions, lower the smoothing value.
If you want steadier signals, increase smoothing.
Summary
The ColorSMA is a visually enhanced moving average that adapts to volatility and simplifies trend detection. It is especially useful for traders who prefer:
Clean charts with minimal clutter.
Clear, color-coded signals for trend direction.
Flexibility to adjust responsiveness via smoothing and channel width.
This indicator is best used as a trend confirmation tool or combined with other strategies such as support/resistance, candlestick patterns, or oscillators for robust trade setups.
Ultimate📖 Indicator Description – Ultimate
The Ultimate Indicator is a complete charting framework that combines linear regression channels, dynamic deviation bands, EMA ribbons, volatility spreads, and entry/exit markers. It is designed to help traders visualize trend direction, potential reversals, and trade setups with precision.
🔹 What You See on the Chart
Channel Lines (Linear Regression Bands)
Green dotted line (median): Fair value trendline based on regression.
Red dashed line (upper band): Dynamic resistance zone.
Blue dashed line (lower band): Dynamic support zone.
Mid-bands (thin dotted red/blue): Halfway between median and outer bands, useful for scaling entries or partial exits.
🔹 EMA Ribbon (Light Green Shades)
Multiple EMAs (5, 8, 13, 21, 34) plotted in progressively lighter green.
Helps visualize momentum shifts and trend strength.
Ribbon turns more aqua/green when short-term EMAs align bullishly.
🙌Markers on Price
🔴 Red Circle (Dot): Short entry signal (price rejecting upper deviation band).
🔵 Blue Circle (Dot): Long entry signal (price bouncing off lower deviation band).
❌ Red X: Peak formation detected, potential short setup (not always valid).
🔷 Blue Diamond: Trough formation detected, potential long setup (not always valid).
Numbers Above/Below Candles
🔴Red numbers (above peaks): % spread from the bottom to the peak, showing upward volatility.
🔵 Blue numbers (below troughs): % spread from the top to the trough, showing downward volatility.
These values help traders gauge the strength of recent swings and compare volatility expansions.
🔹 Signal Logic🔹
🔵Long Signal (Blue Circle):
Forms when price makes a trough and crosses back above the lower regression band.
Confirms potential upside reversal with stop-loss guided by ATR or swing low.
🔴Short Signal (Red Circle):
Forms when price makes a peak and crosses below the upper regression band.
Confirms potential downside reversal with stop-loss guided by ATR or swing high.
❌ Peaks (Red X):
Indicate local tops. Not all peaks convert into shorts, but they warn of resistance zones.
🔹Troughs (Blue Diamonds):
Indicate local bottoms. Not all troughs convert into longs, but they warn of support zones.
🔹 Alerts
When a valid long or short setup is confirmed, an alert fires with:
Ticker name
Entry price
Suggested position size (Quantity)
Stop loss level (ATR-based or HL-based)
Take profit level (calculated by reward multiple)
🔹 Inputs & Customization
Quantity: Lot size suggestion.
Deviation: Multiplier for regression channel width.
Take Profit: Risk-to-reward multiplier.
Stop Loss: ATR or High/Low based.
Trend Lines: Choose between extended or fixed channels.
Period: Lookback window for regression.
Spread Percentages: Toggle volatility labels on/off.
🔹 How to Use
Trend Following: Ride price inside the channel using EMA ribbon alignment.
Reversal Trading: Enter at deviation extremes with confirmation signals.
Volatility Mapping: Use spread % labels to measure the strength of market swings.
Risk Management: ATR-based stops adapt to volatility, while HL stops give structural support/resistance.
✅ In summary:
The Ultimate Indicator is not just a regression channel—it’s a multi-layered system that highlights trend bias, entry/exit signals, volatility spreads, and adaptive risk levels. It allows traders to see at a glance whether the market is trending, ranging, or preparing for a reversal.

Weighted Sector ADD (sign-weighted)What it is
A true, cap-weighted advances/declines (ADD) proxy for the S&P 500 using sector ETFs. Each sector contributes +1 if it’s up on the bar, −1 if it’s down, 0 if flat. Those signals are then weighted by your sector weights (auto-normalized to 100%) and summed into a single breadth line. The result is a fast, low-noise read of how much of the S&P (by sector weight) is advancing vs. declining right now.
- Tracks participation, not price magnitude—perfect for spotting “broad vs. narrow” moves
- Heavily weighted sectors (e.g., Tech) matter proportionally more, reflecting real index impact
- Simple scale: ~−1 to +1 (all weight down → all weight up)
Chart Elements
- Green/Red Columns – “Weighted ADD”: Current bar’s weighted breadth (sign-based by default)
- Blue Line – “Weighted MA”: SMA of the weighted ADD (regime filter)
- Zero/Guide Lines (optional): 0.0, ±0.2 (mild), ±0.6 (strong)
- Labels (optional): Text markers at those guide levels
- Advancing Weight % (optional): Label showing ((ADD+1)/2)*100 → share of total sector weight advancing
How to Read (Quick Guide)
- +0.60 to +1.00 → Broad, one-sided risk-on (most sector weight advancing)
- +0.20 to +0.60 → Moderate, supportive breadth
- −0.20 to +0.20 → Mixed/choppy; rotation
- −0.60 to −1.00 → Broad, one-sided risk-off
- MA above/below zero → Simple regime indicator; zero-crosses could be potential alert triggers
- Divergence: Strong price move with a weak/flat ADD could potentially warn of narrow participation
Inputs & settings
Calculation
- Use returns instead of up/down sign?
OFF (default): true weighted participation (+1/−1/0)
ON: weighted sector returns (winsor-capped). Use if you want magnitude, not just direction
- Winsor cap (returns mode): Caps per-sector contribution in returns mode (e.g., 0.02 = ±2%)
- Smoothing MA length: SMA period for the blue “Weighted MA” line
- Source timeframe: Compute signals on another TF (e.g., “60”) but plot on your chart TF
Visibility
- Show Weighted ADD (bars): Toggle the green/red columns
- Show Weighted ADD MA: Toggle the blue SMA line
- Show Zero Line (0): Toggle the 0.0 reference line
- Show ±0.2 / ±0.6 guide lines: Toggle the helper levels
- Show guide labels: Draw small text labels at 0, ±0.2, ±0.6
- Guide label offset (bars left): Move labels left if they overlap the right edge values
- Show Advancing Weight % label: Toggle the % of sector weight currently advancing
Sector Symbols (ETF proxies)
- XLK, XLY, XLF, XLV, XLC, XLI, XLP, XLE, XLB, XLU, XLRE: Defaults to the SPDR sector ETFs. You can swap for alternative proxies if desired.
Sector Weights (auto-normalize)
- Weight inputs for each sector (e.g., Tech 0.30, Financials 0.13…). These auto-normalize to 1.0 so you can paste rough numbers; the script scales them.
- Keep weights fresh. GICS sector weights drift; update periodically (e.g., quarterly).
Alerts included
- “Weighted ADD crossed above 0”
- “Weighted ADD crossed below 0”
Version
v1.0 – Initial release (weighted sign-based ADD + SMA, zero/guide lines & labels, Adv % label, alerts).

RSI (8 & 13) + Fibonacci LevelsIndicator Description: RSI (8 & 13) + Fibonacci Levels
This custom indicator is designed to provide a dual-speed RSI framework with embedded Fibonacci retracement levels for advanced momentum and reversal analysis. It combines the power of relative strength measurement with the natural harmony of Fibonacci ratios to give traders a structured approach to market timing and confluence trading.
The indicator plots two RSI lines on a dedicated sub-chart:
RSI Fast (8) → short-term momentum, highly sensitive to price action, helps identify quick shifts and micro-trends.
RSI Slow (13) → smoother and less volatile, acts as confirmation of broader trend direction and underlying strength.
By combining both RSI speeds, traders can spot alignment, divergences, and crossover signals between fast and slow momentum. When both lines move in sync, it reflects strong conviction; when they diverge, it signals potential exhaustion or trend shifts.
Overlaying Fibonacci retracement levels on RSI adds an extra dimension of precision. Instead of using arbitrary zones, the indicator relies on mathematically significant levels tied to natural market cycles:
23.6% → shallow pullbacks, early momentum pauses.
38.2% → minor retracements, often signaling trend continuation.
50% → balance point between strength and weakness.
61.8% → golden ratio, strong correction or reversal zone.
78.6% → deep retracement, last line before full reversal.
In addition, the script marks the classic RSI boundaries:
70 (Overbought) → potential profit-taking, stretched bullish conditions.
30 (Oversold) → potential accumulation, stretched bearish conditions.
Together, these zones help traders gauge not only when the RSI is “too high” or “too low,” but also where price momentum aligns with natural Fibonacci retracement zones. This approach transforms RSI from a simple oscillator into a multi-layered momentum map.
Practical Uses:
Trend Confirmation → When RSI(8) and RSI(13) are both above 50 and rising, bullish strength is confirmed.
Divergence Detection → If price makes higher highs but RSI(8) fails to confirm, it warns of weakening momentum.
Reversal Hunting → Look for RSI rejection candles at Fib levels (e.g., fast RSI hitting 61.8 and rolling over).
Entry/Exit Timing → Use fast RSI crossovers with slow RSI as tactical entries within the broader structure.
Confluence Trading → Strong signals occur when RSI rejection coincides with price structure (double tops/bottoms, Fibonacci levels on chart, Bollinger Band rejections).
This indicator is especially powerful when paired with Bollinger Bands or price action rejection patterns, creating a system where price extremes are validated against RSI Fib zones.
Ultimately, the RSI (8 & 13) + Fibonacci Levels indicator acts as a precision filter — helping traders separate noise from genuine turning points and reinforcing entries/exits with multiple layers of confluence.

Bollinger Bands (SMA 21, 2.618σ)Indicator Description: Bollinger Bands (2.618σ, 21 SMA) + RSI with Fibonacci
This custom indicator combines Bollinger Bands and Relative Strength Index (RSI), enhanced with Fibonacci-based configurations, to provide confluence signals for rejection candles, reversal setups, and continuation patterns.
Bollinger Bands Settings (Customized)
Middle Band → 21-period Simple Moving Average (SMA)
Upper Band → SMA + 2.618 standard deviations
Lower Band → SMA − 2.618 standard deviations
These parameters expand the bands compared to the traditional (20, 2.0) settings, making them better suited for volatility extremes and higher timeframe swing analysis.
Color Scheme
Middle Band = Orange
Upper Band = Red
Lower Band = Green
This color-coding emphasizes key rejection levels visually.
Candle Rejection Logic
The indicator is designed to highlight potential rejection candles when price interacts with the outer Bollinger Bands:
At the Upper Band, rejection signals suggest overextension and potential downside reaction.
At the Lower Band, rejection signals suggest oversold conditions and potential upside reaction.
Rejection Candle Types Tracked
Hammer (bullish reversal, lower rejection wick at bottom band)
Inverted Hammer (bearish reversal, upper rejection wick at top band)
Doji candles (indecision at band extremes)
Double Top formations near the upper band
Double Bottom formations near the lower band
Relative Strength Index (RSI) Settings
RSI is configured with Fibonacci retracement levels instead of traditional 30/70 thresholds.
Fibonacci sequence levels used include:
23.6% (0.236)
38.2% (0.382)
50% (0.5)
61.8% (0.618)
78.6% (0.786)
This alignment with Fibonacci ratios provides deeper market structure insights into momentum strength and exhaustion points.
Trading Confluence Zones
Upper Band + RSI at 0.618–0.786 zone → High probability bearish rejection.
Lower Band + RSI at 0.236–0.382 zone → High probability bullish reversal.
Band interaction + Doji or Hammer candles → Stronger signal confirmation.
Use Cases
Identifying trend exhaustion when price repeatedly fails to break above the upper band.
Spotting accumulation or distribution phases when price consolidates around Fibonacci-based RSI zones.
Detecting false breakouts when candle patterns (like Doji or Inverted Hammer) occur beyond the bands.
Why 2.618 Deviation & 21 SMA?
Standard Bollinger Bands (20, 2.0) capture ~95% of price action.
By widening to 2.618σ, we target extreme volatility outliers — areas where reversals are statistically more likely.
A 21-period SMA aligns better with common cycle lengths (3 trading weeks on daily charts) and Fibonacci-related time cycles.
Practical Strategy
Step 1: Watch when price touches or pierces the upper/lower band.
Step 2: Check for candle rejection patterns (Hammer, Inverted Hammer, Doji, Double Top/Bottom).
Step 3: Confirm with RSI Fibonacci levels for confluence.
Step 4: Trade with the prevailing trend or look for reversal setups if multiple confluence factors align.
Cautions
Not all touches of the bands signal reversals — strong trends can ride along the bands for extended periods.
Always combine with price action structure, volume, and higher timeframe trend bias.
📌 Summary
This indicator blends volatility-based bands with Fibonacci momentum analysis and classical candle rejection patterns. The combination of Bollinger Bands (21, 2.618σ) and RSI Fibonacci levels helps traders detect high-probability rejection zones, reversal opportunities, and overextended conditions with improved accuracy over traditional default settings.

Weekly Session BreakThis indicator plots a vertical line at the end of the trading week (Friday) to mark the weekly session break. It is designed to be used on intraday charts (sub-1 hour timeframes).
The line's appearance is fully customizable via the Inputs tab, allowing you to change its color, style (solid, dotted, or dashed), and thickness.
Key Features:
End-of-Week Marker: Accurately draws a vertical line on the last bar of the trading week.
Timeframe Specific: Lines are only visible on intraday charts (1-minute to 59-minute timeframes) to prevent clutter on higher timeframes.
Customizable: Adjust the line's color, style, and thickness from the Inputs menu.

Smart Index Levels — GSK-VIZAG-AP-INDIA📌 Smart Index Levels — GSK-VIZAG-AP-INDIA
Smart Index Levels is a versatile support and resistance plotting tool designed for intraday, weekly, and monthly analysis.
It automatically generates key price zones based on user-defined step sizes, helping traders visualize important market levels more clearly.
🔹 Features
Daily / Weekly / Monthly Modes
Switch easily between daily, weekly, or monthly reference levels.
Customizable Level Steps
Choose step intervals of 50 or 100 points for cleaner index-based zones.
Support & Resistance Zones
Auto-draws multiple support and resistance levels around the opening base price.
Mid-Level Marking
Highlights the nearest “mid” price level for balance reference.
Weekly High/Low Tracking (Optional)
Plots dynamic weekly high & low levels with dotted lines.
Monthly High/Low Tracking (Optional)
Displays monthly high & low levels for broader market context.
Custom Market Session Timing
Define your own market open and close times.
Line Style & Colors
Fully customizable line styles (solid, dashed, dotted) and colors.
⚙️ How It Works
At the start of the selected session (daily, weekly, or monthly), the script identifies the opening reference price.
From this base, it calculates and draws support and resistance levels at fixed step intervals.
Optionally, it overlays weekly and monthly high/low levels for additional perspective.
This provides a structured price map that helps you quickly spot potential reaction zones, without cluttering the chart.
🖥️ Best Use Cases
Intraday index traders who want quick reference levels (Nifty, BankNifty, etc.)
Swing traders who prefer weekly and monthly zones for context.
Anyone looking for clean, rule-based support/resistance plotting.
⚠️ Disclaimer
This indicator is for educational and informational purposes only.
It does not provide financial advice or trading signals. Always use in combination with your own analysis and risk management.

Iani SMC Sniper XAU v2.2 (Long+Short + News Countdown, v6)Iani SMC Sniper v2.6 — Anytime • Auto Pip • FVG 50% • OB • News Panel
Smart-Money Concepts made simple for intraday XAU/USD (works on any symbol).
Finds BOS, 50% FVG “sniper” entries, optional Order Blocks, London H/L, news countdown, and a mini info panel.
What it does
BOS (Break of Structure): detects bullish/bearish BOS after London sweep logic.
FVG 50% entries: plots precise long/short entry dots at the midpoint of the gap.
Auto TP/SL: TP = RR × risk, SL below/above recent swing with a small buffer.
Order Blocks (optional): marks the last opposite candle after BOS and alerts on OB revisit.
London High/Low: tracks session range; session filter is optional.
News countdown: shows next event time and minutes left (user-selectable timezone).
Mini Panel: top-left table with Trend (last BOS), Next news, R:R, Pip size.
Inputs (key)
Auto pip size: uses syminfo.mintick. Manual override available.
Risk:Reward (RR): default 2.0.
Pivot length: swing sensitivity.
Sessions: enable if you want signals only 12:00–20:00 (symbol timezone). Off = anytime.
News timezone: pick your own (e.g., Europe/Brussels, America/New_York).
Absolute & daily times: add your events (strings like 2025-09-17 20:00 or 14:30,16:00…).
Show labels/levels/OBs: toggle on/off.
Alerts included
BOS Bullish / BOS Bearish
BUY Entry / SELL Entry (return to 50% FVG)
Bullish OB revisit / Bearish OB revisit
TP Long/Short reached, SL Long/Short hit
NEWS WARNING (warning window only; does not block signals)
To use: Add Alert → Condition: this indicator → choose any of the alertconditions.
Best use
Bias: H1 for structure.
Execution: M15 (standard) or M5 (aggressive).
Works great on XAUUSD, but is symbol-agnostic (auto pip adapts).
Notes
News times display in the timezone you pick in settings.
OBs are a simple implementation meant for quick visual guidance.
Labels: BUY/SELL near entries, TP/SL on set and when hit, BOS up/down.
Risk disclaimer
This tool is for education only. Not financial advice. Backtest and manage risk.
