Consolidation Breakout [Indian Market Timing]OK let's get started ,
A Day Trading (Intraday) Consolidation Breakout Indication Strategy that explains time condition for Indian Markets .
The commission is also included in the strategy .
The basic idea is ,
1) Price crosses above upper band , indicated by a color change (green) is the Long condition .
2) Price crosses below lower band , indicated by a color change (red) is the Short condition .
3) ATR is used for trailing after entry
// ═══════════════════════════════//
// ————————> TIME CONDITION <————————— //
// ═══════════════════════════════//
The Indian Markets open at 9:15am and closes at 3:30pm.
The time_condition specifies the time at which Entries should happen .
"Close All" function closes all the trades at 2:57pm.
All open trades get closed at 2:57pm , because some brokers dont allow you to place fresh intraday orders after 3pm.
NSE:NIFTY1!
// ═══════════════════════════════════════════════ //
// ————————> BACKTEST RESULTS ( 114 CLOSED TRADES )<————————— //
// ═══════════════════════════════════════════════ //
LENGTH , MULT (factor) and ATR can be changed for better backtest results.
The strategy applied to NIFTY (3 min Time-Frame and contract size 5) gives us 60% profitability , as shown below
It was tested for a period a 8 months with a Profit Factor of 2.2 , avg Trade of 6000Rs profit and Sharpe Ratio : 0.67
The graph has a Linear Curve with consistent profits.
NSE:NIFTY1!
Save it favorites.
Apply it to your charts Now !!
Thank me later ;)
חפש סקריפטים עבור "backtest"

TradeChartist Donchian Channels Breakout Strategy™TradeChartist Donchian Channels Breakout Strategy is the strategy backtester version of ™TradeChartist Donchian Channels Breakout Filter .
===================================================================================================================
Features of ™TradeChartist Donchian Channels Breakout Strategy
========================================================
Option to plot Donchian Channels of user preferred length, based on the Source price in addition to High/Low Donchian Channels.
Generates trade entries based on user preferred Breakout Price. For example, if the user prefers HL2 as breakout price, irrespective of the Donchian Channels type, trade entries are generated only when hl2 price (average of high/low) breaks out of the upper or lower band.
Option to plot background colour based on Breakout trend. The bull zones are filled with green background, the Bear zones are filled with red background and the bar that broke out is filled with orange background.
Option to colour price bars using Donchian Channels price trend. The Donchian Channels basis line is plotted using the same colours as coloured bars as default.
Note: This script does not repaint. To use the script for trade entries, wait for the bar close without Backtester or Strategy entries (with Backtester) and use a second confirmator (includes fundamentals) based on asset type as some markets require users to have good pulse on the fundamentals as trading by Technicals/price action dynamic alone may not be safe.
Note: Trend Based Stochastic of the same DC Length can be used from ™TradeChartist Risk Meter for Trade Confirmations too.
===================================================================================================================
Best Practice: Test with different settings first using Paper Trades before trading with real money
===================================================================================================================
This is not a free to use strategy. Get in touch with me (PM me directly if you would like trial access to test the strategy)
Premium Scripts - Trial access and Information
Trial access offered on all Premium scripts.
PM me directly to request trial access to the scripts or for more information.
===================================================================================================================

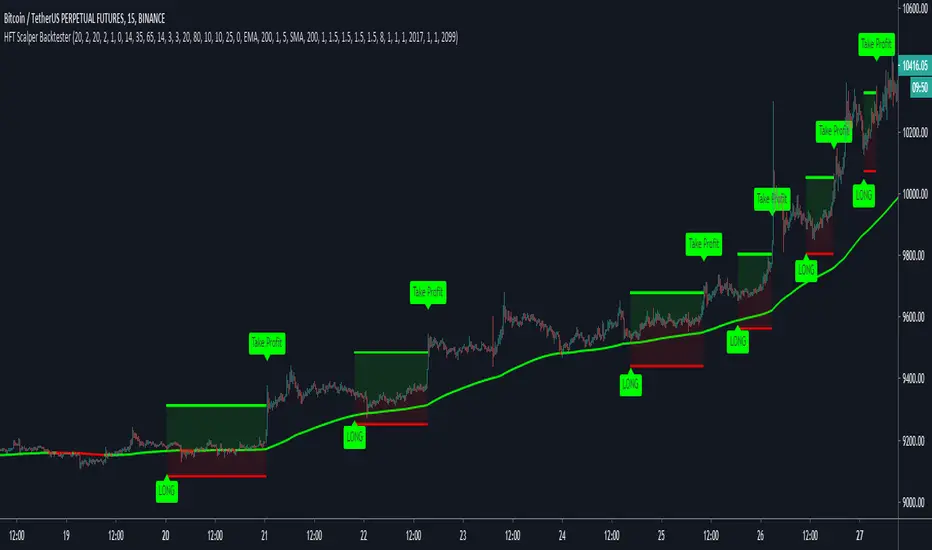
HFT Scalper BacktesterThis strategy is a scalper strategy developed by HFT Research. Scalper is highly customizable and provides endless opportunities to find profitable setups in the market.
Use Bollinger Bands
This piece of the settings will turn and off Bollinger band’s input in the decision making. BB Length will determine the Moving average you are using to take the standard deviation off of which is named as BB Multiplier. Default settings will use 20 moving average and take standard deviation of 2 to create lower and upper bands. Increasing the Multiplier will give you fewer but safer entries.
Use Bollinger Bands %
This setting will allow the user to determine at what Bollinger band width %, he wants to take start looking to take trades. It is known that when prices are stable and moving sideways, Bollinger bands contract and it becomes more reactive to small moves in the market. Using this setting, you can ignore the signals that would be generated while Bollinger bands are contracted. This setting will allow the user to weed out the noise in the market and really allow them to make the most out of Bollinger bands .
Use RSI
You can also turn on and off the RSI as well. Alternatively, there is an option to use RSI on a different time frame than you are currently on. For example, if you are looking at the 5min chart to use Bollinger bands but you would like to look at the RSI value on the 15min chart. You can do so by selecting the custom RSI timeframe as well as adjusting the Oversold and Overbought value.
Use STOCH
For those who want extra protection on their entry can throw STOCH into their decision making. STOCH acts like RSI but it is more prone to small moves. It will help the users to get a better entry if used correctly. Stoch may not be in the buy zone when RSI is at say 35, however, if price dips a little more and STOCH might be in the buy zone when RSI is at say 20. This way it will help you have better entries than just using RSI . In a way, you can use STOCH to scalp RSI .
Use VWAP
VWAP stands for volume weighted average price . It is an extremely useful indicator when trading intra-day. It does reset every trading session which is at 00:00 UTC . Instead of looking at x number of candles and providing an average price, it will take into consideration volume that’s traded at a certain price and weigh it accordingly.
Use ADX
ADX stands for average directional index . It is an indicator that measures volatility in the market. Unfortunately, the worst market condition for this strategy is sideways market. ADX becomes a useful tool since it can detect trend. If the volatility is low and there is no real price movement, ADX will pick that up and will not let you get in trades during a sideways market. It will allow you to enter trades only when the market is trending.
Use MA Filters
Lookback: It is an option to look back x number of candles to validate the price crossing. If the market is choppy and the price keeps crossing up and down the moving average you have chosen, it will generate a lot of “noisy” signals. This option allows you to confirm the cross by selecting how many candles the price needs to stay above or below the moving average. Setting it 0 will turn it off.
MA Filter Type: There is a selection of moving averages that is available on TradingView currently. You can choose from 14 different moving average types to detect the trend as accurate as possible.
Filter Length: You can select the length of your moving average. Most commonly used length being 50,100 and 200.
Filter Type: This is our propriety smoothing method in order to make the moving averages lag less and influence the way they are calculated slightly. Type 1 being the normal calculation and type 2 being the secret sauce .
Reverse MA Filter: This option allows you to use the moving average in reverse. For example, the strategy will go long when the price is above the moving average. However, if you use the reserve MA Filter, you will go short when the price is above the moving average. This method works best in sideways market where price usually retraces back to the moving average. So in an anticipation of price reverting back to the moving average, it is a useful piece of option to use during sideway markets which is the worst market condition for scalper.
Please visit our website for more information
Quickie (Free) BacktesterQuickie is a free tradingview Indicator developed by HFT Research. It works in sideways and trending markets depending the way you set it as well as both on short time frame and long time frame. It comes with backtesting abilities on tradingview.
BITMEX:XBTUSD
Use Bollinger Bands
This piece of the settings will turn and off Bollinger band’s input in the decision making. BB Length will determine the Moving average you are using to take the standard deviation off of which is named as BB Multiplier. Default settings will use 20 moving average and take standard deviation of 2 to create lower and upper bands. Increasing the Multiplier will give you fewer but safer entries
Use RSI
You can also turn on and off the RSI as well. Alternatively, there is an option to use RSI on a different time frame than you are currently on. For example, if you are looking at the 5min chart to use Bollinger bands but you would like to look at the RSI value on the 15min chart. You can do so by selecting the custom RSI timeframe as well as adjusting the Oversold and Overbought value.
Use MA Filter
Lookback: The indicator has an option to look back x number of candles to validate the price crossing. If the market is choppy and the price keeps crossing up and down the moving average you have chosen, it will generate a lot of “noisy” signals. This option allows you to confirm the cross by selecting how many candles the price needs to stay above or below the moving average. Setting it 0 will turn it off.
MA Filter Type: There is a selection of moving averages that is available on TradingView currently. You can choose from 14 different moving average types to detect the trend as accurate as possible.
Filter Length: You can select the length of your moving average. Most commonly used length being 50,100 and 200.
Filter Type: This is our propriety smoothing method in order to make the moving averages lag less and influence the way they are calculated slightly. Type 1 being the normal calculation and type 2 being the secret sauce.
Reverse MA Filter: This option allows you to use the moving average in reverse. For example, the strategy will go long when the price is above the moving average. However, if you use the reserve MA Filter, you will go short when the price is above the moving average. This method works best in sideways market where price usually retraces back to the moving average. So, in an anticipation of price reverting back to the moving average, it is a useful piece of option to use during sideway markets.
For more information please check out our website

APEX - Tester - Buy/Sell Strategies - Basic - BACKTESTERThis is a upgraded version of the following study.
This is a simple Strategy for backtesting your APEX trading ideas.
Be aware that the results will not be exact same as with apex bot.

[Autoview][BackTest]Dual MA Ribbons R0.12 by JustUncleLThis is an implementation of a strategy based on two MA Ribbons, a Fast Ribbon and a Slow Ribbon. This strategy can be used on Normal candlestick charts or Renko charts (if you are familiar with them).
The strategy revolves around a pair of scripts: One to generate alerts signals for Autoview and one for Backtesting, to tune your settings.
The risk management options are performed within the script to set SL(StopLoss), TP(TargetProfit), TSL(Trailing Stop Loss) and TTP (Trailing Target Profit). The only requirement for Autoview is to Buy and Sell as directed by this script, no complicated syntax is required.
The Dual Ribbons are designed to capture the inferred behavior of traders and investors by using two groups of averages:
> Traders MA Ribbon: Lower MA and Upper MA (Aqua=Uptrend, Blue=downtrend, Gray=Neutral), with center line Avg MA (Orange dotted line).
> Investors MAs Ribbon: Lower MA and Upper MA (Green=Uptrend, Red=downtrend, Gray=Neutral), with center line Avg MA (Fuchsia dotted line).
> Anchor time frame (0=current). This is the time frame that the MAs are calculated for. This way 60m MA Ribbons can be viewed on a 15 min chart to establish tighter Stop Loss conditions.
Trade Management options:
Option to specify Backtest start and end time.
Trailing Stop, with Activate Level (as % of price) and Trailing Stop (as % of price)
Target Profit Level, (as % of price)
Stop Loss Level, (as % of price)
BUY green triangles and SELL dark red triangles
Trade Order closed colour coded Label:
>> Dark Red = Stop Loss Hit
>> Green = Target Profit Hit
>> Purple = Trailing Stop Hit
>> Orange = Opposite (Sell) Order Close
Trade Management Indication:
Trailing Stop Activate Price = Blue dotted line
Trailing Stop Price = Fuschia solid stepping line
Target Profit Price = Lime '+' line
Stop Loss Price = Red '+' line
Dealing With Renko Charts:
If you choose to use Renko charts, make sure you have enabled the "IS This a RENKO Chart" option, (I have not so far found a way to Detect the type of chart that is running).
If you want non-repainting Renko charts you MUST use TRADITIONAL Renko Bricks. This type of brick is fixed and will not change size.
Also use Renko bricks with WICKS DISABLED. Wicks are not part of Renko, the whole idea of using Renko bricks is not to see the wick noise.
Set you chart Time Frame to the lowest possible one that will build enough bricks to give a reasonable history, start at 1min TimeFrame. Renko bricks are not dependent on time, they represent a movement in price. But the chart candlestick data is used to create the bricks, so lower TF gives more accurate Brick creation.
You want to size your bricks to 2/1000 of the pair price, so for ETHBTC the price is say 0.0805 then your Renko Brick size should be about 2*0.0805/1000 = 0.0002 (round up).
You may find there is some slippage in value, but this can be accounted for in the Backtest by setting your commission a bit higher, for Binance for example I use 0.2%
Special thanks goes to @CryptoRox for providing the initial Risk management Framework in his "How to automate this strategy for free using a chrome extension" example.

Hilega Milega v6 - Pure EMA/SMA (Nitesh Kumar) + Full BacktestHilega to milega
he Hilega Milega Strategy, inspired by the technique of Nitesh Kumar, is designed for intraday and swing traders who want structured entries and exits with clear demand–supply logic.
🔑 Core Features
Demand & Supply Zones – Automatically plots potential strong buying and selling zones for high-probability trades.
Trend Identification – Uses a blend of EMAs/SMA crossovers to identify bullish and bearish market bias.
Buy & Sell Signals – Generates real-time visual signals based on “Hilega Milega” rules for quick decision-making.
Risk Management – Suggested stop-loss levels are derived from recent demand–supply areas to minimize drawdowns.
Backtesting Enabled – Traders can test the performance across multiple assets (stocks, forex, crypto, commodities).
📊 How It Works
Buy Signal → When price action confirms a bullish zone with supporting trend filters.
Sell Signal → When price action confirms a bearish zone or reversal pattern.
Flat/Exit → Position closed when opposite signal triggers or demand–supply imbalance fades.
⚡ Best Use Cases
Intraday trading (5m, 15m, 1H charts).
Swing trading (4H, Daily charts).
Works across stocks, crypto, commodities, and forex.
⚠️ Disclaimer: This strategy is for educational purposes. Backtest thoroughly and apply proper risk management before live trading.

Multi-MA Strategy Analyzer with BacktestMulti-MA Strategy Analyzer with Backtest
This TradingView Pine Script indicator is designed to analyze multiple moving averages (SMA or EMA) dynamically and identify the most profitable one based on historical performance.
Features
Dynamic MA Range:
Specify a minLength, maxLength, and step size.
Automatically calculates up to 20 MAs.
Custom MA Calculation:
Uses custom SMA and EMA implementations to support dynamic length values.
Buy/Sell Logic:
Buy when price crosses above a MA.
Sell when price crosses below.
Supports both long and short trades.
Performance Tracking:
Tracks PnL, number of trades, win rate, average profit, and drawdown.
Maintains individual stats for each MA.
Best MA Detection:
Automatically highlights the best-performing MA.
Optional showBestOnly toggle to focus only on the best line and its stats.
Visualization:
Up to 20 plot() calls (static) for MAs.
Green highlight for the best MA.
Color-coded result table and chart.
Table View
When showBestOnly = false, the table displays all MAs with stats.
When showBestOnly = true, the table displays only the best MA with a summary row.
Includes:
Best MA length
Total PnL
Number of trades
Win rate
Avg PnL per trade
Max Drawdown
Configuration
minLength (default: 10)
maxLength (default: 200)
step (default: 10)
useEMA: Toggle between EMA and SMA
showBestOnly: Focus on best-performing MA only
Notes
MA plotting is static, limited to 20 total.
Table supports highlighting and is optimized for performance.
Script is structured to run efficiently using arrays and simple int where required.
Potential Extensions
Add visual buy/sell arrows
Export stats to CSV
Strategy tester conversion
Custom date range filtering for backtesting
Author: Muhammad Wasim
Version: 1.0

Enhanced Gold Scalping Strategy (Backtest with Time Filter)Enhanced Gold Scalping Strategy (Backtest with Time Filter)
This script is a scalping strategy designed specifically for trading gold on lower timeframes, incorporating popular technical indicators and a session filter for optimal performance. The strategy aims to achieve consistency by combining trend-following and volatility-based conditions.
Key Features:
Indicators Used:
Exponential Moving Average (EMA): Filters trades based on the trend direction using a 50-period EMA.
Relative Strength Index (RSI): Ensures trades are taken in favorable momentum conditions (above 30 for longs and below 70 for shorts).
MACD Crossover: Identifies potential trade entries based on MACD line crossing above/below the signal line.
Average True Range (ATR): Used to dynamically calculate Stop Loss and Take Profit levels and ensure trades occur in high-volatility conditions.
Risk-Reward Optimization:
The strategy uses a customizable Risk-Reward Ratio (default is 2:1) for setting Stop Loss (SL) and Take Profit (TP) levels, ensuring that winning trades outweigh losses.
Volatility Filter:
Trades are only executed when the current ATR exceeds the 14-period ATR moving average by a defined threshold, filtering out low-volatility periods.
Session Filter:
The strategy only trades during active market hours (8:00 AM to 8:00 PM Amsterdam Time) on weekdays. This ensures trades align with periods of high liquidity and market activity.
Dynamic Entry and Exit Levels:
SL and TP levels are plotted dynamically on the chart to provide a clear visual of potential risk and reward for each trade.
Buy and Sell Signals:
Visual markers (green triangles for buy, red triangles for sell) on the chart to highlight entry points for better trade visibility.
How It Works:
Long Conditions:
MACD crossover (MACD line above the signal line).
RSI above 30.
Price is above the 50-period EMA.
ATR-based volatility condition is met.
Trade must occur within the defined session hours.
Short Conditions:
MACD crossunder (MACD line below the signal line).
RSI below 70.
Price is below the 50-period EMA.
ATR-based volatility condition is met.
Trade must occur within the defined session hours.
The strategy calculates dynamic SL and TP levels based on the ATR, ensuring flexibility to market conditions.
Customization Options:
EMA length, RSI length, and MACD parameters.
Risk-Reward Ratio for SL/TP calculations.
Volatility threshold for filtering trades.
Session start and end times for active trading hours.
Recommended Use:
Best suited for scalping gold on lower timeframes (15-min charts).
Disclaimer:
This strategy is intended for educational and backtesting purposes. Past performance is not indicative of future results. Use appropriate risk management and test thoroughly before applying to live trading.

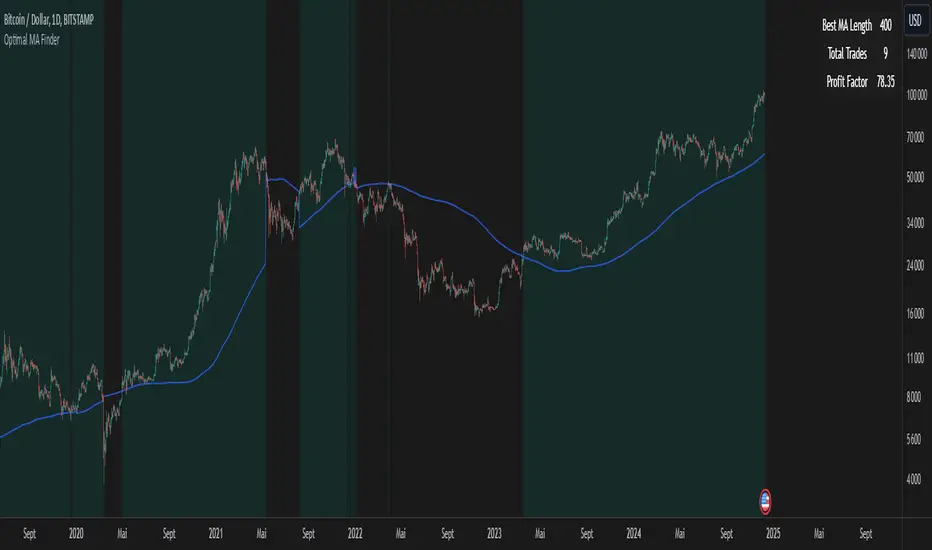
Optimal MA FinderIntroduction to the "Optimal MA Finder" Indicator
The "Optimal MA Finder" is a powerful and versatile tool designed to help traders optimize their moving average strategies. This script combines flexibility, precision, and automation to identify the most effective moving average (MA) length for your trading approach. Whether you're aiming to improve your long-only strategy or implement a buy-and-sell methodology, the "Optimal MA Finder" is your go-to solution for enhanced decision-making.
What Does It Do?
The script evaluates a wide range of moving average lengths, from 10 to 500, to determine which one produces the best results based on historical data. By calculating critical metrics such as the total number of trades and the profit factor for each MA length, it identifies the one that maximizes profitability. It supports both simple moving averages (SMA) and exponential moving averages (EMA), allowing you to tailor the analysis to your preferred method.
The logic works by backtesting each MA length against the price data and assessing the performance under two strategies:
Buy & Sell: Includes both long and short trades.
Long Only: Focuses solely on long positions for more conservative strategies.
Once the optimal MA length is identified, the script overlays it on the chart, highlighting periods when the price crosses over or under the optimal MA, helping traders identify potential entry and exit points.
Why Is It Useful?
This indicator stands out for its ability to automate a task that is often labor-intensive and subjective: finding the best MA length. By providing a clear, data-driven answer, it saves traders countless hours of manual testing while significantly enhancing the accuracy of their strategies. For example, instead of guessing whether a 50-period EMA is more effective than a 200-period SMA, the "Optimal MA Finder" will pinpoint the exact length and type of MA that has historically yielded the best results for your chosen strategy.
Key Benefits:
Precision: Identifies the MA length with the highest profit factor for maximum profitability.
Automation: Conducts thorough backtesting without manual effort.
Flexibility: Adapts to your preferred MA type (SMA or EMA) and trading strategy (Buy & Sell or Long Only).
Real-Time Feedback: Provides actionable insights by plotting the optimal MA directly on your chart and highlighting relevant trading periods.
Example of Use: Imagine you're trading a volatile stock and want to optimize your long-only strategy. By applying the "Optimal MA Finder," you discover that a 120-period EMA results in the highest profit factor. The indicator plots this EMA on your chart, showing you when to consider entering or exiting positions based on price movements relative to the EMA.
In short, the "Optimal MA Finder" empowers traders by delivering data-driven insights and improving the effectiveness of trading strategies. Its clear logic, combined with robust automation, makes it an invaluable tool for both novice and experienced traders seeking consistent results.
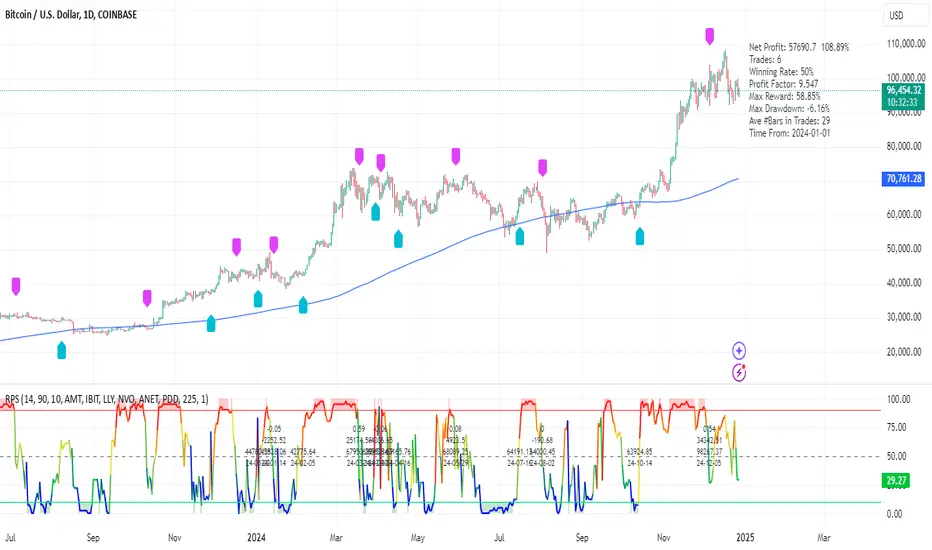
RPS Trading Signals & Backtesting
Overview:
The Enhanced Relative Price Strength (RPS) Indicator is designed for trend traders looking to identify the relative strength of stocks within a select universe. By comparing the price movements of chosen stocks over a specified period, this indicator helps traders make informed decisions about potential buying and selling opportunities.
Key Features:
Relative Strength Ranking: Our RPS indicator ranks the price performance of individual stocks against a curated selection, enabling users to pinpoint which stocks are exhibiting relative strength or weakness.
Customizable Stock Universe: The script evaluates 40 stocks, which include 30 high-weight NDX100 stocks, 4 major index ETFs (SPY, QQQ, DIA, IWM), and allows for the addition of 6 user-defined custom stocks.
Dynamic Color Gradients: The visual representation of the RPS score utilizes a gradient color scheme ranging from purple at low scores to red at high scores, leveraging the color for clear, immediate insight into stock performance.
Threshold Visualization: Users can set specific high (default 85) and low (default 15) thresholds for RPS, highlighted with solid line indicators and area fills. This visual aspect aids traders in quickly spotting entry and exit points.
Trading Signal Generation: The script includes logic for generating buy and sell signals according to defined RPS behaviors relative to the set thresholds, factoring in market conditions based on a long-term moving average.
Backtesting Capabilities: Users can backtest trading signals by inputting desired start and end dates, allowing traders to evaluate the effectiveness of the RPS strategy on historical data for various assets including stocks and cryptocurrencies (e.g., NVDA, LLY, GOOG, BTC, ETH, SOL).
User-Friendly Options: The script allows for adjustments such as moving average lengths, visibility of trading signals, and fills for ease of use and customization according to trading preferences.
How It Works:
The RPS Indicator functions by calculating the performance of stocks relative to each other. Based on the RPS trends, the indicator identifies when to enter or exit trades, providing a framework to capitalize on market movements.
Conclusion:
The Enhanced RPS Indicator aims to empower traders with a powerful analytical tool in their arsenal, tailored to simplify decision-making and bolster trading strategies. As this script evolves, we encourage feedback and collaboration from users to refine and enhance its capabilities further.
Trade Less, Earn More!
Ehlers Combo Strategy🚀 Presenting the Enhanced Ehlers Combo Strategy 🚀
Hello Traders! 👋 I'm thrilled to share the latest version of the Ehlers Combo Strategy v2.0. This powerful algorithm combines Ehlers Elegant Oscillator, Decycler, Instantaneous Trendline, Spearman Rank, and introduces the Signal to Noise Ratio for even more precise trading signals.
📊 Strategy Highlights:
Ehlers Elegant Oscillator: Captures market momentum and turning points.
Ehlers Decycler: Filters out market noise for clearer trend signals.
Instantaneous Trendline: Offers a dynamic view of the market trend.
Spearman Rank: Analyzes market rank correlations for enhanced insights.
Signal to Noise Ratio (SNR): Filters out noise for more accurate signals.
💡 Key Features & Customizations:
Adaptive Length: Enable adaptive length based on the market's current conditions.
SNR Threshold: Set your desired SNR threshold for filtering signals.
Exit Length: Define the length for exit signals.
📈 Trading Signals:
Long Entry: Elegant Oscillator and Decycler cross above 0, source crosses above Decycler, source is greater than an increasing Instantaneous Trendline, Spearman Rank is positive, and SNR exceeds the threshold.
Long Exit: Source crosses below the Instantaneous Trendline after entering a long position.
Short Entry: Elegant Oscillator and Decycler cross below 0, source crosses below Decycler, source is less than a decreasing Instantaneous Trendline, Spearman Rank is negative, and SNR exceeds the threshold.
Short Exit: Source crosses above the Instantaneous Trendline after entering a short position.
📊 Insights & Enhancements:
Dynamic Length: The strategy adapts its length dynamically based on market conditions.
Improved SNR: Signal to Noise Ratio ensures better filtering of signals.
Enhanced Visualization: The Elegant Oscillator now features improved color coding for a clearer interpretation.
🚨 Disclaimer:
Trading involves risk, and this script should be used judiciously. It's not a guaranteed profit machine, but with careful use, it can be a valuable addition to your toolkit.
Feel free to backtest, tweak, and make it your own! Let's conquer the markets together! 💪📈
🚀✨ Happy Trading! ✨🚀
---
🙌 Credits:
A big shoutout to the original contributors:
@blackcat1402
@cheatcountry
@DasanC

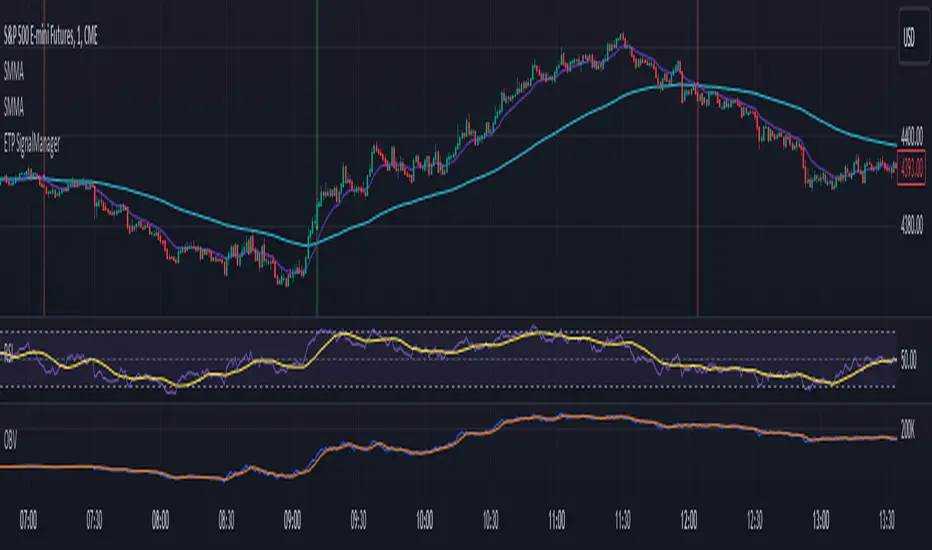
ETP SignalManager🔍 Overview:
This indicator is a trader's tool used to generate long/short signals. These signals are crafted by customizing specific conditions set up by the trader, depending on their trading system.
🔑 Key Features:
Signal Types: Generates both long and short signals.
Custom Conditions: Users can define up to 10 conditions via SignalManager in order to generate a signal.
Comparison: You can establish conditions by:
Comparing two indicators.
Comparing an indicator against a fixed value.
Comparing default sources such as low, high, close, and open – either between two sources or pairing a source with another indicator.
Using relational operators like >, <, >=, <=, crossing above, and crossing below.
Indicator Selection: For the indicators used in conditions, you can choose from any loaded indicator on your chart.
Condition Relationships: Combine up to 10 conditions using AND or OR.
Visual Alerts: These alerts activate when the specific conditions are met. They can be displayed or hidden using the dedicated options in the indicator settings. The options for visual alerts are:
Background coloring and
Chart-shape drawings
💡 Benefits:
Eliminate the need for programming skills.
Ability to backtest trading signals before investing real funds or before commissioning full programming.
Save on costs from hiring external programming services.
🎯 In Summary:
Combine indicators to obtain the desired trading signal and backtest your trading idea without any programming skill or expertise.
📊 Chart Example:
In the chart below, we utilized a combination of four indicators to generate trading signals:
Indicators Used:
Short-term Smoothed Moving Average (SMMA)
Long-term Smoothed Moving Average (SMMA)
Relative Strength Index (RSI)
On-Balance Volume (OBV)
Additional Rule:
The relation between the close of the current bar and the close of the previous bar.
🔧 Signal Manager Configuration:
For a Long Signal:
Short-term SMMA crosses above the long-term SMMA. This indicates a potential bullish trend.
Simultaneously, RSI is below 70. This condition ensures that the market is not overbought, making it suitable for a long trade.
The OBV blue line is above the OBV orange line from 3 bars back. This 3-bar offset accounts for the lag in the orange line, and it confirms increasing buying pressure following the SMMA crossover.
The close of the current bar should be above the close of the previous bar. This rule adds an extra layer of confirmation to the long trade setup.
For a Short Signal:
Short-term SMMA crosses below the long-term SMMA. This suggests a potential bearish trend.
Simultaneously, RSI is above 30. This condition ensures that the market is not oversold, making it suitable for a short trade.
The OBV blue line is below the OBV orange line from 3 bars back. This 3-bar offset accounts for the lag in the orange line and confirms increasing selling pressure following the SMMA crossover.
The close of the current bar should be below the close of the previous bar. This rule adds an extra layer of confirmation to the short trade setup.
🚨 Visual Alerts: As you can see on the chart, both visual alerts are active: background coloring and chart-shape drawing. Whenever the conditions mentioned above are met, the visual alert will appear on the bar that satisfies those conditions. This visual feedback enhances your ability to identify potential trade setups quickly and effectively.
This example illustrates a combination of indicators employed to generate trading signals. However, it's essential to recognize that the possibilities are vast when it comes to using indicators to create trading conditions. You can leverage any indicator you have loaded on your chart to establish criteria for trade signals. The key lies in understanding your selected indicators and crafting a strategy that aligns with your trading objectives and market analysis.
Please make sure to check your TradingView plan to determine the number of different indicators you can load on your chart. Your plan will dictate how many indicators you can effectively combine within the Signal Manager. Understanding your plan's limitations is crucial to optimizing your trading strategy.
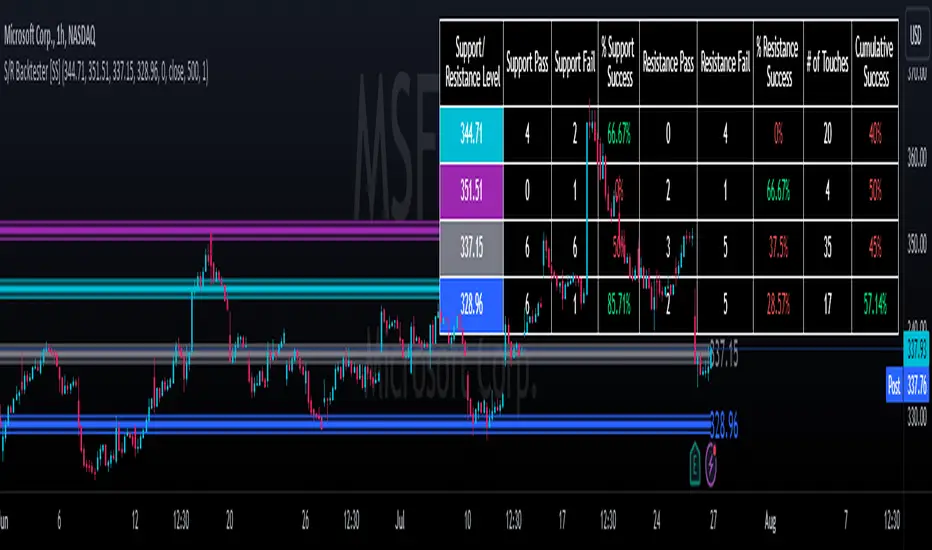
Support and Resistance Backtester [SS]Hey everyone,
Excited to release this indicator I have been working on.
I conceptualized it as an idea a while ago and had to nail down the execution part of it. I think I got it to where I am happy with it, so let me tell you about it!
What it does?
This provides the user with the ability to quantify support and resistance levels. There are plenty of back-test strategies for RSI, stochastics, MFI, any type of technical based indicator. However, in terms of day traders and many swing traders, many of the day traders I know personally do not use or rely on things like RSI, stochastics or MFI. They actually just play the support and resistance levels without attention to anything else. However, there are no tools available to these people who want to, in a way, objectively test their identified support and resistance levels.
For me personally, I use support and resistance levels that are mathematically calculated and I am always curious to see which levels:
a) Have the most touches,
b) Have provided the most support,
c) Have provided the most resistance; and,
d) Are most effective as support/resistance.
And, well, this indicator answers all four of those questions for you! It also attempts to provide some way to support and resistance traders to quantify their levels and back-test the reliability and efficacy of those levels.
How to use:
So this indicator provides a lot of functionality and I think its important to break it down part by part. We can do this as we go over the explanation of how to use it. Here is the step by step guide of how to use it, which will also provide you an opportunity to see the options and functionality.
Step 1: Input your support and resistance levels:
When we open up the settings menu, we will see the section called "Support and Resistance Levels". Here, you have the ability to input up to 5 support and resistance levels. If you have less, no problem, simply leave the S/R level as 0 and the indicator will automatically omit this from the chart and data inclusion.
Step 2: Identify your threshold value:
The threshold parameter extends the range of your support and resistance level by a desired amount. The value you input here should be the value in which you would likely stop out of your position. So, if you are willing to let the stock travel $1 past your support and resistance level, input $1 into this variable. This will extend the range for the assessment and permit the stock to travel +/- your threshold amount before it counts it as a fail or pass.
Step 3: Select your source:
The source will tell the indicator what you want to assess. If you want to assess close, it will look at where the ticker closes in relation to your support and resistance levels. If you want to see how the highs and lows behave around the S/R levels, then change the source to High or Low.
It is recommended to leave at close for optimal results and reliability however.
Step 4: Determine your lookback length:
The lookback length will be the number of candles you want the indicator to lookback to assess the support and resistance level. This is key to get your backtest results.
The recommendation is on timeframes 1 hour or less, to look back 300 candles.
On the daily, 500 candles is recommended.
Step 5: Plot your levels
You will see you have various plot settings available to you. The default settings are to plot your support and resistance levels with labels. This will look as follows:
This will plot your basic support and resistance levels for you, so you do not have to manually plot them.
However, if you want to extend the plotted support and resistance level to visually match your threshold values, you can select the "Plot Threshold Limits" option. This will extend your support and resistance areas to match the designated threshold limits.
In this case on MSFT, I have the threshold limit set at $1. When I select "Plot Threshold Limits", this is the result:
Plotting Passes and Fails:
You will notice at the bottom of the settings menu is an option to plot passes and plot fails. This will identify, via a label overlaid on the chart, where the support and resistance failures and passes resulted. I recommend only selecting one at a time as the screen can get kind of crowded with both on. here is an example on the MSFT chart:
And on the larger timeframe:
The chart
The chart displays all of the results and counts of your support and resistance results. Some things to pay attention to use the chart are:
a) The general success rate as support vs resistance
Rationale: Support levels may act as resistance more often than they do support or vice versa. Let's take a look at MSFT as an example:
The chart above shows the 334.07 level has acted as very strong support. It has been successful as support almost 82% of the time. However, as resistance, it has only been successful 33% of the time. So we could say that 334 is a strong key support level and an area we would be comfortable longing at.
b) The number of touches:
Above you will see the number of touches pointed out by the blue arrow.
Rationale: The number of touches differs from support and resistance. It counts how many times and how frequently a ticker approaches your support and/or resistance area and the duration of time spent in that area. Whereas support and resistance is determined by a candle being either above or below a s/r area, then approaching that area and then either failing or bouncing up/down, the number of touches simply assesses the time spent (in candles) around a support or resistance level. This is key to help you identify if a level has frequent touches/consolidation vs other levels and can help you filter out s/r levels that may not have a lot of touches or are infrequently touched.
Closing comments:
So this is pretty much the indicator in a nutshell. Hopefully you find it helpful and useful and enjoy it.
As always let me know your questions/comments and suggestions below.
As always I appreciate all of you who check out, try out and read about my indicators and ideas. I wish you all the safest trades and good luck!
Grid Spot Trading Algorithm V2 - The Quant ScienceGrid Spot Trading Algorithm V2 is the last grid trading algorithm made by our developer team.
Grid Spot Trading Algorithm V2 is a fixed 10-level grid trading algorithm. The grid is divided into an accumulation area (red) and a selling area (green).
In the accumulation area, the algorithm will place new buy orders, selling the long positions on the top of the grid.
BUYING AND SELLING LOGIC
The algorithm places up to 5 limit orders on the accumulation section of the grid, each time the price cross through the middle grid. Each single order uses 20% of the equity.
Positions are closed at the top of the grid by default, with the algorithm closing all orders at the first sell level. The exit level can be adjusted using the user interface, from the first level up to the fifth level above.
CONFIGURING THE ALGORITHM
1) Add it to the chart: Add the script to the current chart that you want to analyze.
2) Select the top of the grid: Confirm a price level with the mouse on which to fix the top of the grid.
3) Select the bottom of the grid: Confirm a price level with the mouse on which to fix the bottom of the grid.
4) Wait for the automatic creation of the grid.
USING THE ALGORITHM
Once the grid configuration process is completed, the algorithm will generate automatic backtesting.
You can add a stop loss that destroys the grid by setting the destruction price and activating the feature from the user interface. When the stop loss is activated, you can view it on the chart.

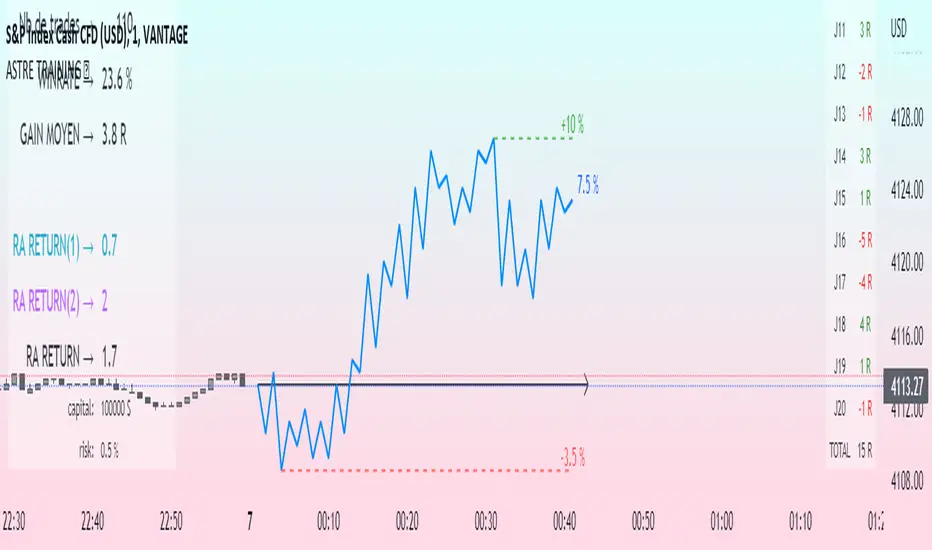
Challenge training (journal)Dynamic trading journal with equity curve display. Detailed results with prop firm objectives, editable, $/month estimation, possibility to compare two strategies.
one line in parameter = one trading day. 20 days max.
For each trading day, specify : The number of trades, the number of SL, the number of total winning RR.
A table at the bottom right summarizes the days and performances during the backtest in order to have an idea of the current performance.
The bottom left table summarizes the overall performance with some key information.
Depending on the number of days traded, a monthly "salary" is deducted, taking into account the prop firm commission.
there is the possibility to define a "Type" for each trading day, 1 or 2. It allows to compare in a binary way, example for type 1: when the high time frame structure is doing well and I am confident for scalping, otherwise type 2.
Again: type 1: SL shorter by 50%, type 2: normal SL etc..
the button "separate 1 and 2" allows to display two additional equity curves : type 1 and type 2. It allows to have a quick visual comparison on the impact of our parameter studied in our backtest on our performance. at the scale of the main equity curve
All the conditions to succeed in the challenge are adjustable in the parameters. The drawdown calculation has been simplified - in order not to have to put 80 trades in the parameters window, I have gathered them by "day", and pessimistically, we consider first the stoplosses and then the take profits, simplifying the performances of the day into "one losing trade" and "one winning trade" (graphically). It is a good compromise between quantity and quality.
Use "A random day trading" indicator to spice up your training.
I hope this will be useful for you to track your performance !
Rocket Grid Algorithm - The Quant ScienceThe Rocket Grid Algorithm is a trading strategy that enables traders to engage in both long and short selling strategies. The script allows traders to backtest their strategies with a date range of their choice, in addition to selecting the desired strategy - either SMA Based Crossunder or SMA Based Crossover.
The script is a combination of trend following and short-term mean reversing strategies. Trend following involves identifying the current market trend and riding it for as long as possible until it changes direction. This type of strategy can be used over a medium- to long-term time horizon, typically several months to a few years.
Short-term mean reversing, on the other hand, involves taking advantage of short-term price movements that deviate from the average price. This type of strategy is usually applied over a much shorter time horizon, such as a few days to a few weeks. By rapidly entering and exiting positions, the strategy seeks to capture small, quick gains in volatile market conditions.
Overall, the script blends the best of both worlds by combining the long-term stability of trend following with the quick gains of short-term mean reversing, allowing traders to potentially benefit from both short-term and long-term market trends.
Traders can configure the start and end dates, months, and years, and choose the length of the data they want to work with. Additionally, they can set the percentage grid and the upper and lower destroyers to manage their trades effectively. The script also calculates the Simple Moving Average of the chosen data length and plots it on the chart.
The trigger for entering a trade is defined as a crossunder or crossover of the close price with the Simple Moving Average. Once the trigger is activated, the script calculates the total percentage of the side and creates a grid range. The grid range is then divided into ten equal parts, with each part representing a unique grid level. The script keeps track of each grid level, and once the close price reaches the grid level, it opens a trade in the specified direction.
The equity management strategy in the script involves a dynamic allocation of equity to each trade. The first order placed uses 10% of the available equity, while each subsequent order uses 1% less of the available equity. This results in the allocation of 9% for the second order, 8% for the third order, and so on, until a maximum of 10 open trades. This approach allows for risk management and can help to limit potential losses.
Overall, the Rocket Grid Algorithm is a flexible and powerful trading strategy that can be customized to meet the specific needs of individual traders. Its user-friendly interface and robust backtesting capabilities make it an excellent tool for traders looking to enhance their trading experience.

X48 - Strategy | MA Type Cross + TPSL | Future&Spot | V.2Thank You For Open Source Code, This Strategy Ref. By 1.Simple Strategy Like MA Crossover For Long/Short or Spot Trade, 2. CDC Action Zone V.2 for BarPaint
This Strategy Mixing With MA Crossover Strategy and BarPaint By CDC Action Zone and TP/SL by Varbara
### How To Use Strategy : Setting EMA/SMA Crossover EMA/SMA, Any Value If You Want
For Long Position : Cross Up
For Short Position : Cross Down
Can Use With Spot Trade : Cross Up = Buy, Cross Down = Sell
TP/SL When Your OrderSize Change From any % Of Your TP/SL Value
### In Strategy Setting
Intitial Capital = Ex. 200
Order Size = Should Be Money Management Not Use 100% of Capital Ex. 10% of Capital (200$) = Order Size 20$
StopLoss and Take Profit = If You Run Trend TF 4H+ or 1D+ You Can Change TP% = 1,000% for nonlimit and Stop Loss 5 - 20% from your order size
Ex. Stoploss 15% = OrderSize / 100 x %SL = 20$/100 x 15% = 3$ Loss from order size 20$ (if you not set stop loss.)
Base Currency = (Your Currency) # Ex. USD
Commission = (Your Trading Fee) # Ex. Future Fee Can Check At Binance Fee Rate > www.binance.com > Choose Your Fee Type, Ex. USD M Future (Regular User) = 0.02 (Maker), 0.04 (Taker)
Commission Symbol Type = % # (Ref. By Binance Fee Rate)
### Notice ####
Default Setting It's Realistic From Normal Life Ex. Capital 200$ / Ordersize 20$ (10%)/ Commission 0.1% (Buy+Sell) / Slippage = 2 / TP = 1000% (nonlimit) / SL = 15%/OrderSize
Low Risk But High Return, Good Luck
### Bot Auto Trade by X4815162342 ###
if you wanna try my bot auto trade X48-3in1-bot : Contact My Line ID : x4815x
Full Command Alert For This Strategy If You Wanna See It's
'{"ex":"'+markettype+'","side": "'+longcommand+'", "amount": "@{{strategy.order.contracts}}", "symbol": "{{ticker}}", "passphrase": "'+passphrase+'","leverage":"'+str.tostring(leveragex)+'"}'
'{"ex":"'+markettype+'","side": "'+shortcommand+'", "amount": "@{{strategy.order.contracts}}", "symbol": "{{ticker}}", "passphrase": "'+passphrase+'","leverage":"'+str.tostring(leveragex)+'"}'
But Easy Than Full Command Just Use Thisssssss !! Strategy Be Manage Auto Long and Short or TPSL Position
You Don't Do Anything Just Use This Message to Alerts Message
{{strategy.order.alert_message}}
### If you don't use bot but just looking for strategy test ####
Just Pass Bot Setting Function It's Nothing Effect For Strategy !!!!!!
Let's Enjoy With Your Strategy BackTest 😁
Remember Beware Max drawdown%. I'm Recommend Lower Than 10% It's Very Good.

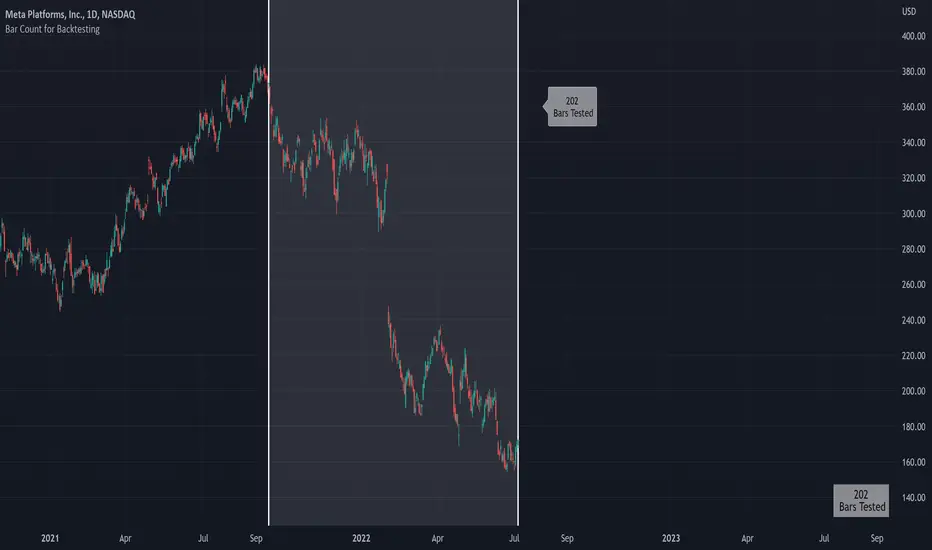
Bar Count for BacktestingHello!
Not much special about this script; you can use date & time, or bar count, to ascertain the number of bars in a time period for backtesting.
This script can be used in conjunction with large scripts incorporating complex intricacies that won't load on 20,000+ bar data sets.
If your script's load time transcends the TV allotted load time - use this script to quickly determine the number of bars in the data set.
Through trial & error you should be able to determine the approximate number of bars your script can execute on without exceeding the imposed time limit!
The image above shows a user-defined time window and, consequently, the script returns the number of bars that constitute the time period.
You can drag the white vertical lines to efficiently configure the calculated time period.
The image above shows functionality for the "Bars Back" feature.
Enjoy!

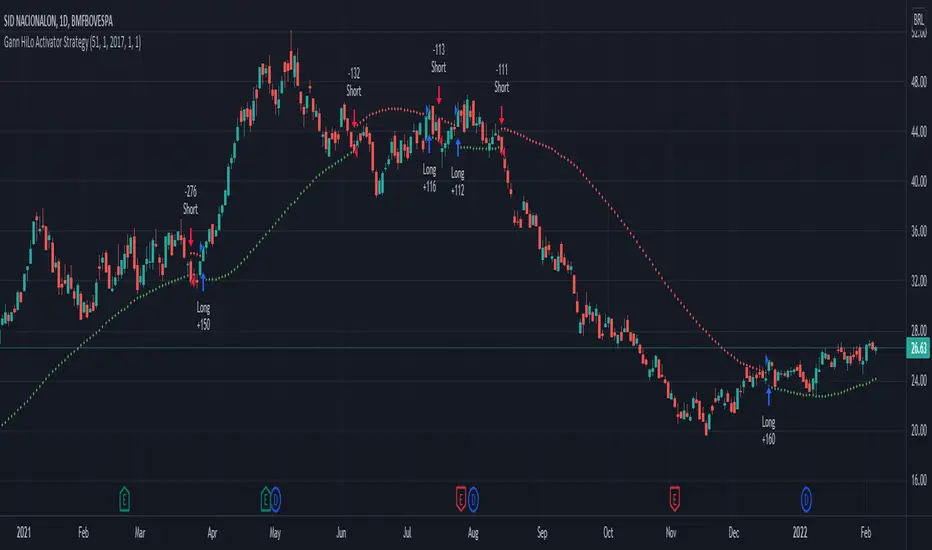
Gann HiLo Activator Strategy█ OVERVIEW
Strategy based on the Gann Hilo Activator . This is a trend following strategy, which means it will go long (and close the previous short position) once the price closes above the high SMA, and go short (and close the previous long position) once the price closes below the low SMA.
█ PARAMETERS
- Length
- Displace (or offset): default is 1
- Begin from start: strategy will run since the beggining
- From year, month, day: Choose an specific date to start backtesting (must disable the parameter above to work)
█ HOW TO USE
After choosing the start date to run the strategy, you can change the length field and look at the backtest results to find the most optimal settings for the current symbol.
This strategy was tested on the stock and crypto market with good results. Hope you enjoy!
action zone - ATR stop reverse order strategy v0.1 by 9nckACTION ZONE-ATR MOD v0.1 DOCUMENTATION
Overview
This tradingview pine script strategy is mainly created to enrich my coding skill. It is a combination of “CDC-ACTIONZONE” and my personal studies of trading techniques in various sources e.g.book, course or blog. This strategy purposefully built to connect with my automatic trading bot. However, It will be very useful to aid your trading routine by diminishing mental distraction which possibly leads to bad trades.
How does it work?
This strategy will do a basic simple thing that most traders do by creating entry signals on both sides long/short and also set the stop loss. Furthermore, It will also reverse the order (from long to short and vice versa (if long/short conditions are met). Finally, it will recalculate the stop loss/take profit price in every complete bar to increase the chance of winning and limit our loss.
Entry rules(Long/Short)
If you have no open order, an order will be created when a fast EMA crosses(up(long)/down(short) the slow EMA(It’s as simple as that).
If you have an open order, the current order will be (sold if long, covered if short) and the opposite side order will be created.
Exit and Reverse rules(Long/Short)
If fast EMA cross (DOWN(long), UP(short)), the current order will be closed, THE OPPOSITE SIDE ORDER WILL ALSO BE CREATED.
Risk management
FLEX STOP PRICE : initial value will be set at the bar which order created. It is a fast ema (+/-) MIDDLE ATR value.
If MIDDLE ATR value rises, it will be our new stop price.
If MIDDLE ATR value falls, stop price unchanged
If Price OVERBOUGHT(long)/SOLD(short), LOW of that bar will be a new stop price.
Minimum position hold period
In order to eliminate risk of repeatedly open, close orders in sideway trends. Minimum hold period must be passed to start exit our position. However, It always respects stop loss prices. The value refers to the number of bars.
MUST READ!!!
This strategy uses only MARKET ORDER. If you trade with a bot, make sure you choose only enormous market cap tokens.
This strategy is bi-direction strategy. It will work best in the DERIVATIVE market.
It was initially designed to compete in the cryptocurrency market which has very high volume and volatility.
I only use this strategy in 1HR (acceptable change rate, optimum trade frequency)
How (should) we use it?
Choose crypto future pairs (recommend only top 10-15 market volume pairs in Binance, let’s say 1000M+ trade value)
Choose your time frame (1H is strongly recommended)
Setup your portfolio profile (Setting->Properties) such as Initial cap, order size, commission. DO NOT USE CAL ON EVERY TICK IT WILL CAUSE REPAINTING AND YOUR CAPITAL IS BLEEDING !!!
BACKTEST FIRST!! Back test is a combination of art, math and statis(and a bit of luck). You can apply to train and test methods or whatever you are familiar with. In my opinion, your test period should include UPTREND, SIDEWAY, DOWNTREND. Fine tune fast, slow ema first(my best ema length of 1H timeframe around 7-10, 17-22). Try to eliminate fault breakout trade and use other options only necessary. Hopefully we can use automatic optimization on Pine Script soon.
Don’t forget to turn off using a specific backtest date option to start your strategy.A
THIS IS NOT A PERFECT (OR EVEN PROFITABLE) STRATEGY. USE AT YOUR OWN RISK AND TRADE RESPONSIBLY. DYOR DUDE.

200DMA last DOM - ajhImplements and backtests a simple 200 day moving average trend following rules based on last day of month to limits trades to 12 per year.
From the book : 5 BEST Moving Average Strategies (That beat buy and hold) by Steve Burns and Holly Burns
Click on the cog to set the input date range eg; 2000-01-01 to 2016-12-31
The book back tested SP500 returns from 2000-2016 317% using this method vs 125% buy and hold only with less drawdown.
Simple 200 day moving average test and trading on last day of month.
(you may find it trades on next available day close to end of month as not all dates can be traded weekends etc..)
Rules are ;
1. if last day of month and stock over 200 day moving average, then go long 100%
2. if last day of month and stock under 200 day moving average, then close long 100% and goto cash.
Aims to miss market declines and keep you long for upside.
Note: Have found doesn't work well in choppy markets moving sideways like the FTSE100 for same period 2000-2016 and causes losses. Also for many stocks.
