Combo Backtest 123 Reversal & Chande Forecast Oscillator This is combo strategies for get a cumulative signal.
First strategy
This System was created from the Book "How I Tripled My Money In The
Futures Market" by Ulf Jensen, Page 183. This is reverse type of strategies.
The strategy buys at market, if close price is higher than the previous close
during 2 days and the meaning of 9-days Stochastic Slow Oscillator is lower than 50.
The strategy sells at market, if close price is lower than the previous close price
during 2 days and the meaning of 9-days Stochastic Fast Oscillator is higher than 50.
Second strategy
The Chande Forecast Oscillator developed by Tushar Chande The Forecast
Oscillator plots the percentage difference between the closing price and
the n-period linear regression forecasted price. The oscillator is above
zero when the forecast price is greater than the closing price and less
than zero if it is below.
WARNING:
- For purpose educate only
- This script to change bars colors.
חפש סקריפטים עבור "backtest"
Combo Backtest 123 Reversal & Chaikin Volatility This is combo strategies for get a cumulative signal.
First strategy
This System was created from the Book "How I Tripled My Money In The
Futures Market" by Ulf Jensen, Page 183. This is reverse type of strategies.
The strategy buys at market, if close price is higher than the previous close
during 2 days and the meaning of 9-days Stochastic Slow Oscillator is lower than 50.
The strategy sells at market, if close price is lower than the previous close price
during 2 days and the meaning of 9-days Stochastic Fast Oscillator is higher than 50.
Second strategy
Chaikin's Volatility indicator compares the spread between a security's
high and low prices. It quantifies volatility as a widening of the range
between the high and the low price.
You can use in the xPrice1 and xPrice2 any series: Open, High, Low, Close, HL2,
HLC3, OHLC4 and ect...
WARNING:
- For purpose educate only
- This script to change bars colors.

Combo Backtest 123 Reversal & Center Of Gravity This is combo strategies for get a cumulative signal.
First strategy
This System was created from the Book "How I Tripled My Money In The
Futures Market" by Ulf Jensen, Page 183. This is reverse type of strategies.
The strategy buys at market, if close price is higher than the previous close
during 2 days and the meaning of 9-days Stochastic Slow Oscillator is lower than 50.
The strategy sells at market, if close price is lower than the previous close price
during 2 days and the meaning of 9-days Stochastic Fast Oscillator is higher than 50.
Second strategy
The indicator is based on moving averages. On the basis of these, the
"center" of the price is calculated, and price channels are also constructed,
which act as corridors for the asset quotations.
WARNING:
- For purpose educate only
- This script to change bars colors.
Combo Backtest 123 Reversal & Bull Power This is combo strategies for get a cumulative signal.
First strategy
This System was created from the Book "How I Tripled My Money In The
Futures Market" by Ulf Jensen, Page 183. This is reverse type of strategies.
The strategy buys at market, if close price is higher than the previous close
during 2 days and the meaning of 9-days Stochastic Slow Oscillator is lower than 50.
The strategy sells at market, if close price is lower than the previous close price
during 2 days and the meaning of 9-days Stochastic Fast Oscillator is higher than 50.
Second strategy
Bull Power Indicator
To get more information please see "Bull And Bear Balance Indicator"
by Vadim Gimelfarb.
WARNING:
- For purpose educate only
- This script to change bars colors.

Combo Backtest 123 Reversal & Breakout Range Long This is combo strategies for get a cumulative signal.
First strategy
This System was created from the Book "How I Tripled My Money In The
Futures Market" by Ulf Jensen, Page 183. This is reverse type of strategies.
The strategy buys at market, if close price is higher than the previous close
during 2 days and the meaning of 9-days Stochastic Slow Oscillator is lower than 50.
The strategy sells at market, if close price is lower than the previous close price
during 2 days and the meaning of 9-days Stochastic Fast Oscillator is higher than 50.
Second strategy
Breakout Range Long Strategy
WARNING:
- For purpose educate only
- This script to change bars colors.

Quad Moving Avgerages BackTestHello Fellow Traders!
-------------------------------------------
This is the newest addition to Gnome Alerts PRO!
Trade Moving Average Breakouts with Minimal Drawdon.
This Bot Script works on all Crypto, Leverage, Forex, & Traditional Exchanges.
FEATURES
------------------------
*Autoview Ready*
- Easy to Use
- Backtesting Included
-Take Profit
- Stop Loss
You can get access to any of my scripts by visiting my Website, link is in Tradingview Bio ... Just click on the Gnome!

Combo Backtest 123 Reversal & Bill Williams Averages. 3Lines This is combo strategies for get
a cumulative signal. Result signal will return 1 if two strategies
is long, -1 if all strategies is short and 0 if signals of strategies is not equal.
First strategy
This System was created from the Book "How I Tripled My Money In The
Futures Market" by Ulf Jensen, Page 183. This is reverse type of strategies.
The strategy buys at market, if close price is higher than the previous close
during 2 days and the meaning of 9-days Stochastic Slow Oscillator is lower than 50.
The strategy sells at market, if close price is lower than the previous close price
during 2 days and the meaning of 9-days Stochastic Fast Oscillator is higher than 50.
Second strategy
This indicator calculates 3 Moving Averages for default values of
13, 8 and 5 days, with displacement 8, 5 and 3 days: Median Price (High+Low/2).
The most popular method of interpreting a moving average is to compare
the relationship between a moving average of the security's price with
the security's price itself (or between several moving averages).
WARNING:
- For purpose educate only
- This script to change bars colors.

Three Line Break Backtest This is a modified version of the three line break price representation.
It is composed with 2 lines made of Close price values forming a “cloud”.
If the trend is bullish and the price breach the lower level of the green
cloud, a new bearish trend is taking place.
If the current trend is bearish and the price breakout the upper band of
the cloud, a new bullish trend is forming.
This is a “price action” indicator, signals may be filtered by long term trend
analysis with other indicators such as Supertrend for instance.
WARNING:
- For purpose educate only
- This script to change bars colors.

Combo Backtest 123 Reversal & Bear Power This is combo strategies for get
a cumulative signal. Result signal will return 1 if two strategies
is long, -1 if all strategies is short and 0 if signals of strategies is not equal.
First strategy
This System was created from the Book "How I Tripled My Money In The
Futures Market" by Ulf Jensen, Page 183. This is reverse type of strategies.
The strategy buys at market, if close price is higher than the previous close
during 2 days and the meaning of 9-days Stochastic Slow Oscillator is lower than 50.
The strategy sells at market, if close price is lower than the previous close price
during 2 days and the meaning of 9-days Stochastic Fast Oscillator is higher than 50.
Second strategy
Bear Power Indicator
To get more information please see "Bull And Bear Balance Indicator"
by Vadim Gimelfarb.
WARNING:
- For purpose educate only
- This script to change bars colors.

Combo Backtest 123 Reversal & (H-L)/C Histogram This is combo strategies for get
a cumulative signal. Result signal will return 1 if two strategies
is long, -1 if all strategies is short and 0 if signals of strategies is not equal.
First strategy
This System was created from the Book "How I Tripled My Money In The
Futures Market" by Ulf Jensen, Page 183. This is reverse type of strategies.
The strategy buys at market, if close price is higher than the previous close
during 2 days and the meaning of 9-days Stochastic Slow Oscillator is lower than 50.
The strategy sells at market, if close price is lower than the previous close price
during 2 days and the meaning of 9-days Stochastic Fast Oscillator is higher than 50.
Second strategy
This histogram displays (high-low)/close
Can be applied to any time frame.
WARNING:
- For purpose educate only
- This script to change bars colors.

Combo Backtest 123 Reversal & Bandpass FilterThis is combo strategies for get
a cumulative signal. Result signal will return 1 if two strategies
is long, -1 if all strategies is short and 0 if signals of strategies is not equal.
First strategy
This System was created from the Book "How I Tripled My Money In The
Futures Market" by Ulf Jensen, Page 183. This is reverse type of strategies.
The strategy buys at market, if close price is higher than the previous close
during 2 days and the meaning of 9-days Stochastic Slow Oscillator is lower than 50.
The strategy sells at market, if close price is lower than the previous close price
during 2 days and the meaning of 9-days Stochastic Fast Oscillator is higher than 50.
Second strategy
The related article is copyrighted material from
Stocks & Commodities Mar 2010
You can use in the xPrice any series: Open, High, Low, Close, HL2, HLC3, OHLC4 and ect...
WARNING:
- For purpose educate only
- This script to change bars colors.

Combo Backtest 123 Reversal & Average True Range Trailing Stops This is combo strategies for get
a cumulative signal. Result signal will return 1 if two strategies
is long, -1 if all strategies is short and 0 if signals of strategies is not equal.
First strategy
This System was created from the Book "How I Tripled My Money In The
Futures Market" by Ulf Jensen, Page 183. This is reverse type of strategies.
The strategy buys at market, if close price is higher than the previous close
during 2 days and the meaning of 9-days Stochastic Slow Oscillator is lower than 50.
The strategy sells at market, if close price is lower than the previous close price
during 2 days and the meaning of 9-days Stochastic Fast Oscillator is higher than 50.
Secon strategy
Average True Range Trailing Stops Strategy, by Sylvain Vervoort
The related article is copyrighted material from Stocks & Commodities Jun 2009
WARNING:
- For purpose educate only
- This script to change bars colors.

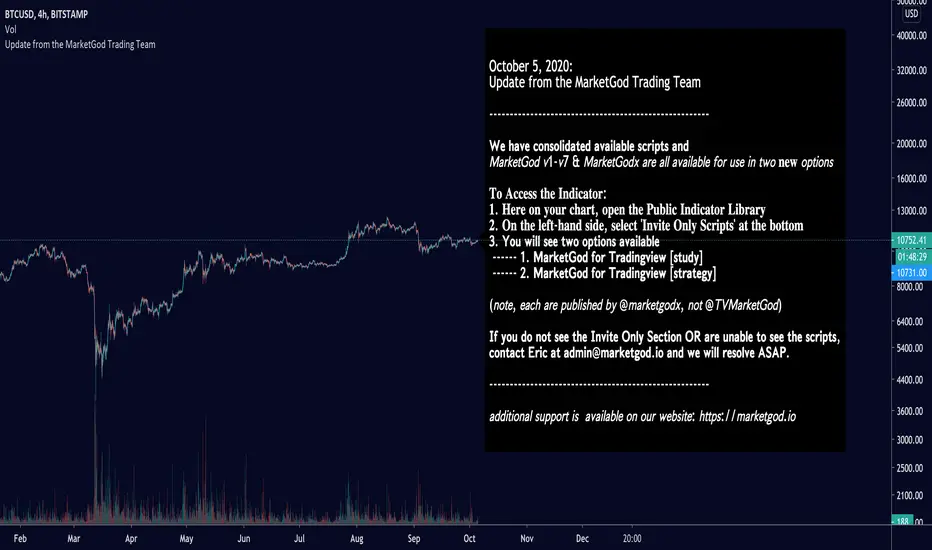
MarketGodv6 Pro//BackTest Strategy//The Backtesting Trader to our Signature MGv6. The results in the table below suggest if one was to start with $1k, and trade with the parameters we've established, the trader would succeed on this timeframe > 70% of the attempted trades, and have a 7x profit factor with their investment for the duration shown here.
You can read about the strategy within the next few days at our website,
marketgod.io
Combo Backtest 123 Reversal and ADXR This is combo strategies for get
a cumulative signal. Result signal will return 1 if two strategies
is long, -1 if all strategies is short and 0 if signals of strategies is not equal.
First strategy
This System was created from the Book "How I Tripled My Money In The
Futures Market" by Ulf Jensen, Page 183. This is reverse type of strategies.
The strategy buys at market, if close price is higher than the previous close
during 2 days and the meaning of 9-days Stochastic Slow Oscillator is lower than 50.
The strategy sells at market, if close price is lower than the previous close price
during 2 days and the meaning of 9-days Stochastic Fast Oscillator is higher than 50.
Secon strategy
The Average Directional Movement Index Rating (ADXR) measures the strength
of the Average Directional Movement Index (ADX). It's calculated by taking
the average of the current ADX and the ADX from one time period before
(time periods can vary, but the most typical period used is 14 days).
Like the ADX, the ADXR ranges from values of 0 to 100 and reflects strengthening
and weakening trends. However, because it represents an average of ADX, values
don't fluctuate as dramatically and some analysts believe the indicator helps
better display trends in volatile markets.
WARNING:
- For purpose educate only
- This script to change bars colors.

Combo Backtest 123 Reversal and Accelerator Oscillator (AC) This is combo strategies for get
a cumulative signal. Result signal will return 1 if two strategies
is long, -1 if all strategies is short and 0 if signals of strategies is not equal.
First strategy
This System was created from the Book "How I Tripled My Money In The
Futures Market" by Ulf Jensen, Page 183. This is reverse type of strategies.
The strategy buys at market, if close price is higher than the previous close
during 2 days and the meaning of 9-days Stochastic Slow Oscillator is lower than 50.
The strategy sells at market, if close price is lower than the previous close price
during 2 days and the meaning of 9-days Stochastic Fast Oscillator is higher than 50.
Second strategy
The Accelerator Oscillator has been developed by Bill Williams
as the development of the Awesome Oscillator. It represents the
difference between the Awesome Oscillator and the 5-period moving
average, and as such it shows the speed of change of the Awesome
Oscillator, which can be useful to find trend reversals before the
Awesome Oscillator does.
WARNING:
- For purpose educate only
- This script to change bars colors.

Combo Backtest 123 Reversal and Absolute Price Oscillator (APO) This is combo strategies for get
a cumulative signal. Result signal will return 1 if two strategies
is long, -1 if all strategies is short and 0 if signals of strategies is not equal.
First strategy
This System was created from the Book "How I Tripled My Money In The
Futures Market" by Ulf Jensen, Page 183. This is reverse type of strategies.
The strategy buys at market, if close price is higher than the previous close
during 2 days and the meaning of 9-days Stochastic Slow Oscillator is lower than 50.
The strategy sells at market, if close price is lower than the previous close price
during 2 days and the meaning of 9-days Stochastic Fast Oscillator is higher than 50.
Secon strategy
The Absolute Price Oscillator displays the difference between two exponential
moving averages of a security's price and is expressed as an absolute value.
How this indicator works
APO crossing above zero is considered bullish, while crossing below zero is bearish.
A positive indicator value indicates an upward movement, while negative readings
signal a downward trend.
Divergences form when a new high or low in price is not confirmed by the Absolute Price
Oscillator (APO). A bullish divergence forms when price make a lower low, but the APO
forms a higher low. This indicates less downward momentum that could foreshadow a bullish
reversal. A bearish divergence forms when price makes a higher high, but the APO forms a
lower high. This shows less upward momentum that could foreshadow a bearish reversal.
WARNING:
- For purpose educate only
- This script to change bars colors.

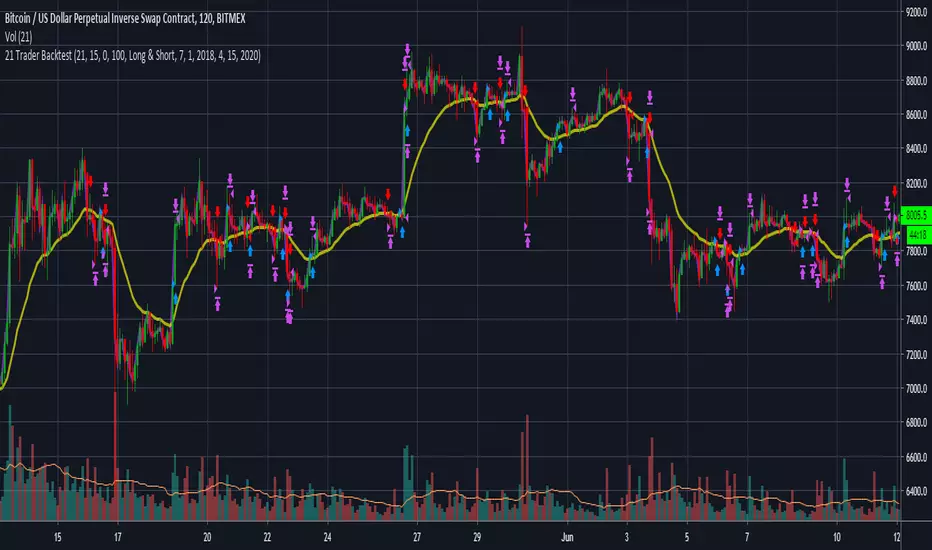
21 Trader BacktestHello Fellow Traders!
-------------------------------------------
This is the newest addition to Gnome Alerts PRO!
Trade Moving Average Breakouts with Minimal Drawdon.
This Bot Script works on all Crypto, Leverage, Forex, & Traditional Exchanges.
FEATURES
------------------------
*Autoview Ready*
- Easy to Use
- Backtesting Included
-Take Profit
- Stop Loss
Combo Backtest 123 Reversal and 2/20 EMA This is combo strategies for get
a cumulative signal. Result signal will return 1 if two strategies
is long, -1 if all strategies is short and 0 if signals of strategies is not equal.
First strategy
This System was created from the Book "How I Tripled My Money In The
Futures Market" by Ulf Jensen, Page 183. This is reverse type of strategies.
The strategy buys at market, if close price is higher than the previous close
during 2 days and the meaning of 9-days Stochastic Slow Oscillator is lower than 50.
The strategy sells at market, if close price is lower than the previous close price
during 2 days and the meaning of 9-days Stochastic Fast Oscillator is higher than 50.
Secon strategy
This indicator plots 2/20 exponential moving average. For the Mov
Avg X 2/20 Indicator, the EMA bar will be painted when the Alert criteria is met.
Please, use it only for learning or paper trading. Do not for real trading.
WARNING:
- For purpose educate only
- This script to change bars colors.

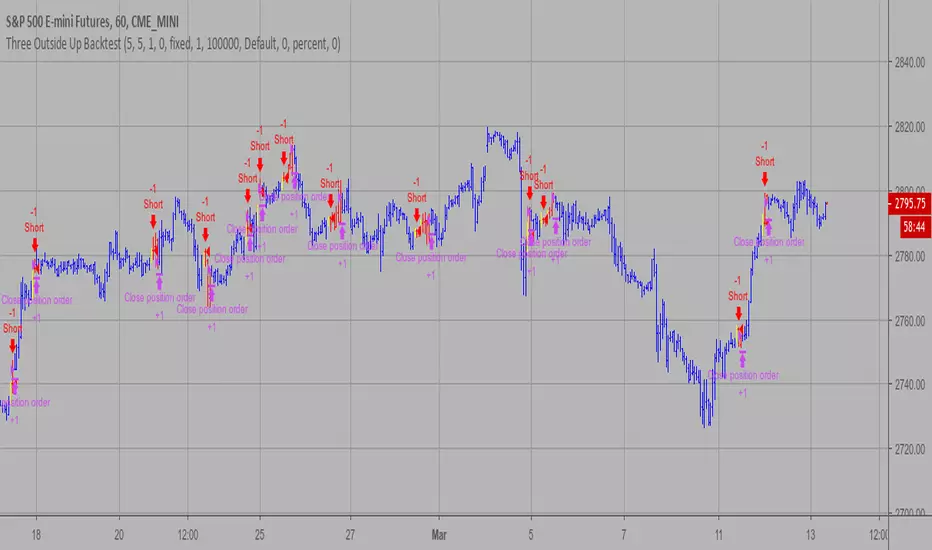
Three Outside Up Backtest This is a three candlestick bullish reversal pattern consisting of a bullish
engulfing pattern formed by the first two candlesticks then followed by an up
candlestick with a higher close than the prior candlestick.
WARNING:
- For purpose educate only
- This script to change bars colors.
SKEW PRO BacktestHello Fellow Traders!
-------------------------------------------
This is the newest addition to Gnome Alerts PRO!
This Bot Script works on all Crypto, Leverage, Forex, & Traditional Exchanges.
FEATURES
------------------------
*Autoview Ready*
- Easy to Use
- Backtesting Included
- Stop Loss
More info on how gain access in my profile!

Sequential Pro BacktestHello Fellow Traders!
-------------------------------------------
This is the newest addition to Gnome Alerts PRO!
This Bot Script works on all Crypto, Leverage, Forex, & Traditional Exchanges.
FEATURES
------------------------
*Autoview Ready*
- Easy to Use
- Backtesting Included
- Stop Loss
More info on how gain access in my profile!

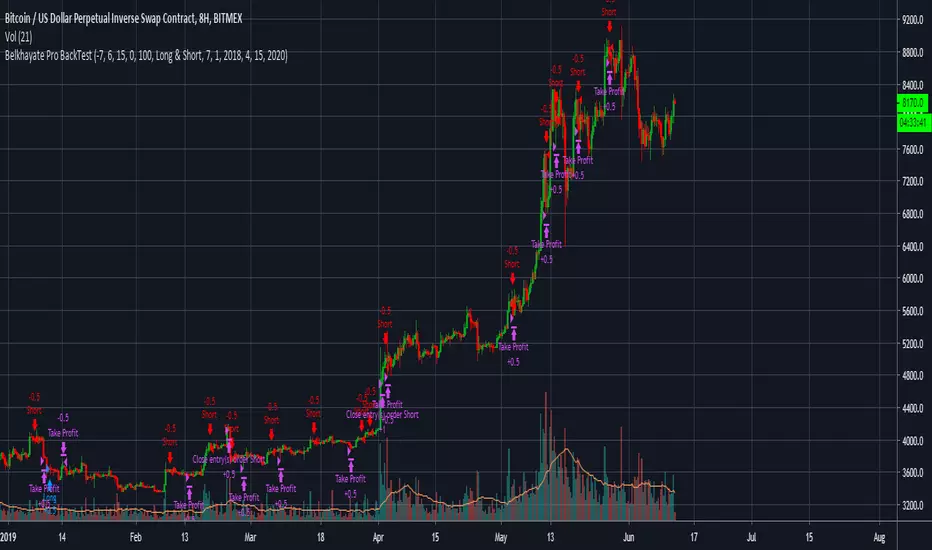
Belkhayate Pro BackTestHello Fellow Traders!
-------------------------------------------
This is the newest addition to Gnome Alerts PRO!
This Bot Script works on all Crypto, Leverage, Forex, & Traditional Exchanges.
FEATURES
------------------------
*Autoview Ready*
- Easy to Use
- Backtesting Included |
-Take Profit
- Stop Loss
Learn more by visiting my bio.
RSI-ATR Divine Strategy (Backtesting)Live, non-repainting strategy using ATR and RSI mixed together to multiple types of long and short positions.
- Features -
Live entry direction with trade warnings and alerts
Live trade building buy and sell stops (for buy/sell stop limits)
Entry location icons as well as pyramid entries (to add to existing position)
2 separate targets based on the ATR setting and entry location
1 scalp target based on the ATR setting and entry location
2 separate trailing stops, 1 for "absolute stop" and 1 for "scalp trades"
Alert conditions for every update and condition change of the strategy (Provided by indicator study )
4 pre-built color themes, including candlestick coloring
This strategy is best used with my RSI Shaded Indicator using the identical RSI settings.
The linked script is identical and used solely for alerts, because Trading View still after 3 years of requesting does not provide the ability to use alert conditions inside a strategy script, only an indicator script. This strategy should be used to backtest your settings.
The approach to this strategy uses several parallel trades of different types. In order to generate multiple trade types the "pyramid trades" setting of the strategy (second tab of the settings that lets you adjust the number of pyramid contracts) should be used.
- Trade Types -
Swing: This trade is entered on the solid arrows after the RSI has become oversold or overbought. It is key that all trades wait for some degree of pullback before entering, even after the trend flips between positive and negative. This trade is held until stopped out or an opposite trade is triggered that reverses the position.
Target: These trades are entered at both the initial swing trade, or any subsequent pyramid/greedy trades that present themselves along the way while the trend remains in the same direction. The difference between these trades and the swing trade is that they have targets calculated as: Target = +/- * ATR. Until the target price is reached it does not change. When exceeded the next target trade will have a new target price.
Scalp: These trades have a limit buy/sell entry and a target. The target is very similar to the ATR Multiplier calculation for Target trades, but uses the instead.
Turning on/off the different trade types (strategy only) is simple done by decreasing the number of contracts used for that trade type to zero. When the quantity is set to zero, that trade is not considered.
- Session -
The session filter is used to narrow trade executions by only allowing trades that are inside the session boundaries. This can be used to isolate the London or New York session for example. The default is 24 x 7 which filters no trades (Trading View has a bug when resetting this, so simply reset the indicator to get it back to 24x7).
All feature requests or bug reports are welcome either by direct messaging or comments on this page or the linked indicator page.
Please PM for access. Cheers.
