iMoku (Ichimoku Complete Tool) - The Quant Science iMoku™ is a professional all-in-one solution for the famous Ichimoku Kinko Hyo indicator.
The algorithm includes:
1. Backtesting spot
2. Visual tool
3. Auto-trading functions
With iMoku you can test four different strategies.
Strategy 1: Cross Tenkan Sen - Kijun Sen
A long position is opened with 100% of the invested capital ($1000) when "Tenkan Sen" crossover "Kijun Sen".
Closing the long position on the opposite condition.
There are 3 different strength signals for this strategy: weak, normal, strong.
Weak : the signal is weak when the condition is true and the price is above the 'Kumo'
Normal : the signal is normal when the condition is true and the price is within the 'Kumo'
Strong : the signal is strong when the condition is true and the price is below the 'Kumo'
Strategy 2: Cross Price - Kijun Sen
A long position is opened with 100% of the invested capital ($1000) when the price crossover the 'Kijun Sen'.
Closing the long position on the opposite condition.
There are 3 different strength signals for this strategy: weak, normal, strong.
Weak : the signal is weak when the condition is true and the price is above the 'Kumo'
Normal : the signal is normal when the condition is true and the price is inside the 'Kumo'
Strong : the signal is strong when the condition is true and the price is below the 'Kumo'
Strategy 3: Kumo Breakout
A long position is opened with 100% of the invested capital ($1000) when the price breakup the 'Kumo'.
Closing the long position with a percentage stop loss and take profit on the invested capital.
Strategy 4: Kumo Twist
A long position is opened with 100% of the invested capital ($1000) when the 'Kumo' goes from negative to positive (called "Twist").
Closing the long position on the opposite condition.
There are 2 different strength signals for this strategy: weak, and strong.
Weak : the signal is weak when the condition is true and the price is above the 'Kumo'
Strong : the signal is strong when the condition is true and the price is below the 'Kumo'
This script is compliant with algorithmic trading.
You can use this script with trading terminals such as 3Commas or CryptoHopper. Connecting this script is very easy.
1. Enter the user interface
2. Select and activate a strategy
3. Copy your bot's links into the dedicated fields
4. Create and activate alert
Disclaimer: algorithmic trading involves risk, the user should consider aspects such as slippage, liquidity and costs when evaluating an asset. The Quant Science is not responsible for any kind of damage resulting from use of this script. By using this script you take all the responsibilities and risks.
חפש סקריפטים עבור "backtest"

Month/Month Percentage % Change, Historical; Seasonal TendencyTable of monthly % changes in Average Price over the last 10 years (or the 10 yrs prior to input year).
Useful for gauging seasonal tendencies of an asset; backtesting monthly volatility and bullish/bearish tendency.
~~User Inputs~~
Choose measure of average: sma(close), sma(ohlc4), vwap(close), vwma(close).
Show last 10yrs, with 10yr average % change, or to just show single year.
Chose input year; with the indicator auto calculating the prior 10 years.
Choose color for labels and size for labels; choose +Ve value color and -Ve value color.
Set 'Daily bars in month': 21 for Forex/Commodities/Indices; 30 for Crypto.
Set precision: decimal places
~~notes~~
-designed for use on Daily timeframe (tradingview is buggy on monthly timeframe calculations, and less precise on weekly timeframe calculations).
-where Current month of year has not occurred yet, will print 9yr average.
-calculates the average change of displayed month compared to the previous month: i.e. Jan22 value represents whole of Jan22 compared to whole of Dec21.
-table displays on the chart over the input year; so for ES, with 2010 selected; shows values from 2001-2010, displaying across 2010-2011 on the chart.
-plots on seperate right hand side scale, so can be shrunk and dragged vertically.
-thanks to @gabx11 for the suggestion which inspired me to write this

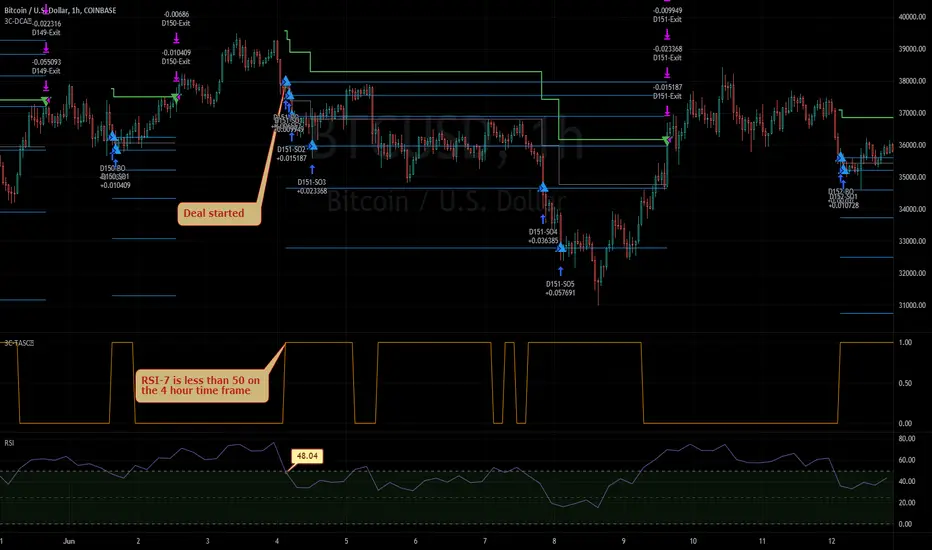
3Commas TA Start Conditions Indicator v1.0Introduction
The indicator attempts to implement the "Technical Analysis Starting Conditions" found in the 3Commas DCA trading bot settings.
How is it original and useful and how does it compare to other scripts in the Public Library?
This indicator is unique in that it's the only one (as of the initial publications) that can handle 5 signal indicator types at the same time as well as output the signal values either to the chart or the data window. The indicator supports all of the following 3Commas built-in indicators on the 3 minute, 5 minute, 15 minute, 30 minute, 1 hour, 2 hour, and 4 hour time frames:
RSI-7
ULT-7-14-2
BB-20-1-LB (Long)
BB-20-2-LB (Long)
MFI-14 crosses 40 (Long)
MFI-14 crosses 20 (Long)
CCI-40 crosses -200 (Long)
BB-20-1-UB (Short)
BB-20-2-UB (Short)
MFI-14 crosses 65 (Short)
CCI-40 crosses 0 (Short)
CCI-40 crosses 100 (Short)
What does it do and how does it do it?
When applied to the chart for the first time, the default settings are completely blank, so the only chart element you will see is the "Start Condition Result" line in orange. Once you start applying settings in the "DEAL START CONDITION" section, the indicator will redraw and display the new values for the "Start Condition Result" line. A value of 1 indicates that the results of the condition(s) is "passing". Conversely, a value of 0 indicates that the results of the condition(s) is NOT passing. If you desire to dig deeper into why the indicator is producing the results, you can enable the "Show TA Indicator # Plot" to visually see the values on the price chart or simply open the Data Window panel to see their values as you hover over the candles in the price chart.
This indicator can be used with any indicator in the Public Library that seeks to emulate the 3Commas Technical Analysis Starting Conditions for a signal provider. For example, this indicator can be used our own 3Commas DCA Bot Strategy v1.0 to aid in your backtesting analysis and build confidence that your bot will perform given historical market data that TradingView provides. When you do so, make sure that the "Strategy" input has the same values with the two indicator settings.
Enjoy! 😊👍
How to obtain access to the script?
You have two choices:
Use the "Website" link below to obtain access to this indicator, or
Send us a private message (PM) in TradingView itself.
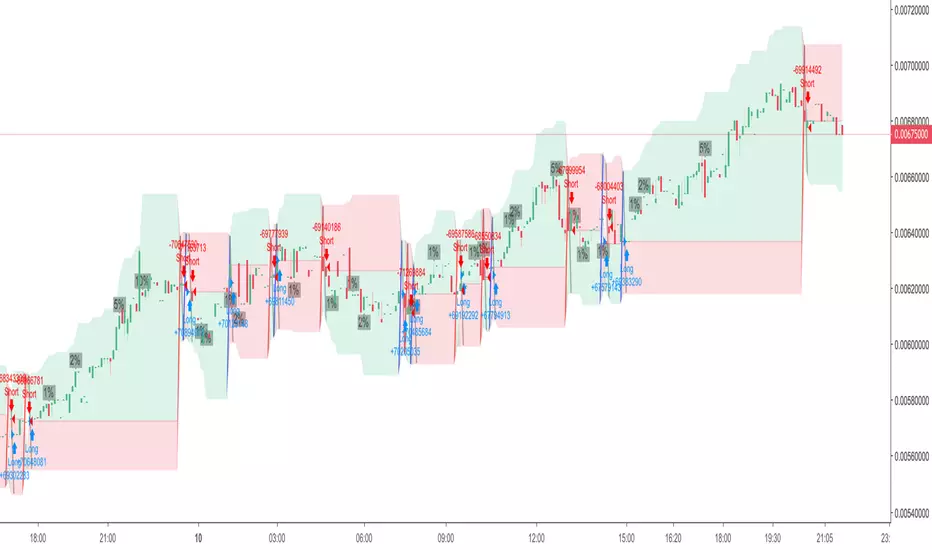
EMR Strategy [H1 Backtesting]EMR Strategy base on EMA, MACD and RSI to supply signal on time frame H1.
Details of Rule as below:
===
1.EMA
+ Time frame: H1
+ Periods: 25, 100 (~ EMA 25 H4), 600 (~ EMA 25 D1)
===
2.MACD
+ Time frame: H1
+ Periods: 12,26,9
===
3.RSI
+ Time frame: H1
+ Periods: 14
===
4.Trading Rule
4.1.Long Position
+ MACD>0 and RSI>50 and close price moving above EMA 25
+ Close price crossed EMA 100 or crossed EMA 600 at the first time
4.2.Short Position
+ MACD<0 and RSI<50 and close price moving below EMA 25
+ Close price crossed EMA 100 or crossed EMA 600 at the first time
===
5.Money Management
+ This strategy concentrate into winrate.
+ So use trailing stop to protect your profits.
+ And use stoploss to avoid big loss on trades.

RaBot V1.0.0 - BacktestingRabot is an indicator for new users as well as experienced users.
This indicator tries to predict both buy and sell signals. You can configure it for both scalping and swing trading.
It has two modes, one more "conservative", where the number of entries will be less than the other "greedy" mode.
Based on the famous and complex indicator "Koncorde" that combines both trend and volume knowing the manipulation of strong and weak hands, patterns, and crossing of emas customized by us; for example: a buy signal in conservative mode will only open if the trend is bullish and vice versa.
The user can configure the way they like by opening many positions or few but more secure based on their trading style.
The indicator also has the option to configure which chart we want to obtain the trend from, this is to avoid perhaps opening shorts in a very bullish trend line for example.
Rabot is a fairly complex indicator, which can be used for automatic use of inputs and outputs, as well as manual.
You also have the option of NOT opening a position if there is one currently open, and the option for the next signal to be the opposite of the last one.
5TPs, 1SL, and Breakeven after take profit achieved.
Finally version 1.0.0 is now available! :)
This version contains backtesting with 5000 backbars to see if it is being profitable or not.
We are continuously working, testing and updating bugs and improvements.
Do not hesitate to get in touch for a feedback, it will be welcome and we will take it into account.

TFi Simple Moving Average Bot V1 - PUBLICThe bot is using 2 moving averages for detecting the trend; the type of moving average is configurable; if the 2 moving averages are crossing it enters a long or short position. A stop-loss and profit-target can be configured; if reaching the profit-target, the bot is closing 50% (configurable) of the position, from this time on it is using a trailing-stop to close the position if the trailing-stop has been crossed.
The following moving-averages can be configured:
DEMA
EMA
HMA
RMA
SMA
TEMA
VWMA
WMA
Overview of features:
Optional stop-loss and profit-target/trailing-stop
Built-in backtesting engine with start balance, position size and pyramiding; each year will be evaluated separately
Inputs for a percentage entry and exit slippage, entry/exit and daily funding fees
Configurable alerts, which follow the exact position of the entry/exit marker
Alert messages contain predefined trading instruction to execute orders via TradeFab's proprietary trading server, which supports Alpaca-Markets, TD Ameritrade, Oanda, CCXT API's, or can be defined by the user
The script renders a performance/status table, which shows the current position status and result of the built-in trading simulation results. The following statistics are shown:
Current position PnL - also background turns green if position is in profit and red if in loss
Average entry price and number of positions
Current percentage distance to the optional stop-loss level
Current Maximum Draw Down
Number of wins and losses and the win/loss ratio per year and overall
Profit and loss amount, paid fees per year and overall
Profit-ratio and Maximum Draw Down per year and overall
Balance and ROI per year and overall

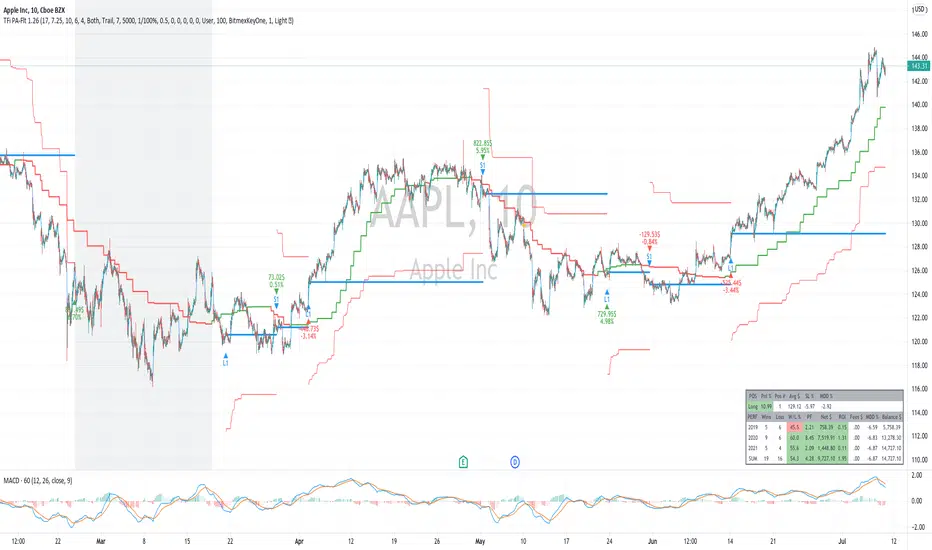
TFi Price Action Resampling Filter V1 - FULLThe script is resampling the price based on its range/price-action and creates an alternative filter to smoothen price movements.
Overview of features:
Optional stop-loss
Optional flags to control the position entry
Optional flags to control the position exit
Built-in backtesting engine with start balance, position size and pyramiding; each year will be evaluated separately
Inputs for a percentage entry and exit slippage, entry/exit and daily funding fees
Configurable alerts, which follow the exact position of the entry/exit marker
Alert messages contain predefined trading instruction to execute orders via Alertatron or TradeFab's proprietary trading server, or can be defined by the user
The script renders a performance/status table, which shows the current position status and result of the built-in trading simulation results.
It shows the following statistic values:
Current position PnL - also background turns green if position is in profit and red if in loss
Average entry price and number of positions
Current percentage distance to the optional stop-loss level
Current Maximum Draw Down
Number of wins and losses and the win/loss ratio per year and overall
Profit and loss amount, paid fees per year and overall
Profit-ratio and Maximum Draw Down per year and overall
Balance and ROI per year and overall
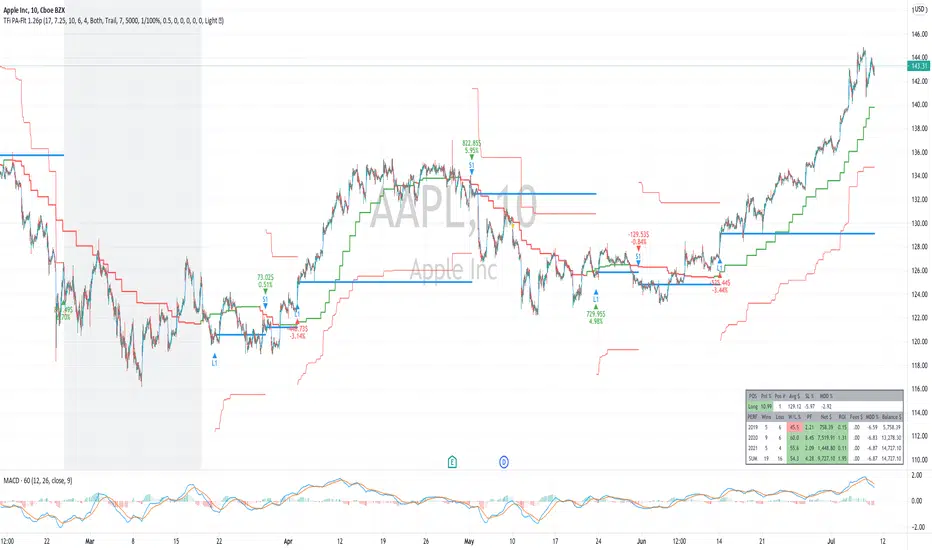
TFi Price Action Resampling Filter V1The script is resampling the price based on its range/price-action and creates an alternative filter to smoothen price movements.
Overview of features:
Optional stop-loss
Optional flags to control the position entry
Optional flags to control the position exit
Built-in backtesting engine with start balance, position size and pyramiding
Inputs for a percentage entry and exit slippage, entry/exit and daily funding fees
Configurable alerts, which follow the exact position of the entry/exit marker
Alert messages contain predefined trading instruction to execute orders via Alertatron or TradeFab's proprietary trading server
The script renders a status box at the last bar, which shows the current position status and result of the built-in trading simulation results.
It shows the following statistic values:
Current position PnL - also background turns green if position is in profit and red if in loss
Average entry price and number of positions
Current percentage distance to the optional stop-loss level
Current Maximum Draw Down
Overall number of wins and losses and the win/loss ratio
Overall profit and loss amount, paid fees
Overall profit-ratio and Maximum Draw Down
Overall balance and ROI
Improved Ichimoku Cloud: smoother and easier backtesting1. Smoother
This indicator uses the moving average of the price to calculate the Ichimoku cloud. The result is a smoother indicator that filters out noise. Bear in mind, it's a bit slower as well. Change the MA Len setting to 1 in order to display the traditional Ichimoku cloud.
2. Easier backtesting
When you're using the indicator in live trades, you're used to seeing the lagging span displaced back in time (hence the name). The lagging span gives information about if it is or isn't in the price range of a certain amount of candles ago. But when you're back testing, it's hard to find the exact point on the lagging span that matches the price in the past. You have to calculate what time it was, accourding to 'lagging span periods' ago, relative to the candle you want to observe in your back test. Then you have to find that moment on the timeline by eye. Therefore I made the Visual Method adjustable.
If you set the Visual Method to 'back test', the lagging span moves forward in time instead of backward. This swaps the idea: instead of inspecting whether the lagging span was in the price range, you can inspect if the price was in the lagging span range (or forward span, if you like). Seems weird, but the result is the same.
3. Mind the crypto default settings!
I have developed the indicator for crypto currency so the default settings are 20, 60, 120, 30. When you're not trading crypto's, set it to 9, 26, 52, 26. You can always use your own favorite settings, regardless what you're trading.

AltBetaHello Tradingivew!
This is a new script I have been working on for last few weeks, its still in a beta mode version but i want to publish it to get some feedback on it
This script uses a variety of indicators in conjunction with each other
Its unique in a way as it only LONGS and gives the exits rather than shorting too
It uses a percentage of the spread between average of high, low and close with ema crossover
it's uni-directional, picking longs only
Stop losses are wide enough to give the signal room for good results
it works best by backtesting against data to see results before using it on any particular symbol or timeframe
To try it our you may message me directly on tradingview chat
Thanks

SupterTrend I created this script for basically two reasons
1. there is not simple suptertrend indicator available on tv rather you will find many fancy suptrend indicators with confusing other indicators and absurd background colors i dont know why some of the trader coders are obsessed with is using over the top color and designing phenomena.
2. I want to let people know about the accuracy of suptertrend indicator on multiple time frames i am plaining to create a backtesting tool for almost all Famous indicators so that specially new folks know what should they expect from any particular Indicator
Also i added intraday filter to check the results for intrday signals . the sqaure off timings are for Indian markets only but you can edit the hours and minutes in the code for using other than indian markets. No need to do anything if you only want positional trading trading results

Patient Trendfollower (7)(alpha) Backtesting AlgorithmThis is an alpha version of backtesting algorithm for my Patient Trendfollower (7) strategy. It can help you adapt the indicator to other charts than EURUSD. Please bear in mind that price action, volume profiles and supzistences are a catalyst for successful trading, not an indicator. You can get significantly better results if you use these things in your trading and use Trendfollower only as a secondary tool.
Patient Trendfollower Indicator
Thanks belongs to @everget and Satik FX, their contributions are highlighted on an indicator page.

BO - RSI - M5 BacktestingBO - RSI - M5 Backtesting -Rule of Strategy
A. Data
1. Chart M5 IDC
2. Symbol: EURJPY
B. Indicator
1. RSI
2. Length: 12 (adjustable)
3. Extreme Top: 75 (adjustable)
4. Extreme Bottom: 25 (adjustable)
C. Rule of Signal
1. Put Signal
* Rsi create a temporary peak over Extreme Top
row61: peak_rsi= rsi >rsi and rsi >rsi and rsi rsi_top
2. Call Signal
* Rsi create a temporary bottom under Extreme Bottom
row62: bott_rsi= rsi rsi and rsi

UT Bot Strategy with Backtesting Range [QuantNomad]UT Bot indicator was inially developer by @Yo_adriiiiaan
Idea of original code belongs @HPotter
I can't update my original UT Bot Strategy so I publishing new strategy with backtesting range included.
I just took code of Yo_adriiiiaan, cleaned it, deleted all useless pieces of code, transformet to v4 and created a strategy from it.
Also I added an input that allows you to swich to signals from Heiking Ashi. I saw that author uses HA for the indicator and on HA it look much nices then on real candles.
Do not add this strategy to HA candles, use usual candles and this checkbox.
Original script:
UT Bot

[Bybit] Gainzy Intraday Momentum AlgoOverview
This algorithm uses a single unorthodox moving average that I created by modifying an obscure moving average.
It is meant to be used on intraday time frames.
Signals
Green column: buy signal
Red column: sell signal
Wait for a candle to close in order for the signal to be confirmed
Profit tracking
The background tracks the profitability of the algorithm over the last 5000 candles or so
Every time a new signal is confirmed it updates the net profit (minus the commission)
Net profit is shown as a percentage of your starting balance. For example, say your starting balance is $1.00. Your current balance is $1.50. Net profit will appear as 50%.
Percent commission is the fee charged for entering a position using a market order. It is set to 0.75% by default.
Specifications
Net profit is based on using the entire account balance and compounding gains
For example, your balance is $100. You receive a buy signal and go long for $100. Price goes up a little over 10% and you receive a sell signal. You close your long position. Your new balance is $110. You now open a short position for $110. You have compounded the gains of your previous long position into your new short position.
Backtesting
You can view the profitability of this algorithm by Day / Week / Month / Quarter / Year / All-Time
If you choose the monthly Interval, on the final day of the month, it will display the realized profit of this algorithm. Unrealized profit will not be included. For example, if you are up 50% on the month and in a trade that is currently up 10%, net profit for the month will be shown as 50%. The 10% of unrealized profit will be carried over into the first trade of the following month.

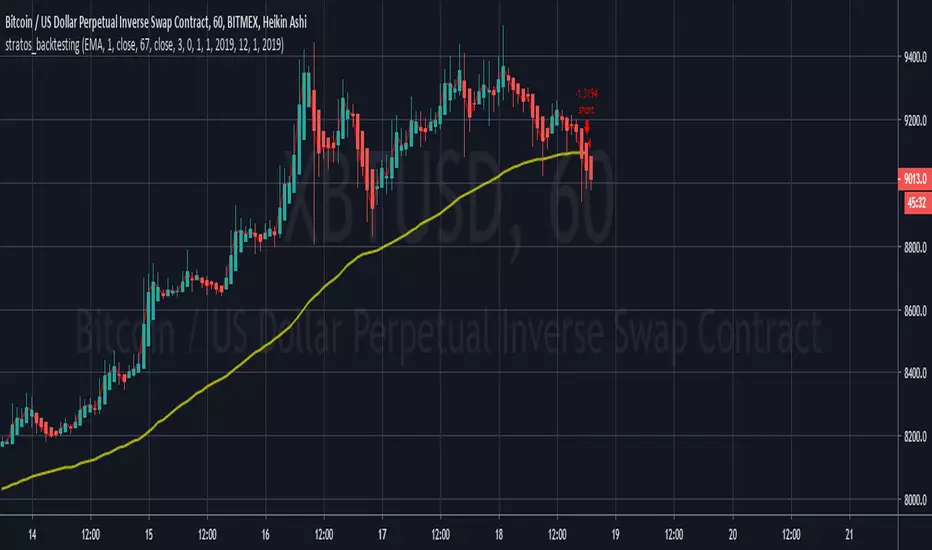
Stratos - Backtesting - Final Version - CryptoFoudid.comHi all,
Here you have the backtesting script based on Moving Average.
We trade automatically for our customers on the bitmex platform. For more information, contact me directly.
Cheers

-- Ultimate Crypto Trading Strategy -- Backtesting version** This is the backtesting (strategy) version of the ~ Ultimate Crypto Trading Strategy ~ script in TradingView. **
~ Ultimate Crypto Trading Strategy ~
֎ Trading system script on @tradingview that brings the easiest approach to trading with a high profitability rate
֎ Optimized for crypto markets, to catch trend movements as soon as possible and maximize profitability
֎ Sell & Buy alerts, Safeguard mode, Take Profits alerts, auto resistance-support and always adding new features!
֎ Customizable settings.
֎ Users Discord community for learning, sharing and direct support
֎ Ultimate Crypto Trading Strategy Tutorial Video: www.youtube.com www.youtube.com
֎ Safeguard feature (match multiple timeframes signals) explained: youtu.be youtu.be
If you’d like to test the trading script in TradingView, I can give you access to a 10 days trial.
Please send me a message in tradingview and I’ll activate it right away.
Thank you!

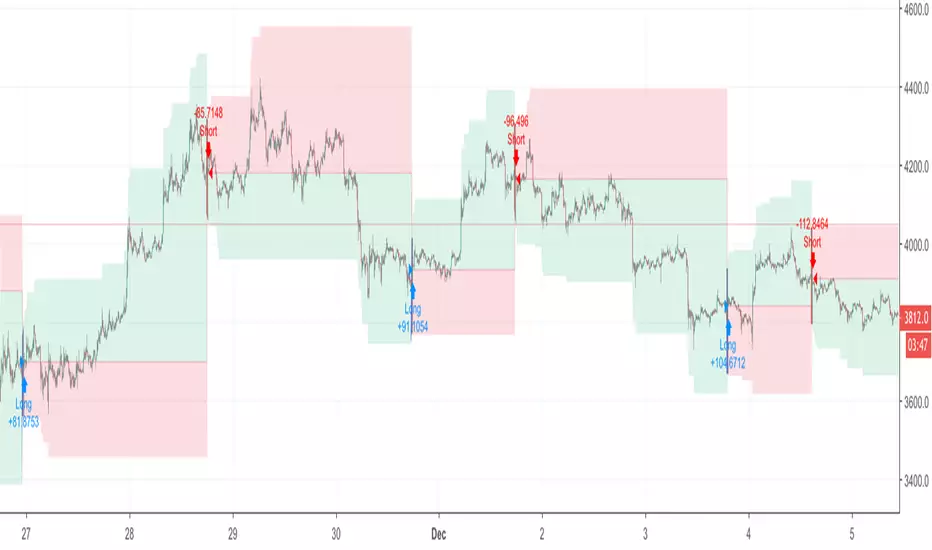
TigerBot SuperWave with MACD Skeleton (Faster Backtesting)Visit our website or direct message us to learn how you can get started with TigerBot automation today!
This strategy is a custom solution that we have provided. At this time, it is a private, invite only script.
Note: This is a TigerBot Strategy, which means that it includes our full set of automation and risk management features such as:
Thorough event triggers for automated order execution
Profit/Loss Zones
Profit/Loss Indicators
Take Profit
Normal Stop Loss
Trailing Stop Loss
Advanced Trailing Stop
Profit Locker Stop Loss
Advanced Pyramiding Support
Leverage Support
Much more
Each TigerBot Strategy includes a set of 3 scripts that belong together:
STRATEGY - used for full-featured customization with all our visuals
STUDY - with alert triggers for automation
SKELETON - for faster backtesting without the visuals enabled
This is the SKELETON version of this script. Please also see the other 2 related scripts.

TigerBot SuperWave with MACD Strategy (Backtesting)Visit our website or direct message us to learn how you can get started with TigerBot automation today!
This strategy is a custom solution that we have provided. At this time, it is a private, invite only script.
Note: This is a TigerBot Strategy, which means that it includes our full set of automation and risk management features such as:
Thorough event triggers for automated order execution
Profit/Loss Zones
Profit/Loss Indicators
Take Profit
Normal Stop Loss
Trailing Stop Loss
Advanced Trailing Stop
Profit Locker Stop Loss
Advanced Pyramiding Support
Leverage Support
Much more
Each TigerBot Strategy includes a set of 3 scripts that belong together:
STRATEGY - used for full-featured customization with all our visuals
STUDY - with alert triggers for automation
SKELETON - for faster backtesting without the visuals enabled
This is the STRATEGY version of this script. Please also see the other 2 related scripts.
CS Basic Scripts - Stochastic Special (Strategy)This Stochastic Special Strategy features inputs for:
- Custom Backtesting Date Range
- Long and Short Strategy Discinctions
- Utilize SMI, RSI, Martingale, and Body-Filter Strategy
- Adjust the SMI Percent Lengths and Limit
- Automate with the Autoview Trading Bot
Strategy script may be tested by favoriting and adding to any chart.
Study script is available for automated trading at www.cryptoscores.org

TigerBot StreetScript Skeleton (Faster Backtesting)Visit our website or direct message us to learn how you can get started with TigerBot automation today!
Note: This is a TigerBot Strategy, which means that it includes our full set of automation and risk management features such as:
Thorough event triggers for automated order execution
Profit/Loss Zones
Profit/Loss Indicators
Take Profit
Normal Stop Loss
Trailing Stop Loss
Advanced Trailing Stop
Profit Locker Stop Loss
Advanced Pyramiding Support
Leverage Support
Much more
Each TigerBot Strategy includes a set of 3 scripts that belong together:
STRATEGY - used for full-featured customization with all our visuals
STUDY - with alert triggers for automation
SKELETON - for faster backtesting without the visuals enabled
This is the SKELETON version of this script. Please also see the other 2 related scripts.

TigerBot StreetScript Strategy (Backtesting)Visit our website or direct message us to learn how you can get started with TigerBot automation today!
Note: This is a TigerBot Strategy, which means that it includes our full set of automation and risk management features such as:
Thorough event triggers for automated order execution
Profit/Loss Zones
Profit/Loss Indicators
Take Profit
Normal Stop Loss
Trailing Stop Loss
Advanced Trailing Stop
Profit Locker Stop Loss
Advanced Pyramiding Support
Leverage Support
Much more
Each TigerBot Strategy includes a set of 3 scripts that belong together:
STRATEGY - used for full-featured customization with all our visuals
STUDY - with alert triggers for automation
SKELETON - for faster backtesting without the visuals enabled
This is the STRATEGY version of this script. Please also see the other 2 related scripts.