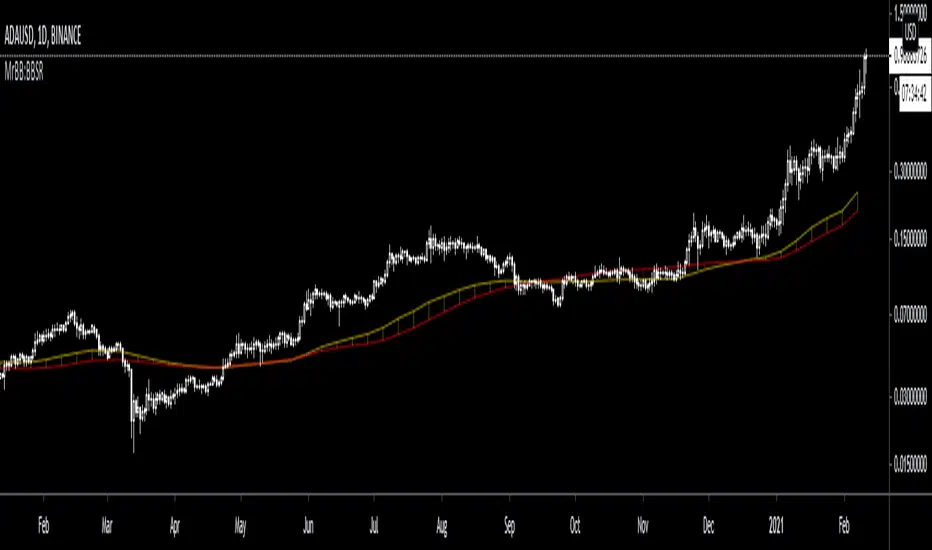
MrBB:BullBear Support BandVery simple and effective S/R band. Created bycombining the weekly 21EMA and weekly 20SMA, it provides strong support/resistance depending on market direction, and works as a basing area for retraces during parabolic (and normal) bull markets.
ממוצע נע פשוט (SMA)

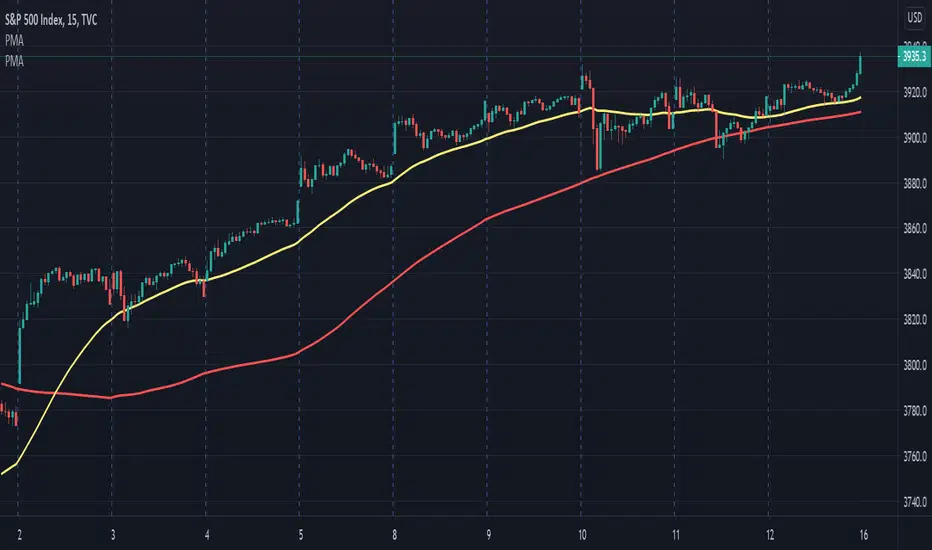
Moving Average PeriodicalPMA derives the length of its rendered SMA from the number of periods (example: 5 days) and the length of the period (example: 390 minutes)
The result is an indicator that should be the same across different time-frames of the same type. Allowing for the simple calculation and generation of a Daily Moving Average like the 5 Day SMA (the default for minute based time-frames).
MA Divergences for any indicatorThis is a mod of Tistas mod of the default RSI divergences.
www.tradingview.com
This is a SMA that can be applied to any indicator for divergence seeking. This can be useful if you use a custom indicator script and want divergences added, or for any oscillator really. Set the length to 1 and it will mirror the oscillator in question.

Triple SMA Strategy with entries based on sma price closesHi! :)
This strategy is made for intraday trades, especially on 5 sec - 5 min charts to follow the trend.
I have not tested on higher timeframes, but feel free to play with the values.
I have set a basic value for the 3 SMA at
-200
-400
-600
We will use an oscillator for entries which is not mine. Link ->
The oscillator mentioned above is just for visualization purposes, You do not need to get the signals, but You can see how scripts are generated with different values.
When the price above/below all the 3 SMA and oscillator crosses above/below "value you set" - You will get the buy or sell signal.
Your stop will be where the slowest SMA is.
Pyramiding is set for 10.
You can manually set 3 take profit and quantity levels.
Basic values are 1 %, 2 %, and 6 % for taking profits - You can change it based on how volatile the asset is.
Basic quantity values are 30 % at each level.
Hope You find it useful :)

Ark Crypto HeatlineThis is the 'on chart' indicator. See also "Ark Crypto Heatband" indicator for a side-by-side BTC view, without a re-scaled line.
The crypto landscape is largely dominated by BTC and characterised by cyclical stages with varying degrees of mean reversion.
To understand what stage of the cycle we are currently experiencing, it is useful to examine to what degree the current price has extended beyond the long term average that BTC has established. This is true even when analysing other crypto assets as BTC is the dominant force in the crypto asset class.
This indicator uses the 1400 period daily SMA , which is broadly the 200 period weekly SMA. This can be configured, but historically has represented a baseline to which BTC commonly returns.
The graph plots current price in terms of multiples of this long term average. Traditionally, at multiples beyond 10, BTC is considered overextended with a higher likelihood of trending towards the mean thereafter. Colors indicate the extent of price extension.
Where the indicator is applied to non BTCUSD pairs, a smoothed conversion is applied, seeking to superimpose the BTC long period SMA onto the current chart.
The indicator specifically references BTC by default on all charts, as it is designed to use BTC as general purpose indication of where crypto as a whole currently sits. Accordingly the indicator is only to be used on crypto charts.
For best results on BTC, using BNC:BLX will give the longest historical view.

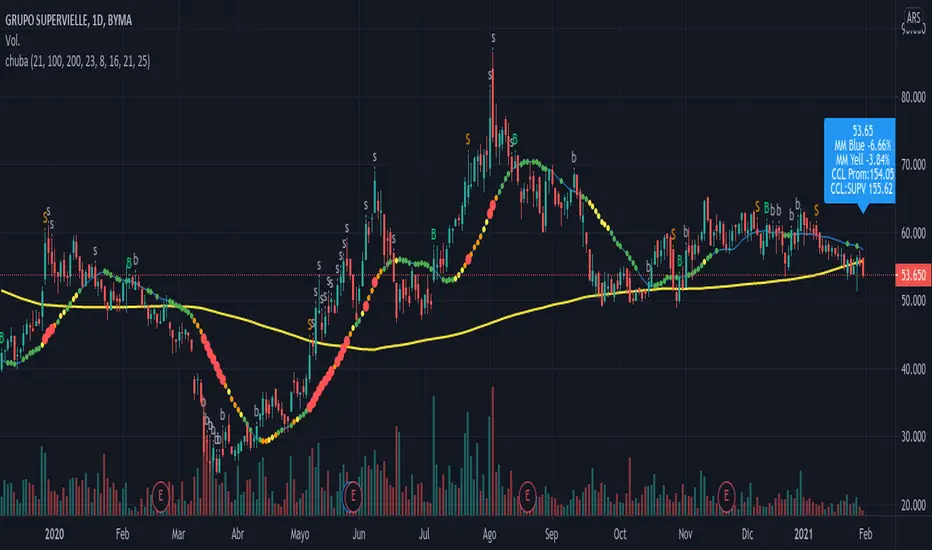
chuba indicator MM21 dispersion cclIt draws a Simple Media Mobile of 21 days (MM21days) in blue and draws a MM200days in yellow , despite the time frame is Days, Hours or Seconds.
Indicator based in Prof ALEXIS TSCHUBAROV 's strategy . It calculates the max dispersion in percent between the MM21days and the ticker price inside the time frame.
Over the last candle write a coloured globe depending on the dispersion with the latest stock price:
blue : dispersion < 8%
green : dispersion < 16%
orange: dispersion < 23%
yellow : dispersion < 25%
red : dispersion >= 25%
The globe show inside:
last stock price
Azul NN.NN% : dispersion between MM21days and the last stock price
Ama NN.NN% : dispersion between MM200days and the last stock price
CCL average ( contado con liqui dolar price in ARS )
tiker's CCL ( contado con liqui dolar price in ARS )
Colored dots over MM21days depends the value between MM21days and the max dispersion of the candle :
none dot : dispersion < 8%
green dot: dispersion < 16%
orange dot: dispersion < 23%
yellow dot: dispersion < 25%
red dot: dispersion >= 25%
Show over the candle when Buy or Sell
The criteria when buy or sell are:
When the closed stock price crosses the MM21days
When the dispersion with the MM21days exceed the 25%
Alarms:
Alarm when sell , when buy
Alarm dispersion reaches 23%
Note:
ask for more CCL tickers price.
Alexandermonday ( a brusa )
Ark Crypto HeatbandThe crypto landscape is largely dominated by BTC and characterised by cyclical stages with varying degrees of mean reversion.
To understand what stage of the cycle we are currently experiencing, it is useful to examine to what degree the current BTC price has extended beyond a long term average. This is true even when analysing other crypto assets and helpful to view side by side.
This indicator uses the 1400 period daily SMA, which is broadly the 200 period weekly SMA. This can be configured, but historically has represented a baseline to which BTC commonly returns.
The graph plots current price in terms of multiples of this long term average. Traditionally, at multiples beyond 10, BTC is considered overextended with a higher likelihood of trending towards the mean thereafter. Colors indicate the extend of price extension.
The indicator specifically references BTC by default on all charts as it is designed to use BTC as general purpose indication of where crypto as a whole currently sits. Accordingly the indicator is only to be used on crypto charts.

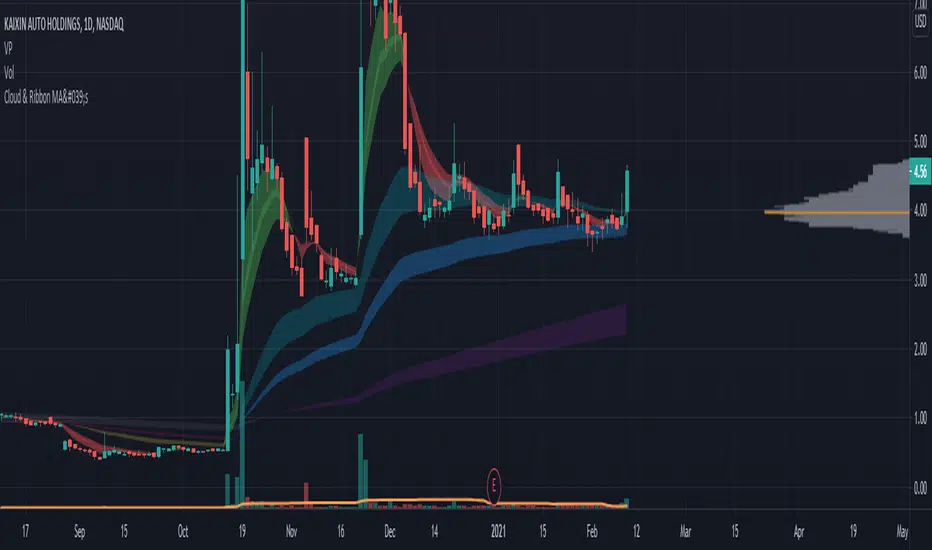
Cloud & Ribbon Moving AveragesGreat for reversals, entry points for long & short positions.
Clouds change colors when crossover between 2 MA's occur.
Options for:
5-12 Day EMA
34-50 day EMA
150-200 day SMA
8-9 Day EMA Ribbon
HLC MA One LineHLC MA is a simple Moving Average which compares x period close and hlc3 averages and takes the greater one. So, it's a pretty fast Moving Average. It's also color coded. Green, white, and red used for up trend, possible correction or transition area and down trend, respectively. It's smoothed by using a simple method, color of the indicator only changes when its value higher or lower than its n period earlier value. By doing this, HLC MA manages to be fast and and less prone to false trend changes.


White MAThis modified indicator just based on my 2cent strategy & experience,
which is:-
MA6, MA20, MA50, MA200
However, I always turn off MA20 since I also use BB (20) indicator.
Generally, if small MA cross up big MA, then it becomes entry signal, & vice versa
Each entry signal need confirmation state which is next price should close higher than crossing price.
If price close lower than crossing price, then it will be invalid entry's signal,
while if price keep maintain at same value, then it's mean uncertain for me until it close whether above or below crossing price.
"Strategy 1" (General)
In TF1D, the pattern should fulfill my condition as below:-
- MA20 above MA50 (bullish uptrend)
- Price pullback at least touch MA20 for reversal (making Higher Low)
- Price break resistance of pullback's price
My entry signal only after it close above the resistance, near "support" (RBS, Resistance become Support)
My stop-loss, if and only if price touch previous SMA6 price (or SMA10)
Unfortunately, I haven't had any specific target price. It's depending on what kind of "player" you are. (achievement)
Few TPs those I used:-
- Price touch my Static Resistance on chart obtained from,
~ Pullback price
~ Fibo (1.61++)
~ Higher price in 3 months, 6 months, 1 year, 3 year, and so on. (road to ATH, All Time High)
- Price close outside Upper BB (Dynamic Resistance)
I don't assume sell signal by using crossing indicator as TP, it's more to stop-loss for me. (means stop from loss your profit)
"Strategy 2" (Reversal Entry)
In TF15 minutes, we are assuming entry signal when SMA6 cross up SMA50. However, it's still need confirmation by next closing price.
This strategy can be apply in TF1D although SMA20 doesn't cross up SMA50 yet.
That's all my sharing strategy/system based on my 2cent experience, it's not a prefects strategy but I hope it will gives some idea for you guys in order to obtain your own system.

TradiKator 01 MATradiKator 01 MA is the a visual indicator that plots market capitalized cost following moving average (SMA and EMA) , based on LEI & LoneCapital defined metrology method and includes the TradiKator creative idea to help visualize the Price action in relation to the market capitalized cost.
Q&A
Q1.Why Moving Average ?
As LEI & LoneCapital explained moving average is indicating market capitalized cost moving.
If you are a trend following trader, you should participate in upside while sidestepping downside.
You need a indicator that help you to make money while prices are rising, then exit when they are falling.
A classical approach is the moving average strategy.
Nevertheless as efficient-market hypothesis (EMH) states that asset prices will reflect all available information.
The smart trader should focus on price moving i.s.o. reading all available information which is not practical.
Q2.What is Moving Average ?
As the name implies, the moving average is an average of a price's movement over time.
The simple moving average (SMA) is a just simple average over time.
The exponential moving average (EMA) on the other hand gives greater weight to more recent price action.
Q2.What are the Period Moving Average based on ?
The default Moving Average Period setting are based on LEI & LoneCapital defined Short term 20 (days in month), Mid term 60 (days in quarter), Long term 120 (days in half year).
We use 3 colors to represent these 3 periods. Black as Short term , Red as Mid term , Blue as Long term
You will see same color scheme in our indicators.
Of cause you can change the default setting to switch to your favorite Moving Average Period. How to do it is listed in setting.
Function and Setting
1.MA period setting
"Adjust All MA Period" --> Users can increase or decrease all 3 period in the same time. For example, input "-1" , you will have 3 periods as "19","59","119"
"Fix the M_MA=3*S_MA,L_MA = 6*S_MA (overwrite below 2 settings)" --> It will fix the Mid period as 3 times of short, Long period as 6 times of short. Meanwhile the separated setting for Mid and long will be ignored.
"3 period separated settings" --> Please disable the "fix ..." setting for individual 3 periods
"Source" --> Allow user switch used source from "close" to any other data source like"hl2","hlc3" and etc.
2.Deduction price Setting
"Show deduction price label (Pls disable the angle)" --> Will show 3 deduction price. Please disable the "Show Angle ..." before enable this switch.
"Arrow on Slope (Deduction vs Today Which is higher)" --> Will show 3 arrows aim to the higher price between Deduction and Today.
Also the dashed slope line will change to solid line. It helps when Deduction is very close to Today
3.Angle for slope line ---> Killer feature
"Show Angle ..." --> As LEI & LoneCapital explained current trend can be described as "o'clock direction wise" .
By measuring current trend's "angle" we can has a fuzzy image about current trend.
Note: In fact there is real 12 o'clock or 90 degree, therefore we define our "90 degree" and all called value of "angle" is based on our defined metric.
Also everyone has different opinion about the start point of current trend.
We choose the 3 MA periods as the start point to measure the angles.
There are 3 mod prepared for the angle measure metrology.
Abs % --> "90 deg" = increase 100% in 20 days. It is the most robust mod.
1Y rel % --> "90 deg" = increase 50% of 1Y Absolute price range in 20 days. It can't be used in case of minus price.(like CL future in 2020 Mar)
1Y rel log --> "90 deg" = increase 50% of 1Y log scaled price range in 20 days. Also it can't be used in case of minus price.
4.Deduction price trail and Background color
"Show Deduction price trail" --> Enable it to show the 3 Deduction prices' trail.
"Show trail in the coming days" --> Enable : the prices' trail is showed in the coming days. Disable : the prices' trail is showed on the MA period historical days.
"MA long term Trend Background Color" --> Similar to the "fill EMA with color", fill the Background with color which represent the EMA trend.
5.High volume and Show gap
"High volume label" --> Highlight the high volume with label.
We define the volume which is higher than percentile value of 3 MA historical volume statistical metrics.
So the black label means this volume is higher than 97 percentile value of 20 days' volume. Red 60 days and Blue 120 days.
The percentile can be set by user. Also the MA period can be adjusted by user.
"Show gap" --> Highlight the gap between close and next day open.
Note: We don't measure whether the gap is closed or not.
6.Forecast SMA ---> Killer feature
As you noticed the dashed line after today, it is our killer feature: forecast SMA.
Green Dashed line: The close price according to the assumption user input.
3 colors' Dashed lines: The SMA based on the Green Dashed line's close price.
"Days to plot forecast SMA (Max=14, SwitchOff=0)" --> Please decide how many days' SMA user would like to forecast.
"Mod1 Assumed chg ratio ‰ in the every days (10=1%)" --> Mod1: User should give the change rate in the coming every days. For example, user's assumption is that price will increase 10% everyday.
"Mod2 Assumed chg % in the ?th day (1=1%)(Pls set Mod1 to 0)" --> Mod2: User should give the change rate in the future ?th days. For example, user's assumption is that price will increase 30% in the 3rd day.
"Mod2 Need ? day to reach the chg % (tomorrow = 1 day)" --> Mod2: User should give the future ?th days.
note: While using Mod2, user has to disable Mod1 by set Mod1 to 0 (default setting)
TradiKator is Traders' indicator.
Please visit TraiKator for more free script.
We also support Chinese.

Tabajara Ogro 2021 - RSJTabajara was created by André Machado , a Brazilian trader known as "O OGRO de Wall Street" .
The main idea is to indicate to the trader the current price trend and what type of operation to look for in the chart.
It does this through the relation of the closing price position and the SMA of 20 periods, by painting the candles in 4 possible colors:
Green -> Price rising in Bullish Trend (search for LONG entry points)
Black -> Price correction in Bullish Trend (search for LONG entry points)
Red -> Price falling in Bearish Trend (Search for SHORT entry points)
White -> Price correction in Bearish Trend (Search for SHORT entry points)
In addition, I also put the following indicators in the script:
EMA of 8 periods: To identify short-term price movements
SMA of 50 periods: To identify medium-term price movements
EMA of 80 periods: To identify medium-term price movements
SMA of 200 periods: To identify long-term price movements
Bollinger bands in the standard configuration: To identify the volatility of price movements
-------------------------------------------------------------------------------------------------------------------------------------------------------------------------------------------------------------
O Setup Tabajara foi criado por André Machado , trader brasileiro conhecido como "O OGRO de Wall Street" .
A ideia deste setup é indicar ao trader a tendência atual dos preços e qual o tipo de operação deve-se buscar no gráfico.
Ele faz isto através da relação de posicionamento do fechamento dos candles e o sentido da média aritmética de 20 períodos pintando os candles de 4 possíveis cores:
Verde -> Preço subindo em Tendência de alta (Buscar pontos de entrada de COMPRA)
Preto -> Preço corrigindo em Tendência de alta (Buscar pontos de entrada de compra)
Vermelho -> Preço caindo em Tendência de baixa (Buscar pontos de entrada de Venda)
Branco -> Preço corrigindo em Tendência de baixa (Buscar pontos de entrada de Venda)
Além disso, também coloquei no script os seguintes indicadores:
Média Exponencial de 8 períodos: Para identificar os movimentos curtos prazo do preço
Média Aritmética de 50 períodos: Para identificar os movimentos de médio prazo do preço
Média Exponencial de 80 períodos: Para identificar os movimentos de médio prazo do preço
Média Aritmética de 200 períodos: Para identificar os movimentos de longo prazo do preço
Bandas de Bollinger na configuração padrão: Para identificar a volatilidade dos movimentos do preço

Fancy Bollinger Bands Strategy [BigBitsIO]This script is for a Bollinger Band type indicator with built-in TradingView strategy including as many features as I can possibly fit into a Bollinger Band type indicator including a wide variety of options to create the most flexible Bollinger Bands strategy possible.
Features:
- A single custom moving average serving as the middle band.
- Standard MA inputs.
- MA type.
- MA period.
- MA price.
- MA resolution (time frame).
- Visibility toggle.
- MA Candle Type
- Fancy MA inputs.
- Toggle to show only candles included in the MA calculation ("Highlight inclusion") or display entire MA history.
- Toggle to show a ghost trail when Highlight inclusion is toggled on. Displays a shaded version of past MA history before the inclusion period (as seen on snapshot).
- Toggle to show forecast values for the MA.
- Other inputs related to forecasting:
- Forecast bias. (Neutral forecasts MA if the current price remains the same.)
- Forecast period.
- Forecast magnitude.
- Toggle showing details on the screen
- Toggle the visibility of the fill between the upper and lower bands.
- Toggle to use ATR instead of the standard deviation to calculate the location of the upper and lower bands.
- Custom input for the ATR period.
Strategy Features
-Strategy Window - only test during this window
-Take Profit and Stop Loss
-Open and Close conditions, including condition counts and any/all requirements
-Many conditions to choose from that can either be selected to open, close or open and close a position
-Conditions include:
-Price crossing above/below the Upper, Middle, or Lower bands
-Price being above/below the Upper, Middle, or Lower bands
-Bollinger Band width crossing or being above/below custom values
-Percent B crossing or being above/below custom values
This script may contain errors, or out of date code. Please be mindful of updates to the script.
*** DISCLAIMER: For educational and entertainment purposes only. Nothing in this content should be interpreted as financial advice or a recommendation to buy or sell any sort of security or investment including all types of crypto. DYOR, TYOB. ***

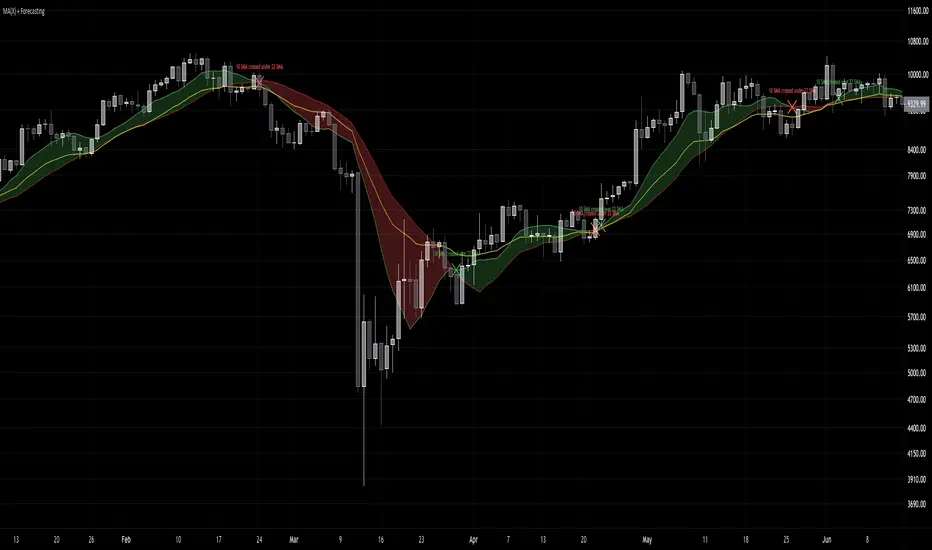
MA(X) + ForecastingSimply put, MA(X) + Forecasting is a moving average cross visualizer which allows the end-user to enter two user defined moving averages, each with their own length, source, and type, to create the visualized ribbon, as well as the option for an additional three separate moving averages, all with their own length, source, and type enabling MA(X) the flexibility to be used for any one of your favorite moving average strategies or in conjunction with another for added confluence.
Additionally, MA(X) also has a built in moving average ‘Forecasting’ feature, which calculates and projects the trajectory of each moving average. For added flexibility, the forecasting feature has 4 bias settings, (Neutral, Bullish, Bearish, Auto). The first three bias settings are rather self explanatory, and the “Auto” bias setting will in a nutshell automatically determine the current market cycle, and then apply the correct bias setting to use.
By default, the indicator is setup with the settings for the Daily SMA strategy ’10 SMA + 22 SMA’ as well as the Daily EMA+SMA strategy “21 EMA”, but can be used on any timeframe with any settings needed.
Enjoy!
Multi MA CloudsEMA Clouds are used for identifying trends. It helps to see moving averages as in a range especially when you look at them in Micro time frames like 1/5/10/15/30 mins. So these Clouds could be used for Intraday trading for identifying trends and pullbacks.
For example, on a 10min chart, once you see a parabolic move, don't take trade until the bar touches 5/13 or 8/9 EMA clouds.
There are other EMA cloud scripts available but this one gives you option to choose MA Type and Source in addition to providing all well known MA range in one script. You can modify the MA length as you wish. So you can disable one you don't want to see on the chart.
Please look at my other scripts at www.tradingview.com

Combined EMA & MA crossovers [CDI]Implementation of the strategy of moving averages crossings combining two fast and two slow that are used to confirm the entry.
The purpose is to be able to quickly see a backtesting of the strategy by easily configuring the profit / loss percentage. In this script the profit percentage is used for the loss percentage as well.
Additionally you can see the moving averages all in a single chart tool.
In the community to which I belong, this strategy is used in daily candles, especially for swing trading, but it can be used in different time frames.
WARNING:
- For purpose educate only
- The entries are used under your responsibility


SRSI/CCI :: ALLinPower v10.0
Everything you see in this indicator has beed designed with purpose to ease your trading with visual technical analysis of the market. It pulls data from 7 different TimeFrames and it can not be more simpler visual representation of its calculations when applied on chart.
When applied on chart, you will see two sets of WAVES. First set is made out of SRSI calculation and the second is made out of CCI calculation. Both of them follows the same rules.
Background GREEN/RED wave is made out of Multiple Timeframes and it represents a TREND. GREEN for LONG, RED for SHORT trend.
Over the background wave there is a wave made of current TimeFrame data and its main purpose is to see when the POWER of certain direction will diminish. The less time little wave stays in current trend the more likely is that it will change the trend based on lack of power the market is getting in certain direction.
HOW TO USE IT?
Rule 1.
TIMEFRAMES
Choose the best TimeFrame for the job. I use: 1min, 2min, 3min, 5min, 8min, 13min, 21min, 34min or 56min (golden ratio). You can also pick a different TF but only to up to 1h TF chart as it does not work well with TF over 1h. Smaller TF is used for SCALPING of DAY TRADING higher TF is used for SWING TRADING. You get the picture?
Rule 2
TO ENTER BUY/LONG POSITION: When big trend wave is below the middle line and coloured in RED and little wave just entered the area and exits it very soon after. Basically when RED straight line gets smaller and smaller (the POWER of SHORT diminishes) it is a sign for LONG.
TO ENTER SELL/SHORT POSITION: When big trend wave is over the middle line and coloured in GREEN and little wave just entered the area and exits it very soon after. Basically when GREEN straight line gets smaller and smaller (the POWER of LONG diminishes) it is a sign for SHORT.
To ease yourself the spotting of this instances just follow the GREEN/RED dots and use ALERTS (choose BUY POWER for LONG signals or choose SELL POWER for SHORT signals) to make yourself free from staring at a computer/mobile all the time and just wait for a signal.
Rule 3
CAUTION
Do not rush to enter a position and try to predict what indicator will do next. It does not end well.
Be aware you are not exiting a position in panic that would be too soon or even worse, you get married to bad trade and you are not exiting even though you should exit by many signals you get.
Use risk management strategy to protect your capital.
Follow the rules and make your trading easier and better.

RSI :: ALLinDivergence v10.0
Everything you see in this indicator has been designed with a single purpose, to ease your trading with simplify visual technical analysis of the market. It pulls data from 7 different TimeFrames and it can not be more simpler visual representation of its calculations when applied on chart.
When applied on chart, you will see GREEN/RED alternating MTF RSI line and its 70 overbought area and its 30 oversold area. There is a gentle purple colour line in the background which represents RSI line of the current TF (it is not crucial but it helps to know why MTF line turns RED or turns GREEN (crossing of those two).
HOW TO USE IT?
Rule 1.
TIMEFRAMES
Choose the best TimeFrame for the job. I use: 1min, 2min, 3min, 5min, 8min, 13min, 21min, 34min or 56min (golden ratio). You can also pick a different TF but only to up to 1h TF chart as it does not work well with TF over 1h. Smaller TF is used for SCALPING of DAY TRADING higher TF is used for SWING TRADING. You get the picture?
Rule 2
TO ENTER BUY/LONG POSITION: search for HigherLows on RSI MTF GREEN/RED LINE when it is coloured RED. To enter a position it should be confirmed with AALERT :: ALLinDivergence v 10.0 that "GREEN" Divergence is emerging.
TO ENTER SELL/SHORT POSITION: search for LowerHighs on RSI MTF GREEN/RED LINE when it is coloured GREEN. To enter a position it should be confirmed with ALERT :: ALLinDivergence v 10.0 that "RED" Divergence is emerging.
Rule 3
EXIT FROM BUY/LONG POSITION: search for HigherLows on RSI MTF GREEN/RED LINE.
EXIT FROM SELL/SHORT POSITION: search for LowerHighs on RSI MTF GREEN/RED LINE.
Rule 4
CAUTION
Do not rush to enter a position and try to predict what indicator will do next. It does not end well.
Be aware you are not exiting a position in panic that would be too soon or even worse, you get married to bad trade and you are not exiting even though you should exit by many signals you get.
Use risk management strategy to protect your capital.
Follow the rules and make your trading easier and better.

ALERTS :: ALLinDivergence v10.0
Everything you see in this indicator has a designated purpose to ease your trading with predefined ALERTS of high quality. It pulls data from 7 different TimeFrames and it can not be more simpler visual representation of its calculations when applied on chart.
When applied on chart, it will colour your chart BARS/CANDLE to the colour PURPLE as that colour is well known colour of Relative Strength Indicator line that indicates overbought or oversold area. RSI is used as a main source of information/data for this indicator.
Second reason of colour PURPLE is that it cancels all the noise that default green/red bars have.
This indicator also has GREEN/RED colouring of BARS/CANDLES and they appear when something crucial is happening in the market. That something needs to be checked ASAP. This green/red coloured bars are just there to remind you that something can happen and it does not mean that market would actually change direction it is just a "friendly warning" you can use when creating alerts.
The best thing about this indicator is those full coloured GREEN/RED LITTLE DOTS.
They represent DIVERGENCES emerging and possible actual change of market direction. To be sure, you need to analyse your chart more in depth any way you prefer to get your needed confirmations. To do that, use your strategy that you have been using when trading up until now or even better, use indicator that I made and is called RSI :: ALLinDivergence v 10.0 -> It is a visual representation of ALERT :: ALLinDivergence v 10.0 indicator signals. Very easy to analyse in minutes.
HOW TO USE IT?
Rule 1.
TIMEFRAMES
Choose the best TimeFrame for the job. I use: 1min, 2min, 3min, 5min, 8min, 13min, 21min, 34min or 56min (golden ratio). You can also pick a different TF but only to up to 1h TF chart as it does not work well with TF over 1h. Smaller TF is used for SCALPING of DAY TRADING higher TF is used for SWING TRADING. You get the picture?
Rule 2
To ENTER A POSITION
Find the best TF that suits your needs. That depends on your trading style (day trading, scalping, swing trading, ect.). To know which TF is the best for you you also need to look for a good quality signals when looking the chart in the past (visual BACKTESTING). Signals from past should yield positive results.
When you wish to trade certain pair, find the best TF and from there you need to "Create Alert". Choose this indicator when creating alerts and from dropdown menu pick "GREEN" for Divergence BUY/LONG signals or "RED" Divergence SELL/SHORT signals. Then choose "Greater Than" and change the value to "1" (that will set off the alarm), choose how you want to be notified and then name the ALERT so you will know how it is made.
Do not forget to do your work and analyse your market situation best way you can and get needed confirmations before doing anything about it.
Rule 3
TO EXIT A POSITION
From the same TF as Divergence alerts are made from (Rule 2), you can make alerts that are just a "friendly warning" that something is happening on the market you are in an opened position. Instead of picking GREEN or RED from dropdown menu when creating alerts, you need to pick GREEN BARS or RED BARS and the rest is the same as with rule 2.
Rule 4
CONFIRMATIONS
Help yourself with any type of analysis you need to get the confirmations you need to enter or exit the position. Use the style you always have up until now. Or find a better one that is quicker and with good yield.
There is a great option that can change your way of thinking about trading and it is called RSI :: ALLinDivergence v 10.0 indicator that is used as a visual representation of ALERTS indicator. It takes literally minutes to do whole analysis - remember it uses data from 7 different TimeFrames and it is really good! Just find LowerHighs of RSI curve for SHORT or HigherLows for LONG.
