Slovenský Hybrid (VWAP, Multi MA)Slovenský Hybrid (VWAP, Multi MA) – JS VWAP/MA
Tento indikátor som vytvoril ja, Ján Salma – mentor Akadémie , špeciálne pre slovenský trh. Je navrhnutý tak, aby ho bolo možné používať aj na bezplatnej verzii TradingView a zároveň aby ostal priestor na pridanie ďalších vlastných indikátorov.
👉 Čoskoro pribudne nová verzia, ktorá bude obsahovať ešte viac nástrojov v jednom balíku.
Funkcie a nastavenia:
Indikátor kombinuje viacero kľúčových prvkov technickej analýzy do jedného nástroja:
Multi Moving Averages (MA)
Môžeš zobraziť až 4 rôzne kĺzavé priemery.
Každý MA sa dá zapnúť alebo vypnúť podľa potreby.
Možnosť nastaviť dĺžku periody.
Výber typu: SMA alebo EMA.
Nastavenie zdroja ceny (Close, Open, High, Low, atď.).
Možnosť upraviť farbu a hrúbku čiary pre lepší prehľad.
VWAP (Volume Weighted Average Price)
VWAP sa dá zapnúť alebo vypnúť.
Nastavenie farby a hrúbky čiary.
Výhody indikátora
Jednoduché a prehľadné nastavenia v slovenskom jazyku.
Ideálne pre začiatočníkov aj pokročilých traderov.
Kombinuje viacero indikátorov do jedného, čo šetrí miesto v grafe.
Umožňuje flexibilne prispôsobiť vzhľad podľa vlastného štýlu obchodovania.
________________________________________
✅ Tento nástroj je výbornou pomôckou pre každého, kto sa chce zamerať na čistý graf, prehľadné nastavenia a efektívne využitie TradingView.
Slovak Hybrid (VWAP, Multi MA) – JS VWAP/MA
This indicator was created by Ján Salma – mentor of the Slovak Academy , especially for the Slovak market. It is designed to work even on the free version of TradingView, while keeping space for additional indicators on your chart.
👉 A new version with more tools combined in one indicator is coming soon!
Features and Settings:
Multi Moving Averages (MA)
Up to 4 customizable moving averages.
Each MA can be turned on/off individually.
Choose between EMA or SMA.
Adjustable length, source, line width, and color.
VWAP (Volume Weighted Average Price)
Can be enabled/disabled.
Adjustable line thickness and color.
Benefits:
Simple and intuitive settings in Slovak language.
Great for both beginners and advanced traders.
Combines multiple indicators into one → saves chart space.
Fully customizable look to fit your trading style.
________________________________________
✅ A clean, flexible, and easy-to-use indicator for every trader who wants efficiency and clarity in their charts.
ממוצע נע פשוט (SMA)

RSI ADX Bollinger Analysis High-level purpose and design philosophy
This indicator — RSI-ADX-Bollinger Analysis — is a compact, educational market-analysis toolkit that blends momentum (RSI), trend strength (ADX), volatility structure (Bollinger Bands) and simple volumetrics to provide traders a snapshot of market condition and trade idea quality. The design philosophy is explicit and layered: use each component to answer a different question about price action (momentum, conviction, volatility, participation), then combine answers to form a more robust, explainable signal. The mashup is intended for analysis and learning, not automatic execution: it surfaces the why behind signals so traders can test, learn and apply rules with risk management.
________________________________________
What each indicator contributes (component-by-component)
RSI (Relative Strength Index) — role and behavior: RSI measures short-term momentum by comparing recent gains to recent losses. A high RSI (near or above the overbought threshold) indicates strong recent buying pressure and potential exhaustion if price is extended. A low RSI (near or below the oversold threshold) indicates strong recent selling pressure and potential exhaustion or a value area for mean-reversion. In this dashboard RSI is used as the primary momentum trigger: it helps identify whether price is locally over-extended on the buy or sell side.
ADX (Average Directional Index) — role and behavior: ADX measures trend strength independently of direction. When ADX rises above a chosen threshold (e.g., 25), it signals that the market is trending with conviction; ADX below the threshold suggests range or weak trend. Because patterns and momentum signals perform differently in trending vs. ranging markets, ADX is used here as a filter: only when ADX indicates sufficient directional strength does the system treat RSI+BB breakouts as meaningful trade candidates.
Bollinger Bands — role and behavior: Bollinger Bands (20-period basis ± N standard deviations) show volatility envelope and relative price position vs. a volatility-adjusted mean. Price outside the upper band suggests pronounced extension relative to recent volatility; price outside the lower band suggests extended weakness. A band expansion (increasing width) signals volatility breakout potential; contraction signals range-bound conditions and potential squeeze. In this dashboard, Bollinger Bands provide the volatility/structural context: RSI extremes plus price beyond the band imply a stronger, volatility-backed move.
Volume split & basic MA trend — role and behavior: Buy-like and sell-like volume (simple heuristic using close>open or closeopen) or sell-like (close1.2 for validation and compare win rate and expectancy.
4. TF alignment: Accept signals only when higher timeframe (e.g., 4h) trend agrees — compare results.
5. Parameter sensitivity: Vary RSI threshold (70/30 vs 80/20), Bollinger stddev (2 vs 2.5), and ADX threshold (25 vs 30) and measure stability of results.
These exercises teach both statistical thinking and the specific failure modes of the mashup.
________________________________________
Limitations, failure modes and caveats (explicit & teachable)
• ADX and Bollinger measures lag during fast-moving news events — signals can be late or wrong during earnings, macro shocks, or illiquid sessions.
• Volume classification by open/close is a heuristic; it does not equal TAPEDATA, footprint or signed volume. Use it as supportive evidence, not definitive proof.
• RSI can remain overbought or oversold for extended stretches in persistent trends — relying solely on RSI extremes without ADX or BB context invites large drawdowns.
• Small-cap or low-liquidity instruments yield noisy band behavior and unreliable volume ratios.
Being explicit about these limitations is a strong point in a TradingView description — it demonstrates transparency and educational intent.
________________________________________
Originality & mashup justification (text you can paste)
This script intentionally combines classical momentum (RSI), volatility envelope (Bollinger Bands) and trend-strength (ADX) because each indicator answers a different and complementary question: RSI answers is price locally extreme?, Bollinger answers is price outside normal volatility?, and ADX answers is the market moving with conviction?. Volume participation then acts as a practical check for real market involvement. This combination is not a simple “indicator mashup”; it is a designed ensemble where each element reduces the others’ failure modes and together produce a teachable, testable signal framework. The script’s purpose is educational and analytical — to show traders how to interpret the interplay of momentum, volatility, and trend strength.
________________________________________
TradingView publication guidance & compliance checklist
To satisfy TradingView rules about mashups and descriptions, include the following items in your script description (without exposing source code):
1. Purpose statement: One or two lines describing the script’s objective (educational multi-indicator market overview and idea filter).
2. Component list: Name the major modules (RSI, Bollinger Bands, ADX, volume heuristic, SMA trend checks, signal tracking) and one-sentence reason for each.
3. How they interact: A succinct non-code explanation: “RSI finds momentum extremes; Bollinger confirms volatility expansion; ADX confirms trend strength; all three must align for a BUY/SELL.”
4. Inputs: List adjustable inputs (RSI length and thresholds, BB length & stddev, ADX threshold & smoothing, volume MA, table position/size).
5. Usage instructions: Short workflow (check TF alignment → confirm participation → define stop & R:R → backtest).
6. Limitations & assumptions: Explicitly state volume is approximated, ADX has lag, and avoid promising guaranteed profits.
7. Non-promotional language: No external contact info, ads, claims of exclusivity or guaranteed outcomes.
8. Trademark clause: If you used trademark symbols, remove or provide registration proof.
9. Risk disclaimer: Add the copy-ready disclaimer below.
This matches TradingView’s request for meaningful descriptions that explain originality and inter-component reasoning.
________________________________________
Copy-ready short publication description (paste into TradingView)
Advanced RSI-ADX-Bollinger Market Overview — educational multi-indicator dashboard. This script combines RSI (momentum extremes), Bollinger Bands (volatility envelope and band expansion), ADX (trend strength), simple SMA trend bias and a basic buy/sell volume heuristic to surface high-quality idea candidates. Signals require alignment of momentum, volatility expansion and rising ADX; volume participation is displayed to support signal confidence. Inputs are configurable (RSI length/levels, BB length/stddev, ADX length/threshold, volume MA, display options). This tool is intended for analysis and learning — not for automated execution. Users should back test and apply robust risk management. Limitations: volume classification here is a heuristic (close>open), ADX and BB measures lag in fast news events, and results vary by instrument liquidity.
________________________________________
Copy-ready risk & misuse disclaimer (paste into description or help file)
This script is provided for educational and analytical purposes only and does not constitute financial or investment advice. It does not guarantee profits. Indicators are heuristics and may give false or late signals; always back test and paper-trade before using real capital. The author is not responsible for trading losses resulting from the use or misuse of this indicator. Use proper position sizing and risk controls.
________________________________________
Risk Disclaimer: This tool is provided for education and analysis only. It is not financial advice and does not guarantee returns. Users assume all risk for trades made based on this script. Back test thoroughly and use proper risk management.

Liquidity Lines 2.0Liquidity Lines Indicator Description:
This indicator detects points of liquidity based on reversals in price action. It simulates simple moving average (SMA) candles and identifies when raw price candles engulf either the low of a bullish SMA candle or the high of a bearish SMA candle. The liquidity point is then placed at the high of the bearish SMA candle or the low of the bullish SMA candle. These levels often correspond to areas where many traders place stop-loss orders and can provide insight into where “smart money” might be hunting liquidity.
Features and Alerts:
Liquidity Lines automatically track upper and lower liquidity levels and plot them as customizable horizontal lines on the chart. Users can adjust line length, color, width, and style, and choose whether lines extend to the right. The indicator also detects when these liquidity levels are “swept” by price and triggers alerts in real time, allowing traders to be notified of potential stop-loss hunts or key market reactions as they happen. This makes it easy to monitor critical liquidity zones without constantly watching the chart.
How to Use Strategically:
Traders can use these liquidity points to anticipate potential price reactions. For example, if price approaches a lower liquidity line from above, it may act as support or a zone where stop orders are being triggered. Conversely, an upper liquidity line may act as resistance or a trigger zone for stops above the market. Combining these levels with your existing market structure, trend analysis, or confirmation signals can help identify high-probability entries, exits, and areas where smart money activity may occur.

EMA/SMA Zones 9, 21, 30, 50, 100, 200 + othersMeant for swing trading on the daily chart, feel free to copy and remove/add sections as you wish (Used chatGPT for a lot of it).

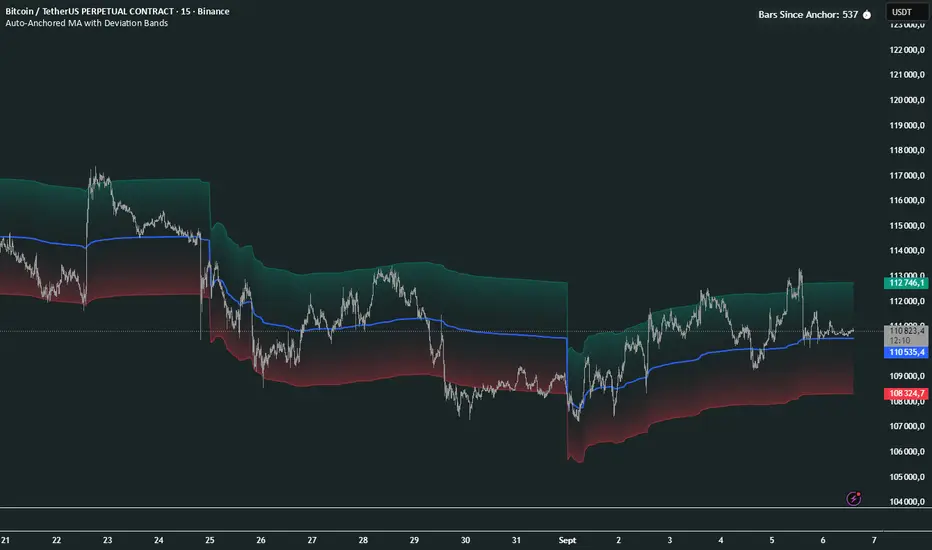
Auto-Anchored MA with Deviation BandsAuto-Anchored MA with Deviation Bands
✨ Features
📈 Auto-Anchored MA: Calculates moving averages (EMA, SMA, EWMA, WMA, VWAP, TEMA) anchored to user-defined periods (Hour, Day, Week, etc.).📏 Deviation Bands: Plots upper/lower bands using Percentage or Standard Deviation modes for volatility analysis.⚙️ Customizable Timeframes: Choose anchor periods from Hour to Year for flexible trend analysis.🎨 Visuals: Displays MA and bands with gradient fills, customizable colors, and adjustable display bars.⏱️ Countdown Table: Shows bars since the last anchor for easy tracking.🛠️ Smoothing: Applies smoothing to bands for cleaner visuals.
🛠️ How to Use
Add to Chart: Apply the indicator on TradingView.
Configure Inputs:
Anchor Settings: Select anchor period (e.g., Day, Week).
MA Settings: Choose MA type (e.g., VWAP, TEMA).
Deviation Settings: Set deviation mode (Percentage/Std Dev) and multipliers.
Display Settings: Adjust bars to display, colors, and gradient fill.
Analyze: View MA, deviation bands, and countdown table on the chart.
Track Trends: Use bands as dynamic support/resistance and monitor anchor resets.
🎯 Why Use It?
Dynamic Analysis: Auto-anchors MA to key timeframes for adaptive trend tracking.
Volatility Insight: Deviation bands highlight potential breakouts or reversals.
Customizable: Tailor MA type, timeframe, and visuals to your trading style.
User-Friendly: Clear visuals and countdown table simplify analysis.
📝 Notes
Ensure sufficient bars for accurate MA and deviation calculations.
Gradient fill enhances readability but can be disabled for simplicity.
Best used with complementary indicators like RSI or Bollinger Bands for robust strategies.
Happy trading! 🚀📈

SMA MAD SuperTrend | OquantThe SMA MAD SuperTrend | Oquant is an trend-following indicator designed to help traders identify potential trend directions and reversals using a unique combination of a Simple Moving Average (SMA), Mean Absolute Deviation (MAD), and a SuperTrend mechanism. This script aims to provide clear visual signals for trend entries and exits, making it suitable for traders looking to capture trends.
This indicator innovatively combines the smoothing properties of an SMA with the volatility-adaptive qualities of MAD to create dynamic SuperTrend bands. Unlike traditional SuperTrend indicators that rely on Average True Range (ATR) for volatility, this script uses Mean Absolute Deviation(MAD) to measure the average absolute deviation from the mean price, providing a different perspective on price volatility. The result is a SuperTrend system that adapts to market conditions with a focus on price deviation, offering a unique tool for trend detection.
Components and Calculations
Simple Moving Average (SMA):
The SMA is a widely used indicator that calculates the average of a specified number of closing prices. It smooths price data to identify the overall trend direction. In this script, the SMA serves as the baseline for calculating dynamic upper and lower bands.
Mean Absolute Deviation (MAD):
MAD measures the average absolute deviation of the price from its mean. It quantifies volatility by calculating how far prices deviate from the mean price, offering an alternative to ATR.
SuperTrend Mechanism:
This SuperTrend indicator generates dynamic upper and lower bands around the Simple Moving Average (SMA) using mean absolute deviation as measure of volatility.
It tracks trend direction by comparing the close price to the bands:
If the price crosses above the upper band, the trend turns bullish, and the SuperTrend follows the lower band.
If the price crosses below the lower band, the trend turns bearish, and the SuperTrend follows the upper band.
The bands adjust based on their previous values, updating only when the price crosses a band or the band shifts in the correct direction, reducing false signals and ensuring stable trend detection.
How to Use the Indicator
Trend Signals:
Green Line: Indicates a bullish trend (price above the SuperTrend line).
Purple Line: Indicates a bearish trend (price below the SuperTrend line).
Bar and Candle Coloring: Bars and candles are colored green for bullish trends and purple for bearish trends, making it easy to visualize trend direction.
Filled Areas: The area between the price and the SuperTrend line is filled with transparent colors (green for bullish, purple for bearish) to highlight trend.
Inputs:
Source: Choose the price data for calculations.
SMA Length: Adjust the period for the SMA. Longer periods smooth the trend further.
MAD Length: Set the period for MAD calculation. Shorter periods make the MAD more sensitive.
Factor: Control the distance of the SuperTrend bands from the SMA. Higher values widen the bands, reducing sensitivity to price fluctuations.
Alerts:
The script includes alert conditions for trend changes:
SMA MAD SuperTrend Long: Triggered when the trend turns bullish.
SMA MAD SuperTrend Short: Triggered when the trend turns bearish.
Set up alerts in TradingView to receive notifications for these conditions.
Why Use This Script?
The SMA MAD SuperTrend | Oquant offers a fresh take on trend-following by integrating SMA as baseline and MAD for volatility measurement, providing an alternative to ATR-based SuperTrend indicators. Its clear visual signals, customizable inputs, and alert conditions make it versatile for traders of all levels.
⚠️ Disclaimer: This indicator is intended for educational and informational purposes only. Trading/investing involves risk, and past performance does not guarantee future results. Always test and evaluate indicators/strategies before applying them in live markets. Use at your own risk.

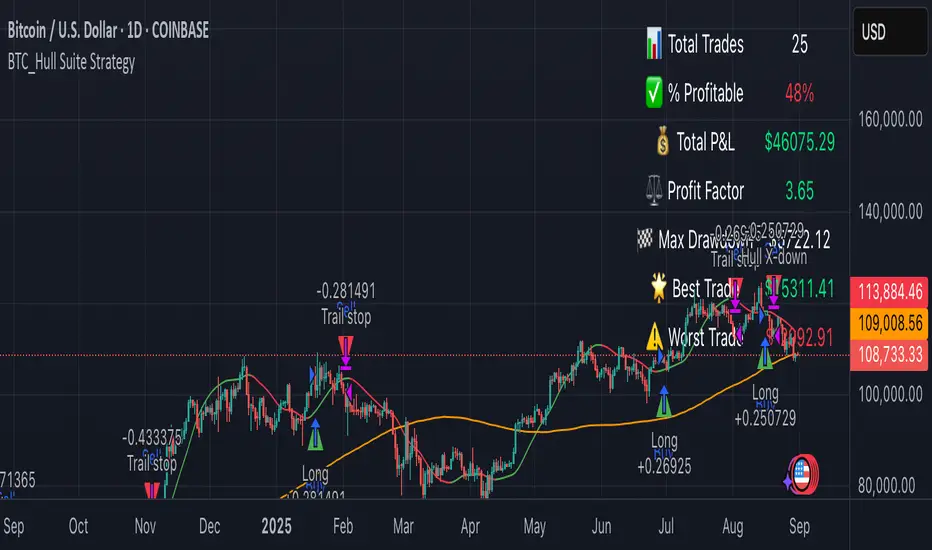
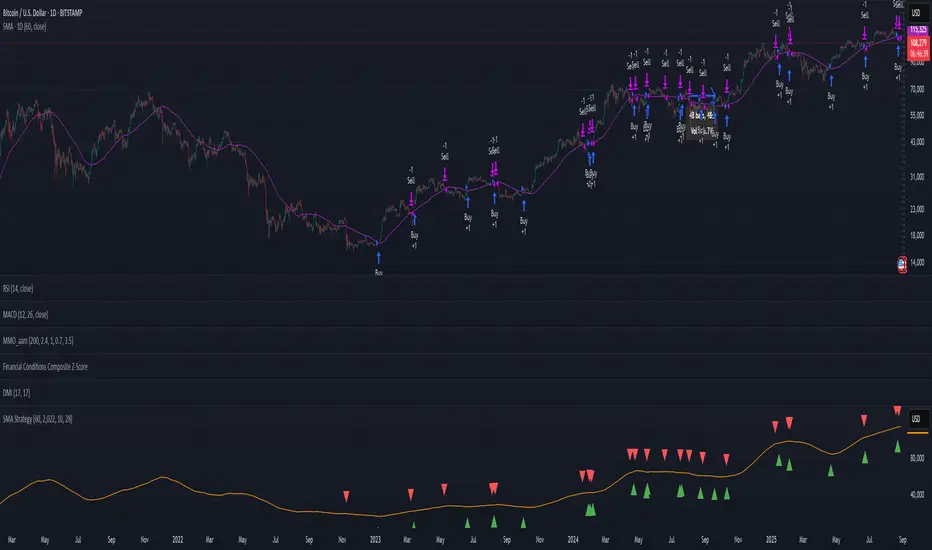
BTC_Hull Suite StrategyOverview
BTC_Hull Suite Strategy is a trend-following system designed to keep drawdowns modest while staying exposed during genuine uptrends. It uses the Hull Moving Average (HMA) for fast, low-lag trend turns, a long-term SMA filter to avoid chop, and a percentage trailing stop to protect gains.
🔧 What the strategy includes
- Hull Moving Average (HMA) with configurable length (default 55)
- SMA filter (default 130) to trade only with higher-timeframe bias
- Trailing stop in percent (default 5%) based on the running peak of close
- Execution model: signals are evaluated on the previous bar and entries are placed at the next bar’s open (TradingView default)
📈 How it works:
✅ Entry (Long):
Detects a bullish Hull turn by comparing the current HMA to its value 3 bars ago:
h > h3 and h <= h3 → HMA just turned up on the prior bar
The SMA filter must confirm: close > sma
If both are true (and within the date window), a long is opened next bar at the open
❌ Exit:
Hull turn down: h < h3 and h >= h3 , or
Trailing stop: price closes below peak * (1 – trailingPct)
Either condition closes the position at the current bar’s close
Notes:
pyramiding = 1 → allows one add-on (maximum two concurrent long positions)
Position sizing defaults to 20% of equity per entry (adjustable in Properties)
Who is this for?
This strategy is tailored for Bitcoin traders (spot or perpetuals) who want a rules-based, low-lag trend system with built-in drawdown protection.
It works best on Daily or 4H charts, but parameters can be adapted for other timeframes.
⚠️ Disclaimer
This strategy is provided for educational and research purposes only.
It is not financial advice. Markets are risky — always test on your own data, include realistic fees/slippage, and forward-test before using real capital.
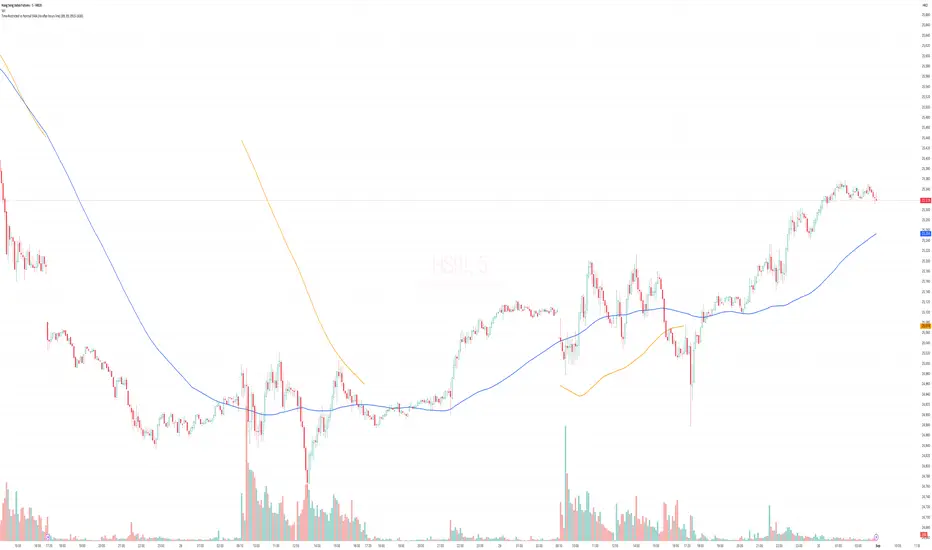
Time-Restricted vs Normal SMA This script plots two Simple Moving Averages (SMAs):
Restricted SMA (Orange): A moving average that only uses data within a defined intraday session (default: 09:15 – 16:30). It ignores all price data outside this session and does not draw a line during off-hours.
Normal SMA (Blue): A standard rolling SMA that runs continuously using all bars, without time restrictions.
The restricted SMA is useful for traders who only want to analyze moving averages during active market hours, such as stock exchange sessions or custom trading windows. By filtering out after-hours and pre-market activity, this indicator helps align signals more closely with official trading sessions.
Customization:
Adjust the lengths of both SMAs.
Modify the session hours to match your market or strategy.
This tool is designed for intraday traders who want greater control over how moving averages respond to session-specific data.
Simple SMA StrategySimple strategy to buy based on closing above SMA, and sell based on closing below SMA.
You can change the SMA value and your start date to customize the strategy for your initial entry date and SMA value. SMA is based on chart time frame.
Vietnamese: Swing Low Detection with SMA Bands & BackgroundThis script detects **swing lows** using a dynamic SMA-based logic and visually highlights them on the chart.
Features
Customizable Moving Averages: Supports multiple MA types (SMA, EMA, WMA, RMA, HMA, DEMA, TEMA, VWMA).
Swing Low Visualization: Identifies swing lows when price closes below the SMA of lows and exits once price trades above the SMA of highs.
Smart Rectangles: Marks detected swing lows with labeled boxes for clear visual reference.
Background Highlights**: Dynamically shades the chart background when price breaks below recent swing lows, helping traders spot potential breakdown zones.
Configurable Parameters: Period length, rectangle length, and MA source can all be tuned.
Use Cases
Spot breakdown/bearish continuation signals when price closes under recent lows.
Combine with higher timeframe trend analysis for confluence.
Notes
* This tool is designed for **visual analysis** and is not a standalone buy/sell signal.
* Works best when combined with broader trend analysis, support/resistance levels, and volume.

Alpha v1Heiken Ashi based indicator using moving average crossovers combined with LuxAlgo Ultimate RSI with custom weighting to trigger buy and sell signals. SMAs can be toggled under the style tab of indicator settings.
For 30m time frame SMAs:
First Period = 9
Second Period = 21
Third Period = 100
All other time frame SMAs:
First Period = 21
Second Period = 50
Third Period = 200


BPS Multi-MA 5 — 22/30, SMA/WMA/EMA# Multi-MA 5 — 22/30 base, SMA/WMA/EMA
**What it is**
A lightweight 5-line moving-average ribbon for fast visual bias and trend/mean-reversion reads. You can switch the MA type (SMA/WMA/EMA) and choose between two ways of setting lengths: by monthly “session-based” base (22 or 30) with multipliers, or by entering exact lengths manually. An optional info table shows the effective settings in real time.
---
## How it works
* Calculates five moving averages from the selected price source.
* Lengths are either:
* **Multipliers mode:** `Base × Multiplier` (e.g., base 22 → 22/44/66/88/110), or
* **Manual mode:** any five exact lengths (e.g., 10/22/50/100/200).
* Plots five lines with fixed legend titles (MA1…MA5); the **info table** displays the actual type and lengths.
---
## Inputs
**Length Mode**
* **Multipliers** — choose a **Base** of **22** (≈ trading sessions per month) or **30** (calendar-style, smoother) and set **×1…×5** multipliers.
* **Manual** — enter **Len1…Len5** directly.
**MA Settings**
* **MA Type:** SMA / WMA / EMA
* **Source:** any series (e.g., `close`, `hlc3`, etc.)
* **Use true close (ignore Heikin Ashi):** when enabled, the MA is computed from the underlying instrument’s real `close`, not HA candles.
* **Show info table:** toggles the on-chart table with the current mode, type, base, and lengths.
---
## Quick start
1. Add the indicator to your chart.
2. Pick **MA Type** (e.g., **WMA** for faster response, **SMA** for smoother).
3. Choose **Length Mode**:
* **Multipliers:** set **Base = 22** for session-based monthly lengths (stocks/FX), or **30** for heavier smoothing.
* **Manual:** enter your exact lengths (e.g., 10/22/50/100/200).
4. (Optional) On **Heikin Ashi** charts, enable **Use true close** if you want the lines based on the instrument’s real close.
---
## Tips & notes
* **1 month ≈ 21–22 sessions.** Using 30 as “monthly” yields a smoother, more delayed curve.
* **WMA** reacts faster than **SMA** at the same length; expect earlier signals but more whipsaws in chop.
* **Len = 1** makes the MA track the chosen source (e.g., `close`) almost exactly.
* If changing lengths doesn’t move the lines, ensure you’re editing fields for the **active Length Mode** (Multipliers vs Manual).
* For clean comparisons, use the **same timeframe**. If you later wrap this in MTF logic, keep `lookahead_off` and handle gaps appropriately.
---
## Use cases
* Trend ribbon and dynamic bias zones
* Pullback entries to the mid/slow lines
* Crossovers (fast vs slow) for confirmation
* Volatility filtering by spreading lengths (e.g., 22/44/88/132/176)
---
**Credits:** Built for clarity and speed; designed around session-based “monthly” lengths (22) or smoother calendar-style (30).

Market Internal Strength (DJI/Nasdaq/S&P)Market Health Dow, Nasdaq & S\&P 500 Breadth
Track the true internal health of the US market's three most important indices the Dow Jones Industrial Average (DJI), the Nasdaq 100 (NDX), and the S\&P 500 (SPX).
Price action alone can be deceiving. A rising index might be driven by only a handful of mega-cap stocks, masking underlying weakness. This indicator provides a crucial look "under the hood" to measure the market's true breadth.
It visualizes the percentage of stocks within each index that are trading above their key moving averages (5, 20, 50, 100, 150, and 200-day). This allows you to instantly gauge whether a market trend is broadly supported by the majority of its constituent stocks.
Key Features
* Covers 3 Major US Indices Seamlessly switch your analysis between the Dow Jones, Nasdaq 100, and S\&P 500.
* Complete Breadth Picture Six MA periods offer a full view, from short-term momentum (5D, 20D) to the long-term institutional trend (150D, 200D).
* Fully Customizable Toggle the visibility of any line and adjust overbought/oversold levels to fit your personal strategy.
How to Use
1. Extreme Readings (Overbought/Oversold)
* Above 80% Signals a very strong, potentially overbought market. Caution is advised as a pullback could be near.
* Below 20% Signals a deeply oversold market, often indicating capitulation and potential buying opportunities.
2. Divergence (Powerful Warning Signal)
* Bearish The index price makes a new high, but this indicator makes a lower high. This warns that the rally is not broad-based and may be losing steam.
* Bullish The index price makes a new low, but this indicator makes a higher low. This suggests internal strength is building and a bottom may be forming.
3. Trend Confirmation
When the long-term lines (150D, 200D) remain high (e.g., \> 50%), the primary market trend is healthy and confirmed.

PowerTrend Pro Strategy – Gold OptimizedTired of false signals on Gold?
PowerTrend Pro combines VWAP, Supertrend, RSI, and smart MA filters with trailing stops & break-even logic to deliver high-probability trades on XAUUSD.
PowerTrend Pro Strategy is a professional-grade trading system designed to capture high-probability swing and intraday opportunities on XAUUSD (Gold) and other volatile markets.
🔑 Core Features
VWAP Anchoring – institutional fair value reference to filter trades.
Supertrend (ATR-based) – adaptive trend filter tuned for Gold’s volatility.
Multi-Timeframe RSI – confirms momentum alignment across intraday and higher timeframe.
EMA + SMA Combo – ensures trades follow strong directional bias, reducing false signals.
Dynamic Risk Management
Adjustable Take Profit / Stop Loss (%)
Trailing Stop that locks in profits on extended moves
Break-Even Logic (stop loss moves to entry once price is in profit)
⚡ Gold-Tuned Presets
XAUUSD 1H → tighter TP/SL & faster entries for active intraday trading.
XAUUSD 4H → wider ATR filter & trailing stops to capture bigger swings.
Generic Mode → works on Forex, Indices, and Crypto (fully customizable).
🎯 Why It Works
Gold is notoriously volatile — quick spikes wipe out weak strategies. PowerTrend Pro solves this by combining:
✅ Institutional bias (VWAP)
✅ Adaptive trend filter (Supertrend)
✅ Momentum confirmation (RSI MTF)
✅ Robust trend structure (EMA + SMA)
✅ Smart exits (TP, SL, trailing & breakeven)
This multi-layer confirmation makes entries stronger and keeps risk under control.
🛠️ Usage
Add the strategy to your chart.
Choose a preset (XAUUSD 1H, 4H, or Generic).
Run Strategy Tester for performance metrics.
Optimize TP/SL and ATR values for your broker & market conditions.
🔥 Pro Tip: Combine this strategy with a session filter (London/NY overlap) or volume confirmation to boost accuracy in Gold.

FUMO 200 MagnetWhat it does
FUMO Magnet measures how far price has stretched away from its long-term “magnet” — a blended EMA/SMA moving average (200 by default).
It plots a logarithmic deviation (optionally normalized) as an oscillator around zero.
Above 0** → price is above the magnet (stretched up)
Below 0** → price is below the magnet (stretched down)
Guide levels** highlight potential overbought/oversold zones
---
Why log deviation?
Log returns make extremes comparable across cycles and compress exponential trends — especially useful for BTC and other crypto assets.
Normalization modes further adjust the scale, keeping the oscillator readable on any chart.
---
Inputs
**Base**
* Source (default: Close)
* Base Length (default: 200 EMA/SMA)
* EMA vs SMA weight (%) — 0% = pure SMA, 100% = pure EMA, 50% = blended
* EMA smoothing of deviation — acts as a noise filter
**Normalization**
* None (Log Deviation) — raw log stretch in % terms
* Z-score — deviation in standard deviations (σ)
* Robust Z (MAD) — deviation vs median absolute deviation, resistant to outliers
* Tanh squash — smooth nonlinear squash of extremes for compact scale
* Normalization window (for Z / MAD)
* Tanh scale (lower = stronger squash)
* Clamp after normalization — hard cap at ±X
**Levels**
* Guide levels (Upper / Lower) — visual thresholds (default ±12)
* Zero line toggle
---
### How to read it
* **Trend bias**: sustained time above 0 = uptrend, below 0 = downtrend
* **Stretch / mean reversion**: the farther from 0, the higher the reversion risk
* **Cross-checks**: combine with structure (HH/HL, LH/LL), volume, or momentum (RSI, MACD)
---
### Recommended settings by timeframe
**Long-term (1D / 1W)**
* Normalization: None (Log Deviation)
* Base Length: 200
* EMA vs SMA weight: 50% (adjust 35–65% for faster/slower magnet)
* Deviation smoothing: 20 (10–30 range)
* Guide levels: ±12 to ±20
* Use case: cycle extremes, portfolio rebalancing, trim/add logic
**Swing (4H – 1D)**
* Normalization: Z-score
* Window: 200 (100–250)
* Smoothing: 14–20
* Guide levels: ±2σ to ±3σ
* Use case: stretched conditions across regimes; ±3σ is rare, often mean-reverts
**Intraday / Active swing (1H – 4H)**
* Normalization: Robust Z (MAD)
* Window: 200 (150 for faster response)
* Smoothing: 10–16
* Guide levels: ±3 to ±4 (robust units)
* Use case: handles spikes better than σ, fewer false overbought/oversold signals
**Scalping / Universal readability (15m – 1H)**
* Normalization: Tanh squash
* Tanh scale: 6–10 (start with 8)
* Smoothing: 8–12
* Guide levels: ±8 to ±12
* Use case: compact panel across assets and timeframes; not % or σ, but visually consistent
---
### Optional
* Clamp: enable ±20 (or ±25) for strict bounded range (useful for public charts)
---
### Quick setups
**BTC Daily (“cycle view”)**
* Normalization: None
* Blend: 50%
* Smooth: 20
* Levels: ±12–15
**BTC 4H (“swing”)**
* Normalization: Z-score
* Window: 200
* Smooth: 16
* Levels: ±2.5σ to ±3σ
**Alts 1H (“volatile”)**
* Normalization: Robust Z (MAD)
* Window: 200
* Smooth: 12
* Levels: ±3.5 to ±4.5
**Mixed assets 15m (“compact panel”)**
* Normalization: Tanh squash
* Scale: 8
* Smooth: 10
* Levels: ±8–12
* Clamp: ±20

Gravity Trend Line with ±10% Bands_QianYu🌌 Law of Gravity in Stock Trading — by Hu Liyang (胡立阳)—often called the “Godfather of Asian Stock Markets”
✦ Conceptual Origin
The “Law of Gravity” was developed by Mr. Hu Liyang, drawing an analogy between the gravitational pull in physics and the relationship between stock prices and moving averages. It is a medium-term mean reversion theory that helps traders identify rebound opportunities when prices deviate too far from their trend lines.
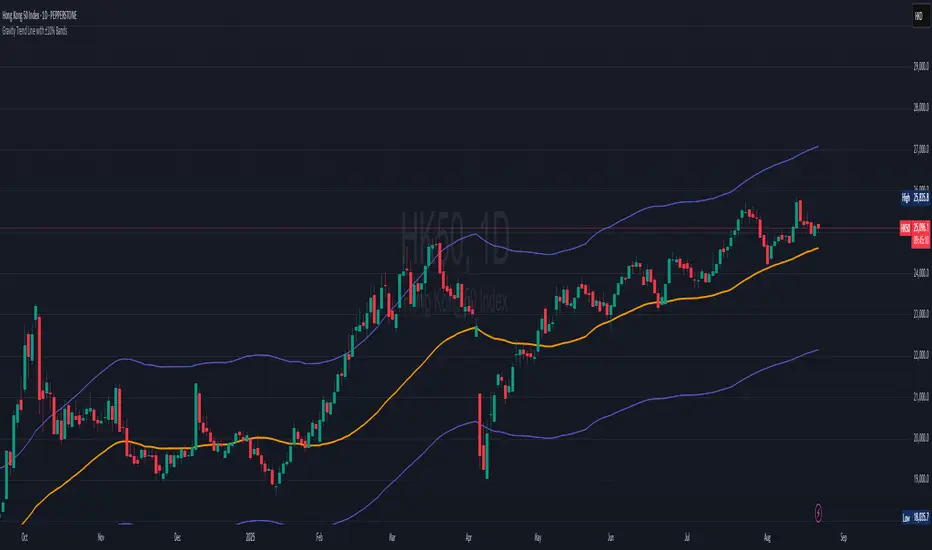
📈 Indicator Summary: Gravity Trend Line with ±10% Bands
🔧 How It's Calculated:
Gravity Trend Line = Average of SMA(30) and SMA(70)
Represents the fair value zone or center of gravity for price over a medium-term period.
Upper Band = Gravity Line + 10%
Lower Band = Gravity Line - 10%
A shaded zone shows the space between the upper and lower bands — your "gravity channel."
🧭How to Use It for Swing Trading (1H and 4H Charts)
1. Trend Bias Filter
If price is consistently above the Gravity Line, the trend bias is bullish.
If price is below the Gravity Line, the bias is bearish.
Use this to align your trades with the prevailing direction on 4H (macro view) and fine-tune entries on 1H.
2.Trade Entry Zones
Long Setup (buy):
Look for price near or just below the lower band (oversold zone).
Combine with bullish candles or reversal indicators (e.g., MACD bullish crossover, RSI < 30 turning up).
Confirmation: price reclaims the lower band or moves toward gravity line.
Short Setup (sell):
Look for price near or just above the upper band (overbought zone).
Combine with bearish confirmation (e.g., MACD bearish crossover, RSI > 70 turning down).
Confirmation: price starts rejecting from upper band toward gravity line.
3. Take Profit / Exit Zones
Partial TP: At the Gravity Line (mean reversion level).
Final TP: At opposite band (if price has strong momentum).
Alternatively, exit on crossback below gravity line after a long, or above it after a short.
4. Avoiding Traps
Avoid entering trades in the middle of the band (around the Gravity Line) unless there's strong breakout confirmation.
Use 4H for trend context, and 1H for entry precision.
Avoid trading against the broader gravity slope:
If gravity line is clearly sloping up, favor longs.
If sloping down, favor shorts.
📘 Example Strategy Workflow:
Timeframe:
Use 4H for directional bias
Use 1H for entries and exits
Example Long Setup (1H Chart):
Price dips below lower band while 4H trend is up.
Bullish candle forms or RSI/MACD confirms momentum shift.
Entry: price closes back above the lower band.
TP1: near gravity line.
TP2: near upper band.
Or, exit when gain hits +8% to +15%, depending on risk appetite.
📌 Final Notes:
This is a mean-reversion + trend confirmation tool — best used with additional confluence (candlestick patterns, volume, divergence).
It works well in ranging to gently trending markets — not ideal for sharp breakouts unless combined with breakout filters.
This indicator is for educational and reference purposes only.
It is not intended to be a recommendation or signal to buy or sell any security.
Use at your own discretion. Always perform your own due diligence before trading.
EMA21/SMA21 + ATR Bands SuiteThe EMA/SMA + ATR Bands Suite is a powerful technical overlay built around one of the most universally respected zones in trading: the 21-period moving average. By combining both the EMA21 and SMA21 into a unified framework, this tool defines the short-term mean with greater clarity and reliability, offering a more complete picture of trend structure, directional bias, and price equilibrium. These two moving averages serve as the central anchor — and from them, the script dynamically calculates adaptive ATR bands that expand and contract with market volatility. Whether you trade breakouts, pullbacks, or reversion setups, the 21 midline combined with ATR extensions offers a powerful lens for real-time market interpretation — adaptable to any timeframe or asset.
🔍 What's Inside?
✅ EMA21 + SMA21 Full Plots and Reduced-History Segments using arrays:
Enable full plots or segmented lines for the most recent candles only with automatic color coding. The reduced-history plots are perfect for reducing clutter on your chart.
✅ ATR Bands (2.5x & 5x):
Adaptive ATR-based volatility envelopes plotted around the midline (EMA21 + SMA21) to indicate:
🔸Potential reversion zones.
🔸Trend continuation breakouts.
🔸Dynamic support/resistance levels.
🔸 Expanding or contracting volatility states
🔸 Trend-aware color changes — yellow when both bands are rising, purple when falling, and gray when direction is mixed
✅ Dual MA Fills (EMA21/SMA21):
Visually track when short-term momentum shifts using a fill between EMA21 and SMA21
✅ EMA5 & EMA200 Labels:
Display anchored labels with rounded values + % difference from price, helping you track short-term + macro trends in real-time.
✅ Intelligent Bar Coloring
Bars are automatically colored based on both price direction and position relative to the EMA/SMA. This provides instant visual feedback on trend strength and structural alignment — no need to second-guess the market tone.
✅ Dynamic Close Line Tools:
Track recent price action with flexible close-following lines
✅ RSI Overlay on Candles:
Optional RSI + RSI SMA displayed above the current bar, with automatic color logic.
🎯 Use Cases
➖Trend Traders can identify when price is stacked bullishly across moving averages and breaking above ATR zones.
➖Mean Reversion Traders can fade extremes at 2.5x or 5x ATR zones.
➖Scalpers get immediate trend insight from colored bar overlays and close-following lines.
➖Swing Traders can combine multi-timeframe EMAs with volatility thresholds for higher confluence.
📌 Final Note:
As powerful as this script can be, no single indicator should be used in isolation. For best results, combine it with price action analysis, higher-timeframe context, and complementary tools like trendlines, moving averages, or support/resistance levels. Use it as part of a well-rounded trading approach to confirm setups — not to define them alone.

MA44 StrategyMA-44 Strategy
• The previous candle closes below the 44-day MA,
• The current candle closes just above or immediately above the 44-day MA,
• Followed by a green candle,
• With the 44-day MA above the 50-day MA (indicating an uptrend).
