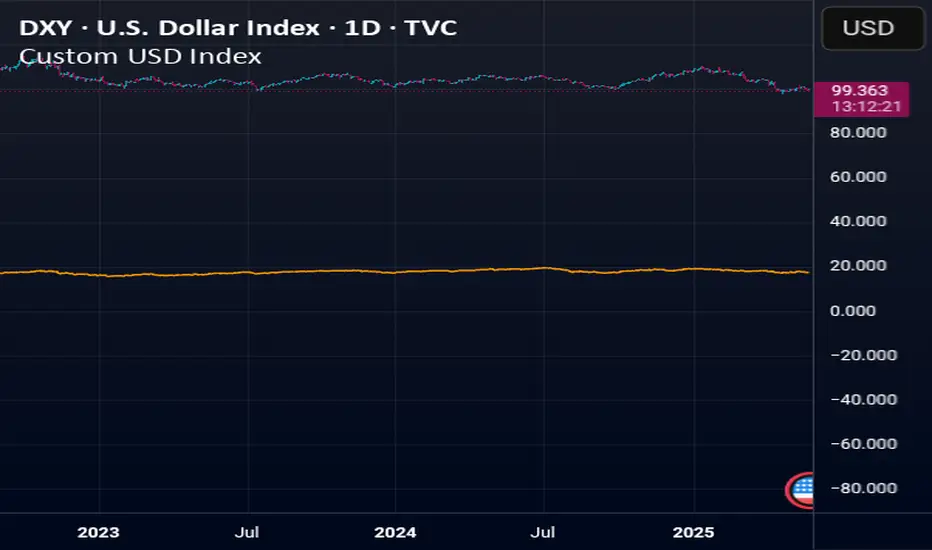
Custom USD IndexThis is a modernized, expanded version of the U.S. Dollar Index (DXY), designed to provide a more accurate representation of the dollar’s global strength in today’s diversified economy.
Unlike the traditional DXY, which excludes major players like China and entirely omits real-world stores of value, this custom index (DXY+) includes:
Fiat Currencies (78.3% total weight):
EUR, JPY, GBP, CAD, AUD, CHF, and CNY — equally weighted to reflect the global currency landscape.
Gold (17.5%):
Gold (XAUUSD) is included as a traditional reserve asset and inflation hedge, acknowledging its continued monetary relevance.
Cryptocurrencies (2.8% total weight):
Bitcoin (BTC) and Ethereum (ETH) represent the emerging digital monetary layer.
The index rises when the U.S. dollar strengthens relative to this blended basket, and falls when the dollar weakens against it. This is ideal for traders, economists, and macro analysts seeking a more inclusive and up-to-date measure of dollar performance.
Statistics
Float, Daily % Change & Short %This TradingView Pine Script displays a compact table on your chart showing four key metrics for any stock:
📊 What It Shows:
Float – Number of publicly available shares, formatted in K/M/B.
Daily % Change – Price change from yesterday’s close to the current price.
Intraday % Change – Price change from today’s open to the current price.
Short Volume % – Estimated short volume as a percentage of total daily volume.
⚙️ How to Use:
Add the script to your TradingView chart.
Choose table size and screen position from the settings panel.
The values update in real-time on the latest candle only, so they stay out of the way but always visible.
Ideal for momentum traders, short float hunters, and day traders who need quick access to real-time float, price action, and short volume stats.

SOFR Spread (proxy: FEDFUNDS - US03MY)📊 SOFR Spread (Proxy: FEDFUNDS - US03MY) – Monitoring USD Money Market Liquidity
In 2008, the spread exhibits a sharp vertical spike, signaling a severe liquidity dislocation: investors rushed into short-term U.S. Treasuries, pushing their yields down dramatically, while the FEDFUNDS rate remained relatively high.
This behavior indicates extreme systemic stress in the interbank lending market, preceding massive Federal Reserve interventions such as rate cuts, emergency liquidity operations, and the launch of quantitative easing (QE).
Description:
This indicator plots the spread between the Effective Federal Funds Rate (FEDFUNDS) and the 3-Month US Treasury Bill yield (US03MY), used here as a proxy for the SOFR spread.
It serves as a simple yet powerful tool to detect liquidity dislocations and stress signals in the US short-term funding markets.
Interpretation:
🔴 Spread > 0.20% → Possible liquidity stress: elevated repo rates, cash shortage, interbank distrust.
🟡 Spread ≈ 0% → Normal market conditions, balanced liquidity.
🟢 Spread < 0% → Excess liquidity: strong demand for T-Bills, “flight to safety”, or distortion due to expansionary monetary policy.
Ideal for:
Monitoring Fed policy impact
Anticipating market-wide liquidity squeezes
Correlation with DXY, SPX, VIX, MOVE Index, and risk sentiment
🧠 Note: As SOFR is not directly available on TradingView, FEDFUNDS is used as a reliable proxy, closely tracking the same trends in most macro conditions.

Statistical Pairs Trading IndicatorZ-Score Stat Trading — Statistical Pairs Trading Indicator
📊🔗
---
What is it?
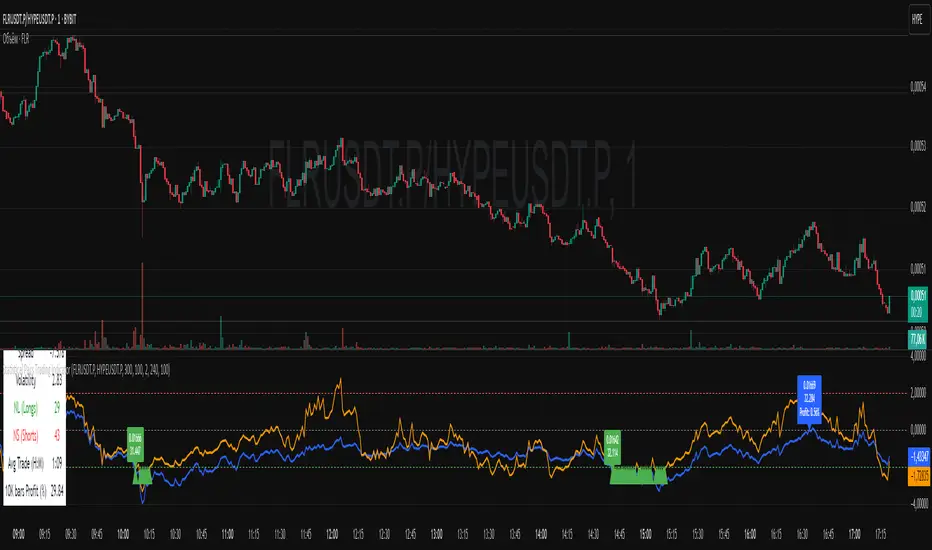
Z-Score Stat Trading is a powerful indicator for statistical pairs trading and quantitative analysis of two correlated assets.
It calculates the Z-Score of the log-price spread between any two symbols you choose, providing both long-term and short-term Z-Score signals.
You’ll also see real-time correlation, volatility, spread, and the number of long/short signals in a handy on-chart table!
---
How to Use 🛠️
1. Add the indicator to your chart.
2. Select two assets (symbols) to analyze in the settings.
3. Watch the Z-Score plots (blue and orange lines) and threshold levels (+2, -2 by default).
4. Check the info table for:
- Correlation
- Volatility
- Spread
- Number of long (NL) and short (NS) signals in the last 1000 bars
5. Set up alerts for signal generation or threshold crossings if you want to be notified automatically.
---
Trading Strategy 💡
- This indicator is designed for statistical arbitrage (mean reversion) strategies.
- Long Signal (🟢):
When both Z-Scores drop below the negative threshold (e.g., -2), a long signal is generated.
→ Buy Symbol A, Sell Symbol B, expecting the spread to revert to the mean.
- Short Signal (🔴):
When both Z-Scores rise above the positive threshold (e.g., +2), a short signal is generated.
→ Sell Symbol A, Buy Symbol B, again expecting mean reversion.
- The info table helps you quickly assess the frequency of signals and the current statistical relationship between your chosen assets.
---
Best Practices & Warnings 🚦
- Avoid high leverage! Pairs trading can be risky, especially during periods of divergence. Use conservative position sizing.
- Check for cointegration: Before using this indicator, make sure both assets are cointegrated or have a strong historical relationship. This increases the reliability of mean reversion signals.
- Check correlation: Only use asset pairs with a high correlation (preferably 0.8–0.9 or higher) for best results. The correlation value is shown in the info table.
- Scale in and out gradually: When entering or exiting positions, consider doing so in parts rather than all at once. This helps manage slippage and risk, especially in volatile markets.
---
⚠️ Note on Performance:
This indicator may work a bit slowly, especially on large timeframes or long chart histories, because the calculation of NL and NS (number of long/short signals) is computationally intensive.
---
Disclaimer ⚠️
This script is provided for educational and informational purposes only .
It is not financial advice or a recommendation to buy or sell any asset.
Use at your own risk. The author assumes no responsibility for any trading decisions or losses.
Fibo Normalized RSI & RSI RibbonPlots both standard and Z-score normalized RSI ribbons using Fibonacci-based periods. Supports adjustable normalization, optional 0–100 scaling, and multi-line visualizations for momentum and deviation analysis.
This tool is designed for traders who want to go beyond standard RSI by adding:
Statistical normalization (Z-score)
Multi-period analysis (Fibonacci structure)
Advanced divergence and exhaustion detection
It gives you both classical momentum context and mathematically rigorous deviation insight, making it ideal for:
Swing traders
Quant-inclined discretionary traders
Multi-timeframe analysts
Trend Confirmation
When both RSI and normalized RSI across short and long periods are stacked in the same direction (e.g., above 50 or with high Z-scores), the trend is likely strong.
Disagreement between the two ribbons (e.g., RSI high but normalized RSI flat) may indicate late-stage trend or false strength.
Mean Reversion Trades
Look for normalized RSI values > +2 or < -2 (i.e., ~2 standard deviations).
Cross-check with standard RSI to see if the move aligns with a traditional overbought/oversold level.
Great for fade/reversal setups when Z-score RSI is extreme but classic RSI is just beginning to turn.
Divergence Detection
Compare the slope of RSI vs. normalized RSI over same period:
If RSI is rising but normalized RSI is falling → momentum is fading despite apparent strength.
Excellent for early warnings before reversals.
Multi-Timeframe Confluence
Use short-period ribbons (e.g., 3–13) for tactical entries/exits.
Use long-period ribbons (e.g., 55–233) for macro trend bias.
Alignment across both = high-confidence zone.

Risk Calculator PRO — manual lot size + auto lot-suggestionWhy risk management?
90 % of traders blow up because they size positions emotionally. This tool forces Risk-First Thinking: choose the amount you’re willing to lose, and the script reverse-engineers everything else.
Key features
1. Manual or Market Entry – click “Use current price” or type a custom entry.
2. Setup-based ₹-Risk – four presets (A/B/C/D). Edit to your workflow.
3. Lot-Size Input + Auto Lot Suggestion – you tell the contract size ⇒ script tells you how many lots.
4. Auto-SL (optional) – tick to push stop-loss to exactly 1-lot risk.
5. Instant Targets – 1 : 2, 1 : 3, 1 : 4, 1 : 5 plotted and alert-ready.
6. P&L Preview – table shows potential profit at each R-multiple plus real ₹ at SL.
7. Margin Column – enter per-lot margin once; script totals it for any size.
8. Clean Table UI – dark/light friendly; updates every 5 bars.
9. Alert Pack – SL, each target, plus copy-paste journal line on the chart.
How to use
1. Add to chart > “Format”.
2. Type the lot size for the symbol (e.g., 1250 for Natural Gas, 1 for cash equity).
3. Pick Side (Buy / Sell) & Setup grade.
4. ✅ If you want the script to place SL for you, tick Auto-SL (risk = 1 lot).
5. Otherwise type your own Stop-loss.
6. Read the table:
• Suggested lots = how many to trade so risk ≤ setup ₹.
• Risk (currency) = real money lost if SL hits.
7. Set TradingView alerts on the built-in conditions (T1_2, SL_hit, etc.) if you’d like push / email.
8. Copy the orange CSV label to Excel / Sheets for journalling.
Best practices
• Never raise risk to “fit” a trade. Lower size instead.
• Review win-rate vs. R multiple monthly; adjust setups A–D accordingly.
• Test Auto-SL in replay before going live.
Disclaimer
This script is educational. Past performance ≠ future results. The author isn’t responsible for trading losses.

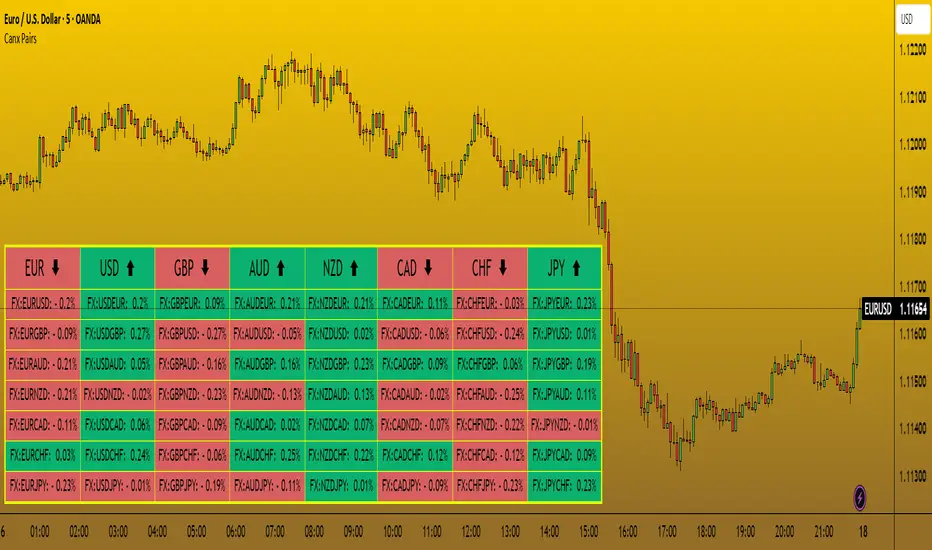
CANX Pairs Table© CanxStixTrader
This Indicator simply shows the change in movement of all the major currency pairs using custom time frames and percentage.
Customize time frame, background, text colors and indicator location to suit.
Keep it simple!
Index Futures vs Cash ArbitrageThis indicator measures the statistical spread between major stock index futures and their corresponding cash indices (e.g., ES vs SPX, NQ vs NDX) using Z-score normalization. It automatically detects commonly traded index pairs (S&P 500, Nasdaq, Dow Jones, Russell 2000) and calculates a smoothed spread between futures and spot prices. A Z-score is then derived from this spread to highlight potential overpricing or underpricing conditions.
Traders can use customizable thresholds to identify mean-reversion opportunities where the futures contract may be temporarily overvalued or undervalued relative to the index. The histogram highlights the direction of the Z-score (green = futures > index, red = futures < index), while built-in alerts notify users of key threshold breaches or zero-line crosses.
This tool is designed for discretionary traders, pairs traders, or anyone exploring statistical arbitrage strategies between futures and spot markets. It is not a buy/sell signal by itself and should be used with additional confluence or risk management techniques.

Seasonality DOW CombinedOverall Purpose
This script analyzes historical daily returns based on two specific criteria:
Month of the year (January through December)
Day of the week (Sunday through Saturday)
It summarizes and visually displays the average historical performance of the selected asset by these criteria over multiple years.
Step-by-Step Breakdown
1. Initial Settings:
Defines minimum year (i_year_start) from which data analysis will start.
Ensures the user is using a daily timeframe, otherwise prompts an error.
Sets basic display preferences like text size and color schemes.
2. Data Collection and Variables:
Initializes matrices to store and aggregate returns data:
month_data_ and month_agg_: store monthly performance.
dow_data_ and dow_agg_: store day-of-week performance.
COUNT tracks total number of occurrences, and COUNT_POSITIVE tracks positive-return occurrences.
3. Return Calculation:
Calculates daily percentage change (chg_pct_) in price:
chg_pct_ = close / close - 1
Ensures it captures this data only for the specified years (year >= i_year_start).
4. Monthly Performance Calculation:
Each daily return is grouped by month:
matrix.set updates total returns per month.
The script tracks:
Monthly cumulative returns
Number of occurrences (how many days recorded per month)
Positive occurrences (days with positive returns)
5. Day-of-Week Performance Calculation:
Similarly, daily returns are also grouped by day-of-the-week (Sunday to Saturday):
Daily return values are summed per weekday.
The script tracks:
Cumulative returns per weekday
Number of occurrences per weekday
Positive occurrences per weekday
6. Visual Display (Tables):
The script creates two visual tables:
Left Table: Monthly Performance.
Right Table: Day-of-the-Week Performance.
For each table, it shows:
Yearly data for each month/day.
Summaries at the bottom:
SUM row: Shows total accumulated returns over all selected years for each month/day.
+ive row: Shows percentage (%) of times the month/day had positive returns, along with a tooltip displaying positive occurrences vs total occurrences.
Cells are color-coded:
Green for positive returns.
Red for negative returns.
Gray for neutral/no change.
7. Interpreting the Tables:
Monthly Table (left side):
Helps identify seasonal patterns (e.g., historically bullish/bearish months).
Day-of-Week Table (right side):
Helps detect recurring weekday patterns (e.g., historically bullish Mondays or bearish Fridays).
Practical Use:
Traders use this to:
Identify patterns based on historical data.
Inform trading strategies, e.g., avoiding historically bearish days/months or leveraging historically bullish periods.
Example Interpretation:
If the table shows consistently green (positive) for March and April, historically the asset tends to perform well during spring. Similarly, if the "Friday" column is often red, historically Fridays are bearish for this asset.

MVRV | Lyro RS📊 MVRV | Lyro RS is a powerful on-chain valuation tool designed to assess the relative market positioning of Bitcoin (BTC) or Ethereum (ETH) based on the Market Value to Realized Value (MVRV) ratio. It highlights potential undervaluation or overvaluation zones, helping traders and investors anticipate cyclical tops and bottoms.
✨ Key Features :
🔁 Dual Asset Support: Analyze either BTC or ETH with a single toggle.
📐 Dynamic MVRV Thresholds: Automatically calculates median-based bands at 50%, 64%, 125%, and 170%.
📊 Median Calculation: Period-based median MVRV for long-term trend context.
💡 Optional Smoothing: Use SMA to smooth MVRV for cleaner analysis.
🎯 Visual Threshold Alerts: Background and bar colors change based on MVRV position relative to thresholds.
⚠️ Built-in Alerts: Get notified when MVRV enters under- or overvalued territory.
📈 How It Works :
💰 MVRV Calculation: Uses data from IntoTheBlock and CoinMetrics to obtain real-time MVRV values.
🧠 Threshold Bands: Median MVRV is used as a baseline. Ratios like 50%, 64%, 125%, and 170% signal various levels of market extremes.
🎨 Visual Zones: Green zones for undervaluation and red zones for overvaluation, providing intuitive visual cues.
🛠️ Custom Highlights: Toggle individual threshold zones on/off for a cleaner view.
⚙️ Customization Options :
🔄 Switch between BTC or ETH for analysis.
📏 Adjust period length for median MVRV calculation.
🔧 Enable/disable threshold visibility (50%, 64%, 125%, 170%).
📉 Toggle smoothing to reduce noise in volatile markets.
📌 Use Cases :
🟢 Identify undervalued zones for long-term entry opportunities.
🔴 Spot potential overvaluation zones that may precede corrections.
🧭 Use in confluence with price action or macro indicators for better timing.
⚠️ Disclaimer :
This indicator is for educational purposes only. It should not be used in isolation for making trading or investment decisions. Always combine with price action, fundamentals, and proper risk management.

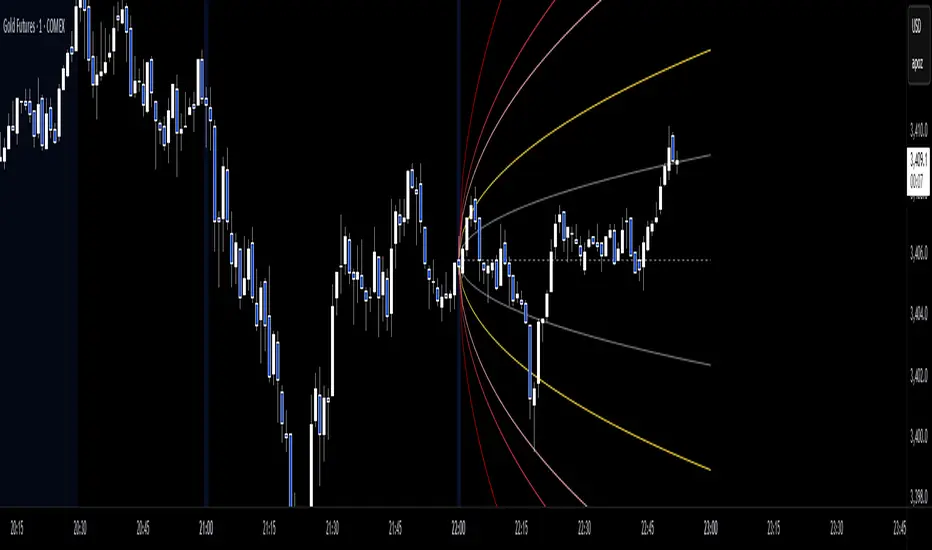
Anchored Probability Cone by TenozenFirst of all, credit to @nasu_is_gaji for the open source code of Log-Normal Price Forecast! He teaches me alot on how to use polylines and inverse normal distribution from his indicator, so check it out!
What is this indicator all about?
This indicator draws a probability cone that visualizes possible future price ranges with varying levels of statistical confidence using Inverse Normal Distribution , anchored to the start of a selected timeframe (4h, W, M, etc.)
Feutures:
Anchored Cone: Forecasts begin at the first bar of each chosen higher timeframe, offering a consistent point for analysis.
Drift & Volatility-Based Forecast: Uses log returns to estimate market volatility (smoothed using VWMA) and incorporates a trend angle that users can set manually.
Probabilistic Price Bands: Displays price ranges with 5 customizable confidence levels (e.g., 30%, 68%, 87%, 99%, 99,9%).
Dynamic Updating: Recalculates and redraws the cone at the start of each new anchor period.
How to use:
Choose the Anchored Timeframe (PineScript only be able to forecast 500 bars in the future, so if it doesn't plot, try adjusting to a lower anchored period).
You can set the Model Length, 100 sample is the default. The higher the sample size, the higher the bias towards the overall volatility. So better set the sample size in a balanced manner.
If the market is inside the 30% conifidence zone (gray color), most likely the market is sideways. If it's outside the 30% confidence zone, that means it would tend to trend and reach the other probability levels.
Always follow the trend, don't ever try to trade mean reversions if you don't know what you're doing, as mean reversion trades are riskier.
That's all guys! I hope this indicator helps! If there's any suggestions, I'm open for it! Thanks and goodluck on your trading journey!
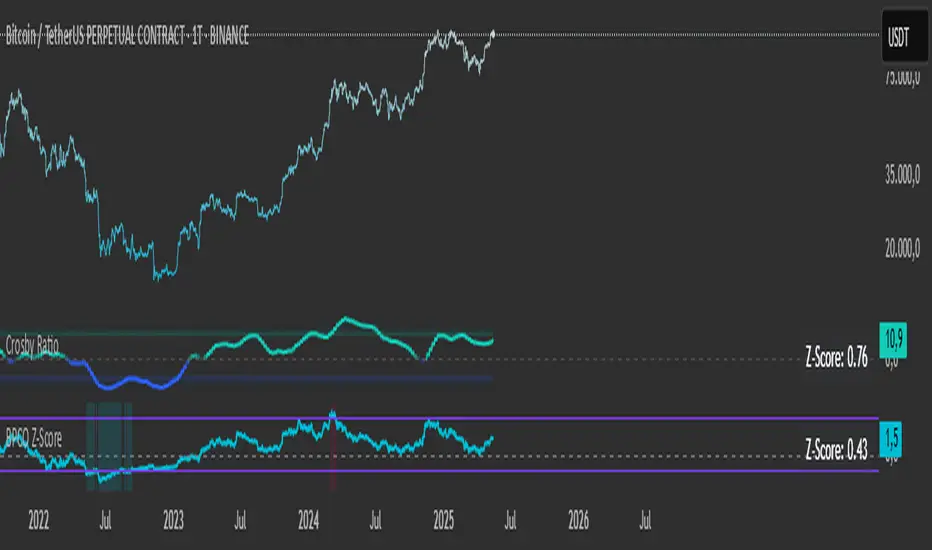
BPCO Z-ScoreBPCO Z-Score with Scaled Z-Value and Table
Description:
This custom indicator calculates the Z-Score of a specified financial instrument (using the closing price as a placeholder for the BPCO value), scales the Z-Score between -2 and +2 based on user-defined thresholds, and displays it in a table for easy reference.
The indicator uses a simple moving average (SMA) and standard deviation to calculate the original Z-Score, and then scales the Z-Score within a specified range (from -2 to +2) based on the upper and lower thresholds set by the user.
Additionally, the scaled Z-Score is displayed in a separate table on the right side of the chart, providing a clear, numerical value for users to track and interpret.
Key Features:
BPCO Z-Score: Calculates the Z-Score using a simple moving average and standard deviation over a user-defined window (default: 365 days). This provides a measure of how far the current price is from its historical average in terms of standard deviations.
Scaled Z-Score: The original Z-Score is then scaled between -2 and +2, based on the user-specified upper and lower thresholds. The thresholds default to 3.5 (upper) and -1.5 (lower), and can be adjusted as needed.
Threshold Bands: Horizontal lines are plotted on the chart to represent the upper and lower thresholds. These help visualize when the Z-Score crosses critical levels, indicating potential market overbought or oversold conditions.
Dynamic Table Display: The scaled Z-Score is shown in a dynamic table at the top-right of the chart, providing a convenient reference for traders. The table updates automatically as the Z-Score fluctuates.
How to Use:
Adjust Time Window: The "Z-Score Period (Days)" input allows you to adjust the time period used for calculating the moving average and standard deviation. By default, this is set to 365 days (1 year), but you can adjust this depending on your analysis needs.
Set Upper and Lower Thresholds: Use the "BPCO Upper Threshold" and "BPCO Lower Threshold" inputs to define the bands for your Z-Score. The default values are 3.5 for the upper band and -1.5 for the lower band, but you can adjust them based on your strategy.
Interpret the Z-Score: The Z-Score provides a standardized measure of how far the current price (or BPCO value) is from its historical mean, relative to the volatility. A value above the upper threshold (e.g., 3.5) may indicate overbought conditions, while a value below the lower threshold (e.g., -1.5) may indicate oversold conditions.
Use the Scaled Z-Score: The scaled Z-Score is calculated based on the original Z-Score, but it is constrained to a range between -2 and +2. When the BPCO value hits the upper threshold (3.5), the scaled Z-Score will be +2, and when it hits the lower threshold (-1.5), the scaled Z-Score will be -2. This gives you a clear, easy-to-read value to interpret the market's condition.
Data Sources:
BPCO Data: In this indicator, the BPCO value is represented by the closing price of the asset. The calculation of the Z-Score and scaled Z-Score is based on this price data, but you can modify it to incorporate other data streams as needed (e.g., specific economic indicators or custom metrics).
Indicator Calculation: The Z-Score is calculated using the following formulas:
Mean (SMA): A simple moving average of the BPCO (close price) over the selected period (365 days by default).
Standard Deviation (Std): The standard deviation of the BPCO (close price) over the same period.
Z-Score: (Current BPCO - Mean) / Standard Deviation
Scaled Z-Score: The Z-Score is normalized to fall within a specified range (from -2 to +2), based on the upper and lower threshold inputs.
Important Notes:
Customization: The indicator allows users to adjust the period (window) for calculating the Z-Score, as well as the upper and lower thresholds to suit different timeframes and trading strategies.
Visual Aids: Horizontal lines are drawn to represent the upper and lower threshold levels, making it easy to visualize when the Z-Score crosses critical levels.
Limitations: This indicator relies on historical price data (or BPCO) and assumes that the standard deviation and mean are representative of future price behavior. It does not account for potential market shifts or extreme events that may fall outside historical norms.
SOPR with Z-Score Table📊 Glassnode SOPR with Dynamic Z-Score Table
ℹ️ Powered by Glassnode On-Chain Metrics
📈 Description:
This indicator visualizes the Spent Output Profit Ratio (SOPR) for major cryptocurrencies — Bitcoin, Ethereum, and Litecoin — along with a dynamically normalized Z-Score. SOPR is a key on-chain metric that reflects whether coins moved on-chain are being sold at a profit or a loss.
🔍 SOPR is calculated using Glassnode’s entity-adjusted SOPR feed, and a custom SMA is applied to smooth the signal. The normalized Z-Score helps identify market sentiment extremes by scaling SOPR relative to its historical context.
📊 Features:
Selectable cryptocurrency: Bitcoin, Ethereum, or Litecoin
SOPR smoothed by user-defined SMA (default: 10 periods)
Upper & lower bounds (±4%) for SOPR, shown as red/green lines
Background highlighting when SOPR moves outside normal range
Normalized Z-Score scaled between –2 and +2
Live Z-Score display in a compact top-right table
🧮 Calculations:
SOPR data is sourced daily from Glassnode:
Bitcoin: XTVCBTC_SOPR
Ethereum: XTVCETH_SOPR
Litecoin: XTVCLTC_SOPR
Z-Score is calculated as:
SMA of SOPR over zscore_length periods
Standard deviation of SOPR
Z-Score = (SOPR – mean) / standard deviation
Z-Score is clamped between –2 and +2 for visual consistency
🎯 Interpretation:
SOPR > 1 implies coins are sold in profit
SOPR < 1 suggests coins are sold at a loss
When SOPR is significantly above or below its recent range (e.g., +4% or –4%), it may signal overheating or capitulation
The Z-Score contextualizes how extreme the current SOPR is relative to history
📌 Notes:
Best viewed on daily charts
Works across selected assets (BTC, ETH, LTC)
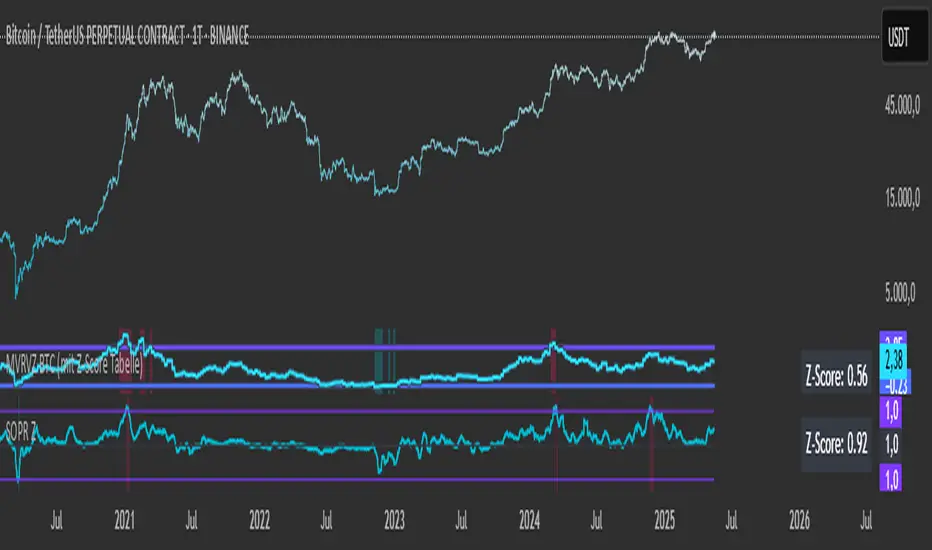
MVRVZ BTCMVRVZ BTC (Market Value to Realized Value Z-Score)
Description:
The MVRVZ BTC indicator provides insights into the relationship between the market value and realized value of Bitcoin, using the Market Value to Realized Value (MVRV) ratio, which is then adjusted using a Z-Score. This indicator highlights potential market extremes and helps in identifying overbought or oversold conditions, offering a unique perspective on Bitcoin's valuation.
How It Works:
MVRVZ is calculated by taking the difference between Bitcoin's Market Capitalization (MC) and Realized Capitalization (MCR), then dividing that by the Standard Deviation (Stdev) of the price over a specified period (usually 104 weeks).
The resulting value is plotted as the MVRVZ line, representing how far the market price deviates from its realized value.
Z-Score is then applied to the MVRVZ line, with the Z-Score bounded between +2 and -2, which allows it to be used within a consistent evaluation framework, regardless of how high or low the MVRVZ line goes. The Z-Score will reflect overbought or oversold conditions:
A Z-Score above +2 indicates the market is likely overbought (possible market top).
A Z-Score below -2 indicates the market is likely oversold (possible market bottom).
Values between -2 and +2 indicate more neutral market conditions.
How to Read the Indicator:
MVRVZ Line:
The MVRVZ line shows the relationship between market cap and realized cap. A higher value indicates the market is overvalued relative to the actual capital realized by holders.
The MVRVZ line can move above or below the top and bottom lines you define, which are adjustable according to your preferences. These lines act as trigger levels.
Top and Bottom Trigger Lines:
You can customize the Top Line and Bottom Line values to your preference.
When the MVRVZ line crosses the Top Line, the market might be considered overbought.
When the MVRVZ line crosses the Bottom Line, the market might be considered oversold.
SCDA Z-Score:
The Z-Score is displayed alongside the MVRVZ line and is bounded between -2 and +2. It scales proportionally based on the MVRVZ line's position relative to the top and bottom trigger lines.
The Z-Score ensures that even if the MVRVZ line moves beyond the trigger lines, the Z-Score will stay within the limits of -2 to +2, making it ideal for your custom evaluation system (SCDA).
Background Highlighting:
The background color changes when the MVRVZ line crosses key levels:
When the MVRVZ line exceeds the Top Trigger, the background turns red, indicating overbought conditions.
When the MVRVZ line falls below the Bottom Trigger, the background turns green, indicating oversold conditions.
Data Sources:
The data for the MVRVZ indicator is sourced from Glassnode and Coinmetrics, which provide the necessary values for:
BTC Market Cap (MC) – The total market capitalization of Bitcoin.
BTC Realized Market Cap (MCR) – The capitalization based on the price at which Bitcoin was last moved on the blockchain (realized value).
How to Use the Indicator:
Market Extremes:
Use the MVRVZ and Z-Score to spot potential market tops or bottoms.
A high Z-Score (above +2) suggests the market is overbought, while a low Z-Score (below -2) suggests the market is oversold.
Adjusting the Triggers:
Customize the Top and Bottom Trigger Lines to suit your trading strategy. These lines can act as dynamic reference points for when to take action based on the Z-Score or MVRVZ line crossing these levels.
Market Evaluation (SCDA Framework):
The bounded Z-Score (from -2 to +2) is tailored for your SCDA evaluation system, allowing you to assess market conditions based on consistent criteria, no matter how volatile the MVRVZ line becomes.
Conclusion:
The MVRVZ BTC indicator is a powerful tool for assessing the relative valuation of Bitcoin based on its market and realized capitalization. By combining it with the Z-Score, you get an easy-to-read, bounded evaluation system that highlights potential market extremes and helps you make informed decisions about Bitcoin's price behavior.

Correlation Drift📈 Correlation Drift
The Correlation Drift indicator is designed to detect shifts in market momentum by analyzing the relationship between correlation and price lag. It combines the principles of correlation analysis and lag factor measurement to provide a unique perspective on trend alignment and momentum shifts.
🔍 Core Concept:
The indicator calculates the Correlation vs PLF Ratio, which measures the alignment between an asset’s price movement and a chosen benchmark (e.g., BTCUSD). This ratio reflects how well the asset’s momentum matches the market trend while accounting for price lag.
📊 How It Works:
Correlation Calculation:
The script calculates the correlation between the asset and the selected benchmark over a specified period.
A higher correlation indicates that the asset’s price movements are in sync with the benchmark.
Price Lag Factor (PLF) Calculation:
The PLF measures the difference between long-term and short-term price momentum, dynamically scaled by recent volatility.
It highlights potential overextensions or lags in the asset’s price movements.
Combining Correlation and PLF:
The Correlation vs PLF Ratio combines these metrics to detect momentum shifts relative to the trend.
The result is a dynamic, smoothed histogram that visualizes whether the asset is leading or lagging behind the trend.
💡 How to Interpret:
Positive Values (Green/Aqua Bars):
Indicates bullish alignment with the trend.
Aqua: Rising bullish momentum, suggesting continuation.
Teal: Decreasing bullish momentum, signaling caution.
Negative Values (Purple/Fuchsia Bars):
Indicates bearish divergence from the trend.
Fuchsia: Falling bearish momentum, indicating increasing pressure.
Purple: Rising bearish momentum, suggesting potential reversal.
Clipping for Readability:
Values are clipped between -3 and +3 to prevent outliers from compressing the histogram.
This ensures clear visualization of typical momentum shifts while still marking extreme cases.
🚀 Best Practices:
Use Correlation Drift as a confirmation tool in conjunction with trend indicators (e.g., moving averages) to identify momentum alignment or divergence.
Look for transitions from positive to negative (or vice versa) as signals of potential trend shifts.
Combine with volume analysis to strengthen confidence in breakout or breakdown signals.
⚠️ Key Features:
Customizable Settings: Adjust the correlation length, PLF length, and smoothing factor to fine-tune the indicator for different market conditions.
Visual Gradient: The histogram changes color based on the strength and direction of the ratio, making it easy to identify shifts at a glance.
Zero Line Reference: Clearly distinguishes between bullish and bearish momentum zones.
🔧 Recommended Settings:
Correlation Length: 14 (for short to medium-term analysis)
PLF Length: 50 (to smooth out noise while capturing trend shifts)
Smoothing Factor: 3 (for enhanced clarity without excessive lag)
Benchmark Symbol: BTCUSD (or another relevant market indicator)
By providing a quantitative measure of trend alignment while accounting for price lag, the Correlation Drift indicator helps traders make more informed decisions during periods of momentum change. Whether you are trading crypto, forex, or equities, this tool can be a powerful addition to your momentum-based trading strategies.
⚠️ Disclaimer:
The Correlation Drift indicator is a technical analysis tool designed to aid in identifying potential shifts in market momentum and trend alignment. It is intended for informational and educational purposes only and should not be considered as financial advice or a recommendation to buy, sell, or hold any financial instrument.
Trading financial instruments, including cryptocurrencies, involves significant risk and may result in the loss of your capital. Past performance is not indicative of future results. Always conduct thorough research and seek advice from a certified financial professional before making any trading decisions.
The developer (RWCS_LTD) is not responsible for any trading losses or adverse outcomes resulting from the use of this indicator. Users are encouraged to test and validate the indicator in a simulated environment before applying it to live trading. Use at your own risk.

Hurst Exponent Oscillator [PhenLabs]📊 Hurst Exponent Oscillator -
Version: PineScript™ v5
📌 Description
The Hurst Exponent Oscillator (HEO) by PhenLabs is a powerful tool developed for traders who want to distinguish between trending, mean-reverting, and random market behaviors with clarity and precision. By estimating the Hurst Exponent—a statistical measure of long-term memory in financial time series—this indicator helps users make sense of underlying market dynamics that are often not visible through traditional moving averages or oscillators.
Traders can quickly know if the market is likely to continue its current direction (trending), revert to the mean, or behave randomly, allowing for more strategic timing of entries and exits. With customizable smoothing and clear visual cues, the HEO enhances decision-making in a wide range of trading environments.
🚀 Points of Innovation
Integrates advanced Hurst Exponent calculation via Rescaled Range (R/S) analysis, providing unique market character insights.
Offers real-time visual cues for trending, mean-reverting, or random price action zones.
User-controllable EMA smoothing reduces noise for clearer interpretation.
Dynamic coloring and fill for immediate visual categorization of market regime.
Configurable visual thresholds for critical Hurst levels (e.g., 0.4, 0.5, 0.6).
Fully customizable appearance settings to fit different charting preferences.
🔧 Core Components
Log Returns Calculation: Computes log returns of the selected price source to feed into the Hurst calculation, ensuring robust and scale-independent analysis.
Rescaled Range (R/S) Analysis: Assesses the dispersion and cumulative deviation over a rolling window, forming the core statistical basis for the Hurst exponent estimate.
Smoothing Engine: Applies Exponential Moving Average (EMA) smoothing to the raw Hurst value for enhanced clarity.
Dynamic Rolling Windows: Utilizes arrays to maintain efficient, real-time calculations over user-defined lengths.
Adaptive Color Logic: Assigns different highlight and fill colors based on the current Hurst value zone.
🔥 Key Features
Visually differentiates between trending, mean-reverting, and random market modes.
User-adjustable lookback and smoothing periods for tailored sensitivity.
Distinct fill and line styles for each regime to avoid ambiguity.
On-chart reference lines for strong trending and mean-reverting thresholds.
Works with any price series (close, open, HL2, etc.) for versatile application.
🎨 Visualization
Hurst Exponent Curve: Primary plotted line (smoothed if EMA is used) reflects the ongoing estimate of the Hurst exponent.
Colored Zone Filling: The area between the Hurst line and the 0.5 reference line is filled, with color and opacity dynamically indicating the current market regime.
Reference Lines: Dash/dot lines mark standard Hurst thresholds (0.4, 0.5, 0.6) to contextualize the current regime.
All visual elements can be customized for thickness, color intensity, and opacity for user preference.
📖 Usage Guidelines
Data Settings
Hurst Calculation Length
Default: 100
Range: 10-300
Description: Number of bars used in Hurst calculation; higher values mean longer-term analysis, lower values for quicker reaction.
Data Source
Default: close
Description: Select which data series to analyze (e.g., Close, Open, HL2).
Smoothing Length (EMA)
Default: 5
Range: 1-50
Description: Length for smoothing the Hurst value; higher settings yield smoother but less responsive results.
Style Settings
Trending Color (Hurst > 0.5)
Default: Blue tone
Description: Color used when trending regime is detected.
Mean-Reverting Color (Hurst < 0.5)
Default: Orange tone
Description: Color used when mean-reverting regime is detected.
Neutral/Random Color
Default: Soft blue
Description: Color when market behavior is indeterminate or shifting.
Fill Opacity
Default: 70-80
Range: 0-100
Description: Transparency of area fills—higher opacity for stronger visual effect.
Line Width
Default: 2
Range: 1-5
Description: Thickness of the main indicator curve.
✅ Best Use Cases
Identifying if a market is regime-shifting from trending to mean-reverting (or vice versa).
Filtering signals in automated or systematic trading strategies.
Spotting periods of randomness where trading signals should be deprioritized.
Enhancing mean-reversion or trend-following models with regime-awareness.
⚠️ Limitations
Not predictive: Reflects current and recent market state, not future direction.
Sensitive to input parameters—overfitting may occur if settings are changed too frequently.
Smoothing can introduce lag in regime recognition.
May not work optimally in markets with structural breaks or extreme volatility.
💡 What Makes This Unique
Employs advanced statistical market analysis (Hurst exponent) rarely found in standard toolkits.
Offers immediate regime visualization through smart dynamic coloring and zone fills.
🔬 How It Works
Rolling Log Return Calculation:
Each new price creates a log return, forming the basis for robust, non-linear analysis. This ensures all price differences are treated proportionally.
Rescaled Range Analysis:
A rolling window maintains cumulative deviations and computes the statistical “range” (max-min of deviations). This is compared against the standard deviation to estimate “memory”.
Exponent Calculation & Smoothing:
The raw Hurst value is translated from the log of the rescaled range ratio, and then optionally smoothed via EMA to dampen noise and false signals.
Regime Detection Logic:
The smoothed value is checked against 0.5. Values above = trending; below = mean-reverting; near 0.5 = random. These control plot/fill color and zone display.
💡 Note:
Use longer calculation lengths for major market character study, and shorter ones for tactical, short-term adaptation. Smoothing balances noise vs. lag—find a best fit for your trading style. Always combine regime awareness with broader technical/fundamental context for best results.

Enhanced Volume Trend Indicator with BB SqueezeEnhanced Volume Trend Indicator with BB Squeeze: Comprehensive Explanation
The visualization system allows traders to quickly scan multiple securities to identify high-probability setups without detailed analysis of each chart. The progression from squeeze to breakout, supported by volume trend confirmation, offers a systematic approach to identifying trading opportunities.
The script combines multiple technical analysis approaches into a comprehensive dashboard that helps traders make informed decisions by identifying high-probability setups while filtering out noise through its sophisticated confirmation requirements. It combines multiple technical analysis approaches into an integrated visual system that helps traders identify potential trading opportunities while filtering out false signals.
Core Features
1. Volume Analysis Dashboard
The indicator displays various volume-related metrics in customizable tables:
AVOL (After Hours + Pre-Market Volume): Shows extended hours volume as a percentage of the 21-day average volume with color coding for buying/selling pressure. Green indicates buying pressure and red indicates selling pressure.
Volume Metrics: Includes regular volume (VOL), dollar volume ($VOL), relative volume compared to 21-day average (RVOL), and relative volume compared to 90-day average (RVOL90D).
Pre-Market Data: Optional display of pre-market volume (PVOL), pre-market dollar volume (P$VOL), pre-market relative volume (PRVOL), and pre-market price change percentage (PCHG%).
2. Enhanced Volume Trend (VTR) Analysis
The Volume Trend indicator uses adaptive analysis to evaluate buying and selling pressure, combining multiple factors:
MACD (Moving Average Convergence Divergence) components
Volume-to-SMA (Simple Moving Average) ratio
Price direction and market conditions
Volume change rates and momentum
EMA (Exponential Moving Average) alignment and crossovers
Volatility filtering
VTR Visual Indicators
The VTR score ranges from 0-100, with values above 50 indicating bullish conditions and below 50 indicating bearish conditions. This is visually represented by colored circles:
"●" (Filled Circle):
Green: Strong bullish trend (VTR ≥ 80)
Red: Strong bearish trend (VTR ≤ 20)
"◯" (Hollow Circle):
Green: Moderate bullish trend (VTR 65-79)
Red: Moderate bearish trend (VTR 21-35)
"·" (Small Dot):
Green: Weak bullish trend (VTR 55-64)
Red: Weak bearish trend (VTR 36-45)
"○" (Medium Hollow Circle): Neutral conditions (VTR 46-54), shown in gray
In "Both" display mode, the VTR shows both the numerical score (0-100) alongside the appropriate circle symbol.
Enhanced VTR Settings
The Enhanced Volume Trend component offers several advanced customization options:
Adaptive Volume Analysis (volTrendAdaptive):
When enabled, dynamically adjusts volume thresholds based on recent market volatility
Higher volatility periods require proportionally higher volume to generate significant signals
Helps prevent false signals during highly volatile markets
Keep enabled for most trading conditions, especially in volatile markets
Speed of Change Weight (volTrendSpeedWeight, range 0-1):
Controls emphasis on volume acceleration/deceleration rather than absolute levels
Higher values (0.7-1.0): More responsive to new volume trends, better for momentum trading
Lower values (0.2-0.5): Less responsive, better for trend following
Helps identify early volume trends before they fully develop
Momentum Period (volTrendMomentumPeriod, range 2-10):
Defines lookback period for volume change rate calculations
Lower values (2-3): More responsive to recent changes, better for short timeframes
Higher values (7-10): Smoother, better for daily/weekly charts
Directly affects how quickly the indicator responds to new volume patterns
Volatility Filter (volTrendVolatilityFilter):
Adjusts significance of volume by factoring in current price volatility
High volume during high volatility receives less weight
High volume during low volatility receives more weight
Helps distinguish between genuine volume-driven moves and volatility-driven moves
EMA Alignment Weight (volTrendEmaWeight, range 0-1):
Controls importance of EMA alignments in final VTR calculation
Analyzes multiple EMA relationships (5, 10, 21 period)
Higher values (0.7-1.0): Greater emphasis on trend structure
Lower values (0.2-0.5): More focus on pure volume patterns
Display Mode (volTrendDisplayMode):
"Value": Shows only numerical score (0-100)
"Strength": Shows only symbolic representation
"Both": Shows numerical score and symbol together
3. Bollinger Band Squeeze Detection (SQZ)
The BB Squeeze indicator identifies periods of low volatility when Bollinger Bands contract inside Keltner Channels, often preceding significant price movements.
SQZ Visual Indicators
"●" (Filled Circle): Strong squeeze - high probability setup for an impending breakout
Green: Strong squeeze with bullish bias (likely upward breakout)
Red: Strong squeeze with bearish bias (likely downward breakout)
Orange: Strong squeeze with unclear direction
"◯" (Hollow Circle): Moderate squeeze - medium probability setup
Green: With bullish EMA alignment
Red: With bearish EMA alignment
Orange: Without clear directional bias
"-" (Dash): Gray dash indicates no squeeze condition (normal volatility)
The script identifies squeeze conditions through multiple methods:
Bollinger Bands contracting inside Keltner Channels
BB width falling to bottom 20% of recent range (BB width percentile)
Very narrow Keltner Channel (less than 5% of basis price)
Tracking squeeze duration in consecutive bars
Different squeeze strengths are detected:
Strong Squeeze: BB inside KC with tight BB width and narrow KC
Moderate Squeeze: BB inside KC with either tight BB width or narrow KC
No Squeeze: Normal market conditions
4. Breakout Detection System
The script includes two breakout indicators working in sequence:
4.1 Pre-Breakout (PBK) Indicator
Detects potential upcoming breakouts by analyzing multiple factors:
Squeeze conditions lasting 2-3 bars or more
Significant price ranges
Strong volume confirmation
EMA/MACD crossovers
Consistent price direction
PBK Visual Indicators
"●" (Filled Circle): Detected pre-breakout condition
Green: Likely upward breakout (bullish)
Red: Likely downward breakout (bearish)
Orange: Direction not yet clear, but breakout likely
"-" (Dash): Gray dash indicates no pre-breakout condition
The PBK uses sophisticated conditions to reduce false signals including minimum squeeze length, significant price movement, and technical confirmations.
4.2 Breakout (BK) Indicator
Confirms actual breakouts in progress by identifying:
End of squeeze or strong expansion of Bollinger Bands
Volume expansion
Price moving outside Bollinger Bands
EMA crossovers with volume confirmation
MACD crossovers with significant price range
BK Visual Indicators
"●" (Filled Circle): Confirmed breakout in progress
Green: Upward breakout (bullish)
Red: Downward breakout (bearish)
Orange: Unusual breakout pattern without clear direction
"◆" (Diamond): Special breakout conditions (meets some but not all criteria)
"-" (Dash): Gray dash indicates no breakout detected
The BK indicator uses advanced filters for confirmation:
Requires consecutive breakout signals to reduce false positives
Strong volume confirmation requirements (40% above average)
Significant price movement thresholds
Consistency checks between price action and indicators
5. Market Metrics and Analysis
Price Change Percentage (CHG%)
Displays the current percentage change relative to the previous day's close, color-coded green for positive changes and red for negative changes.
Average Daily Range (ADR%)
Calculates the average daily percentage range over a specified period (default 20 days), helping traders gauge volatility and set appropriate price targets.
Average True Range (ATR)
Shows the Average True Range value, a volatility indicator developed by J. Welles Wilder that measures market volatility by decomposing the entire range of an asset price for that period.
Relative Strength Index (RSI)
Displays the standard 14-period RSI, a momentum oscillator that measures the speed and change of price movements on a scale from 0 to 100.
6. External Market Indicators
QQQ Change
Shows the percentage change in the Invesco QQQ Trust (tracking the Nasdaq-100 Index), useful for understanding broader tech market trends.
UVIX Change
Displays the percentage change in UVIX, a volatility index, providing insight into market fear and potential hedging activity.
BTC-USD
Shows the current Bitcoin price from Coinbase, useful for traders monitoring crypto correlation with equities.
Market Breadth (BRD)
Calculates the percentage difference between ATHI.US and ATLO.US (high vs. low securities), indicating overall market direction and strength.
7. Session Analysis and Volume Direction
Session Detection
The script accurately identifies different market sessions:
Pre-market: 4:00 AM to 9:30 AM
Regular market: 9:30 AM to 4:00 PM
After-hours: 4:00 PM to 8:00 PM
Closed: Outside trading hours
This detection works on any timeframe through careful calculation of current time in seconds.
Buy/Sell Volume Direction
The script analyzes buying and selling pressure by:
Counting up volume when close > open
Counting down volume when close < open
Tracking accumulated volume within the day
Calculating intraday pressure (up volume minus down volume)
Enhanced AVOL Calculation
The improved AVOL calculation works in all timeframes by:
Estimating typical pre-market and after-hours volume percentages
Combining yesterday's after-hours with today's pre-market volume
Calculating this as a percentage of the 21-day average volume
Determining buying/selling pressure by analyzing after-hours and pre-market price changes
Color-coding results: green for buying pressure, red for selling pressure
This calculation is particularly valuable because it works consistently across any timeframe.
Customization Options
Display Settings
The dashboard has two customizable tables: Volume Table and Metrics Table, with positions selectable as bottom_left or bottom_right.
All metrics can be individually toggled on/off:
Pre-market data (PVOL, P$VOL, PRVOL, PCHG%)
Volume data (AVOL, RVOL Day, RVOL 90D, Volume, SEED_YASHALGO_NSE_BREADTH:VOLUME )
Price metrics (ADR%, ATR, RSI, Price Change%)
Market indicators (QQQ, UVIX, Breadth, BTC-USD)
Analysis indicators (Volume Trend, BB Squeeze, Pre-Breakout, Breakout)
These toggle options allow traders to customize the dashboard to show only the metrics they find most valuable for their trading style.
Table and Text Customization
The dashboard's appearance can be customized:
Table background color via tableBgColor
Text color (White or Black) via textColorOption
The indicator uses smart formatting for volume and price values, automatically adding appropriate suffixes (K, M, B) for readability.
MACD Configuration for VTR
The Volume Trend calculation incorporates MACD with customizable parameters:
Fast Length: Controls the period for the fast EMA (default 3)
Slow Length: Controls the period for the slow EMA (default 9)
Signal Length: Controls the period for the signal line EMA (default 5)
MACD Weight: Controls how much influence MACD has on the volume trend score (default 0.3)
These settings allow traders to fine-tune how momentum is factored into the volume trend analysis.
Bollinger Bands and Keltner Channel Settings
The Bollinger Bands and Keltner Channels used for squeeze detection have preset (hidden) parameters:
BB Length: 20 periods
BB Multiplier: 2.0 standard deviations
Keltner Length: 20 periods
Keltner Multiplier: 1.5 ATR
These settings follow standard practice for squeeze detection while maintaining simplicity in the user interface.
Practical Trading Applications
Complete Trading Strategies
1. Squeeze Breakout Strategy
This strategy combines multiple components of the indicator:
Wait for a strong squeeze (SQZ showing ●)
Look for pre-breakout confirmation (PBK showing ● in green or red)
Enter when breakout is confirmed (BK showing ● in same direction)
Use VTR to confirm volume supports the move (VTR ≥ 65 for bullish or ≤ 35 for bearish)
Set profit targets based on ADR (Average Daily Range)
Exit when VTR begins to weaken or changes direction
2. Volume Divergence Strategy
This strategy focuses on the volume trend relative to price:
Identify when price makes a new high but VTR fails to confirm (divergence)
Look for VTR to show weakening trend (● changing to ◯ or ·)
Prepare for potential reversal when SQZ begins to form
Enter counter-trend position when PBK confirms reversal direction
Use external indicators (QQQ, BTC, Breadth) to confirm broader market support
3. Pre-Market Edge Strategy
This strategy leverages pre-market data:
Monitor AVOL for unusual pre-market activity (significantly above 100%)
Check pre-market price change direction (PCHG%)
Enter position at market open if VTR confirms direction
Use SQZ to determine if volatility is likely to expand
Exit based on RVOL declining or price reaching +/- ADR for the day
Market Context Integration
The indicator provides valuable context for trading decisions:
QQQ change shows tech market direction
BTC price shows crypto market correlation
UVIX change indicates volatility expectations
Breadth measurement shows market internals
This context helps traders avoid fighting the broader market and align trades with overall market direction.
Timeframe Optimization
The indicator is designed to work across different timeframes:
For day trading: Focus on AVOL, VTR, PBK/BK, and use shorter momentum periods
For swing trading: Focus on SQZ duration, VTR strength, and broader market indicators
For position trading: Focus on larger VTR trends and use EMA alignment weight
Advanced Analytical Components
Enhanced Volume Trend Score Calculation
The VTR score calculation is sophisticated, with the base score starting at 50 and adjusting for:
Price direction (up/down)
Volume relative to average (high/normal/low)
Volume acceleration/deceleration
Market conditions (bull/bear)
Additional factors are then applied, including:
MACD influence weighted by strength and direction
Volume change rate influence (speed)
Price/volume divergence effects
EMA alignment scores
Volatility adjustments
Breakout strength factors
Price action confirmations
The final score is clamped between 0-100, with values above 50 indicating bullish conditions and below 50 indicating bearish conditions.
Anti-False Signal Filters
The indicator employs multiple techniques to reduce false signals:
Requiring significant price range (minimum percentage movement)
Demanding strong volume confirmation (significantly above average)
Checking for consistent direction across multiple indicators
Requiring prior bar consistency (consecutive bars moving in same direction)
Counting consecutive signals to filter out noise
These filters help eliminate noise and focus on high-probability setups.
MACD Enhancement and Integration
The indicator enhances standard MACD analysis:
Calculating MACD relative strength compared to recent history
Normalizing MACD slope relative to volatility
Detecting MACD acceleration for stronger signals
Integrating MACD crossovers with other confirmation factors
EMA Analysis System
The indicator uses a comprehensive EMA analysis system:
Calculating multiple EMAs (5, 10, 21 periods)
Detecting golden cross (10 EMA crosses above 21 EMA)
Detecting death cross (10 EMA crosses below 21 EMA)
Assessing price position relative to EMAs
Measuring EMA separation percentage
Recent Enhancements and Evolution
Version 5.2 includes several improvements:
Enhanced AVOL to show buying/selling direction through color coding
Improved VTR with adaptive analysis based on market conditions
AVOL display now works in all timeframes through sophisticated estimation
Removed animal symbols and streamlined code with bright colors for better visibility
Improved anti-false signal filters throughout the system
Optimizing Indicator Settings
For Different Market Types
Range-Bound Markets:
Lower EMA Alignment Weight (0.2-0.4)
Higher Speed of Change Weight (0.8-1.0)
Focus on SQZ and PBK signals for breakout potential
Trending Markets:
Higher EMA Alignment Weight (0.7-1.0)
Moderate Speed of Change Weight (0.4-0.6)
Focus on VTR strength and BK confirmations
Volatile Markets:
Enable Volatility Filter
Enable Adaptive Volume Analysis
Lower Momentum Period (2-3)
Focus on strong volume confirmation (VTR ≥ 80 or ≤ 20)
For Different Asset Classes
Equities:
Standard settings work well
Pay attention to AVOL for gap potential
Monitor QQQ correlation
Futures:
Consider higher Volume/RVOL weight
Reduce MACD weight slightly
Pay close attention to SQZ duration
Crypto:
Higher volatility thresholds may be needed
Monitor BTC price for correlation
Focus on stronger confirmation signals
Integrated Visual System for Trading Decisions
The colored circle indicators create an intuitive visual system for quick market assessment:
Progression Sequence: SQZ (Squeeze) → PBK (Pre-Breakout) → BK (Breakout)
This sequence often occurs in order, with the squeeze leading to pre-breakout conditions, followed by an actual breakout.
VTR (Volume Trend): Provides context about the volume supporting these movements.
Color Coding: Green for bullish conditions, red for bearish conditions, and orange/gray for neutral or undefined conditions.

Statistical Reliability Index (SRI)Statistical Reliability Index (SRI)
The Statistical Reliability Index (SRI) is a professional financial analysis tool designed to assess the statistical stability and reliability of market conditions. It combines advanced statistical methods to gauge whether current market trends are statistically consistent or prone to erratic behavior. This allows traders to make more informed decisions when navigating trending and choppy markets.
Key Concepts:
1. Extrapolation of Cumulative Distribution Functions (CDF)
What is CDF?
A Cumulative Distribution Function (CDF) is a statistical tool that models the probability of a random variable falling below a certain value.
How it’s used in SRI:
The SRI utilizes the 95th percentile CDF of recent returns to estimate the likelihood of extreme price movements. This helps identify when a market is experiencing statistically significant changes, crucial for forecasting potential breakouts or breakdowns.
Weight in SRI:
The weight of the CDF extrapolation can be adjusted to emphasize its impact on the overall reliability index, allowing customization based on the trader's preference for tail risk analysis.
2. Bias Factor (BF)
What is the Bias Factor?
The Bias Factor measures the ratio of the current market price to the expected mean price calculated over a defined period. It represents the deviation from the typical price level.
How it’s used in SRI:
A higher bias factor indicates that the current price significantly deviates from the historical average, suggesting a potential mean reversion or trend exhaustion.
Weight in SRI:
Adjusting the Bias Factor weight lets users control how much this deviation influences the SRI, balancing between momentum trading and mean reversion strategies.
3. Coefficient of Variation (CV)
What is CV?
The Coefficient of Variation (CV) is a statistical measure that expresses the ratio of the standard deviation to the mean. It indicates the relative variability of asset returns, helping gauge the risk-to-return consistency.
How it’s used in SRI:
A lower CV indicates more stable and predictable price behavior, while a higher CV signals increased volatility. The SRI incorporates the inverse of the normalized CV to reflect price stability positively.
Weight in SRI:
By adjusting the CV weight, users can prioritize consistent price movements over erratic volatility, aligning the indicator with risk tolerance and strategy preferences.
Interpreting the SRI:
1. SRI Plot:
The SRI plot dynamically changes color to reflect market conditions:
Aqua Line: Indicates uptrend stability, signaling statistically consistent upward movements.
Fuchsia Line: Indicates downtrend stability, where statistically reliable downward movements are present.
The overlay background shifts between colors:
Aqua Background: Signifies statistical stability, where trends are historically consistent.
Fuchsia Background: Indicates statistical instability, often associated with trend uncertainty.
Yellow Background: Marks choppy periods, where statistical data suggests that market conditions are not conducive to reliable trading.
2. SRI Volatility Plot:
Displays the volatility of the SRI itself to detect when the indicator is stable or unstable:
Blue Area Fill: Signifies that the SRI is stable, indicating trending conditions.
Yellow Area Fill: Represents choppy or unstable SRI movements, suggesting sideways or unreliable market conditions.
A Chop Threshold Line (dotted yellow) highlights the maximum acceptable SRI volatility before the market is considered too unpredictable.
3. Stability Assessment:
Stable Trend (No Chop):
The SRI is smooth and consistent, often accompanied by aqua or fuchsia lines.
Volatility remains below the chop threshold, indicating a low-risk, trend-following environment.
Chop Mode:
The SRI becomes erratic, and the volatility plot spikes above the threshold.
Marked by a yellow shaded background, indicating uncertain and non-trending conditions.
[Trend Identification:
Use the color-coded SRI line and background to determine uptrend or downtrend reliability.
Be cautious when the SRI volatility plot shows yellow, as this signals trading conditions may not be reliable.
Practical Use Cases:
Trend Confirmation:
Utilize the SRI plot color and background to confirm whether a detected trend is statistically reliable.
Chop Mode Filtering:
During yellow chop periods, it is advisable to reduce trading activity or adopt range-bound strategies.
Strategy Filter:
Combine the SRI with trend-following indicators (like moving averages) to enhance entry and exit accuracy.
Volatility Monitoring:
Pay attention to the SRI volatility plot, as spikes often precede erratic price movements or trend reversals.
Disclaimer:
The Statistical Reliability Index (SRI) is a technical analysis tool designed to aid in market stability assessment and trend validation. It is not intended as a standalone trading signal generator. While the SRI can help identify statistically reliable trends, it is essential to incorporate additional technical and fundamental analysis to make well-informed trading decisions.
Trading and investing involve substantial risk, and past performance does not guarantee future results. Always use risk management practices and consult with a financial advisor to tailor strategies to your individual risk profile and objectives.

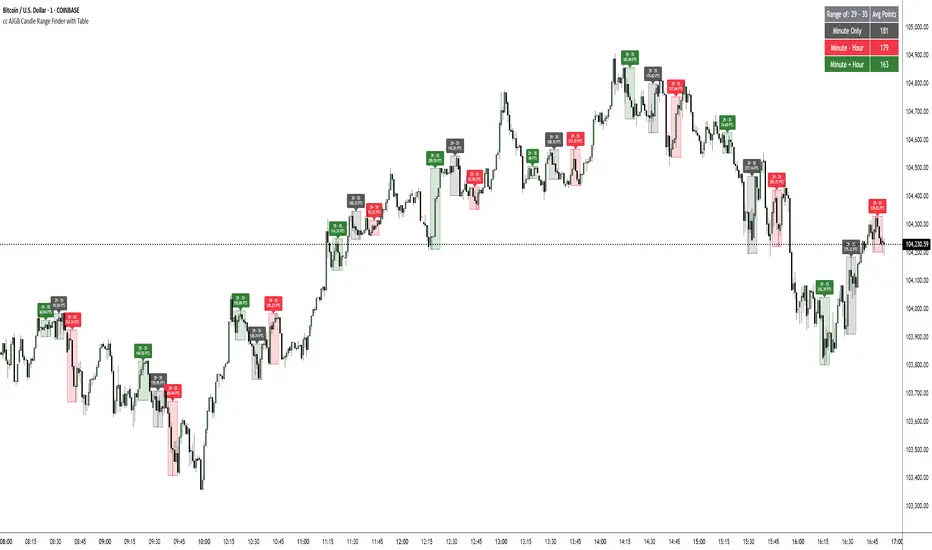
cc AJGB Candle Range Finder with TableOverview:
The "cc AJGB Candle Range Finder with Table" is a versatile Pine Script indicator designed to identify and visualize price ranges within the 1 minute charts based on UTC+2 Time Zone. Unlike traditional range indicators, it offers three unique calculation methods to define ranges based on minute and hour interactions, displays ranges as boxes with labeled point values, and summarizes average range sizes in a customizable table. This tool is ideal for analyzing price ranges of specific time based ranges.
Features:
Customizable Time Range: Users specify a start and end minute (0-59) to define the range period (e.g., 29th to 35th minute).
Three Calculation Methods:
Minute Only: Uses the minute of each bar to identify ranges (e.g., matches user-specified minutes).
Minute - Hour: Adjusts the minute by subtracting the hour, allowing for dynamic range detection across hourly cycles.
Minute + Hour: Combines minute and hour values for a unique range calculation, useful for specific intraday patterns.
Visual Output: Draws boxes around detected ranges, with labels showing the start/end minutes and range size in points.
Summary Table: Displays the average range size (in points) for each method, with customizable position, colors, and text size.
How It Works:
The indicator evaluates each bar’s timestamp in (UTC+2 ONLY) to match user-specified minutes using one or more selected methods. When a start minute is detected, it tracks the high and low prices until the end minute, drawing a box to highlight the range and labeling it with the range size in points. A table summarizes the average range size for each method, helping traders assess typical price movements during the specified period.
Market Analysis: Compare range sizes across different methods to understand intraday volatility patterns.
Settings Customization: Adjust colors, table position, and label sizes to suit your chart preferences.
Settings:
Range to Find: Set start and end minutes.
Range Selection: Enable/disable each method and customize colors.
Range Label Size: Choose label size (Tiny to Huge).
Table Settings: Configure table position (Top, Bottom, Left, Right), sub-position, text size, and colors.
Notes:
Only works on 1 minute charts
The indicator works best using Start Times that are lower than the End Times.
Ensure the chart is set to UTC+2 Time Zone for accurate range detection.
Why It’s Unique:
Unlike standard range indicators that focus on sessions or fixed periods, this tool allows precise minute-based range detection with three distinct calculation methods, offering flexibility for data gathering. The interactive table provides quick insights into average range sizes.
Linear Regression Volume | Lyro RSLinear Regression Volume | Lyro RS
⚠️Disclaimer⚠️
Always combine this indicator with other forms of analysis and risk management. Please do your own research before making any trading decisions.
The LR Volume | 𝓛𝔂𝓻𝓸 𝓡𝓢 indicator blends linear regression with volume-adjusted moving average s to dynamically outline price equilibrium and trend intensity. By integrating volume into its regression model, it highlights meaningful price movement relative to trading activity.
📌 How It Works:
Volume-Weighted Regression Baseline
Price is filtered through one of four volume-adjusted moving averages (SMA, RMA, HMA, ALMA) before being passed through a linear regression model, forming a dynamic fair value line.
Deviation Bands
The indicator plots 1x, 2x, and 3x standard deviation zones above and below the baseline, helping identify potential extremes, volatility spikes, and mean reversion areas.
Slope-Based Color Logic
The baseline and fill areas are dynamically colored:
- 🟢 Green for positive slope (uptrend)
- 🔴 Red for negative slope (downtrend)
- ⚪ Gray for neutral movement
⚙️ Inputs & Options:
Regression Length – Controls how many bars are used in the moving average and regression calculation.
Deviation Multiplier – Adjusts the width of the bands surrounding the regression baseline.
MA Type – Choose from 4 types:
SMA (Simple Moving Average)
RMA (Relative Moving Average)
HMA (Hull Moving Average)
ALMA (Arnaud Legoux Moving Average)
Band Colors – Customizable upper/lower band colors to match your visual style.
🔔 Alerts:
Long Signal – Triggers when the regression slope turns positive.
Short Signal – Triggers when the regression slope turns negative.

Money Flow: In & Out Detector[THANHCONG]Indicator Name:
Money Flow: In & Out Detector
Indicator Description:
The Money Flow: In & Out Detector indicator uses technical indicators such as RSI (Relative Strength Index), MFI (Money Flow Index), and volume analysis to determine money inflow and outflow in the market.
This indicator helps traders identify changes in money flow, allowing them to detect buy and sell signals based on the combination of the following factors:
RSI > 50 and MFI > 50: Money inflow, indicating a buy signal.
RSI < 50 and MFI < 50: Money outflow, indicating a sell signal.
Volume increase/decrease relative to the average: Identifies strong market behavior changes.
Adjustable Parameters:
RSI Length: The number of periods to calculate the RSI (default is 14).
MFI Length: The number of periods to calculate the MFI (default is 14).
Volume MA Length: The number of periods to calculate the moving average of volume (default is 20).
Volume Increase/Decrease (%): The percentage threshold for volume change compared to the moving average (default is 20%).
Look Back Period: The number of periods used to identify peaks and troughs (default is 20).
How to Use the Indicator:
Money Inflow: When both RSI and MFI are above 50, and volume increases significantly relative to the moving average, the indicator shows a Buy signal.
Money Outflow: When both RSI and MFI are below 50, and volume decreases significantly relative to the moving average, the indicator shows a Sell signal.
Identifying Peaks and Troughs: The indicator also helps identify market peaks and troughs based on technical conditions.
Note:
This indicator assists in decision-making, but does not replace comprehensive market analysis.
Use this indicator in conjunction with other technical analysis methods to increase the accuracy of trade signals.
Steps for Publishing the Indicator on TradingView:
Log in to TradingView:
Go to TradingView and log into your account.
Access Pine Script Editor:
Click on Pine Editor from the menu under the chart.
Paste your Pine Script® code into the editor window.
Check the Source Code:
Ensure your code is error-free and running correctly.
Review the entire source code and add the MPL-2.0 license notice if necessary.
Save and Publish:
After testing and confirming the code works correctly, click Add to Chart to try the indicator on your chart.
If satisfied with the result, click Publish Script at the top right of the Pine Editor.
Provide a name for the indicator and then enter the detailed description you’ve prepared.
Ensure you specify the MPL-2.0 license in the description if required.
Choose the Access Type:
You can choose either Public or Private access for your indicator depending on your intention.
Submit for Publication:
Wait for TradingView to review and approve your indicator. Typically, this process takes a few working days for verification and approval.
User Guide:
You can share detailed instructions for users on how to use the indicator on TradingView, including how to adjust the parameters and interpret the signals. For example:
Set RSI Length: Experiment with different RSI Length values to find the sensitivity that suits your strategy.
Interpreting In/Out Signals: When there is strong money inflow (In), consider entering a buy order. When there is strong money outflow (Out), consider selling.

CorrelationMulti-Timeframe Correlation Indicator
This Pine Script indicator measures the correlation between the current symbol and a reference symbol (default: GLD) across three different timeframes. It provides traders with valuable insights into how assets move in relation to each other over short, medium, and long-term periods.
Key Features
Multiple Timeframe Analysis: Calculates correlation coefficients over three customizable periods (default: 20, 50, and 200 bars)
Visual Reference Lines: Displays horizontal lines at +1, 0, and -1 to indicate perfect positive correlation, no correlation, and perfect negative correlation
Color-Coded Outputs: Shows short-term correlation in green, medium-term in yellow, and long-term in red for easy visual interpretation
Understanding Correlation
The correlation coefficient measures the statistical relationship between two data series, ranging from -1 to +1:
+1: Perfect positive correlation (both assets move together in the same direction)
0: No correlation (movements are random and independent)
-1: Perfect negative correlation (assets move in opposite directions)
How To Use This Indicator
Market Relationships: Identify how strongly your current asset correlates with the reference symbol
Diversification Analysis: Find assets with negative correlations to build a diversified portfolio
Divergence Opportunities: Watch for changes in correlation patterns that might signal trading opportunities
Trend Confirmation: Use correlation with benchmark assets to confirm broader market trends
Customization Options
Reference Symbol: Change the default GLD to any other symbol you want to compare against
Period Lengths: Adjust the short, medium, and long timeframes to match your trading strategy and timeframe
This indicator helps traders make more informed decisions by understanding the interrelationships between different assets across various timeframes, potentially improving portfolio construction and risk management strategies.

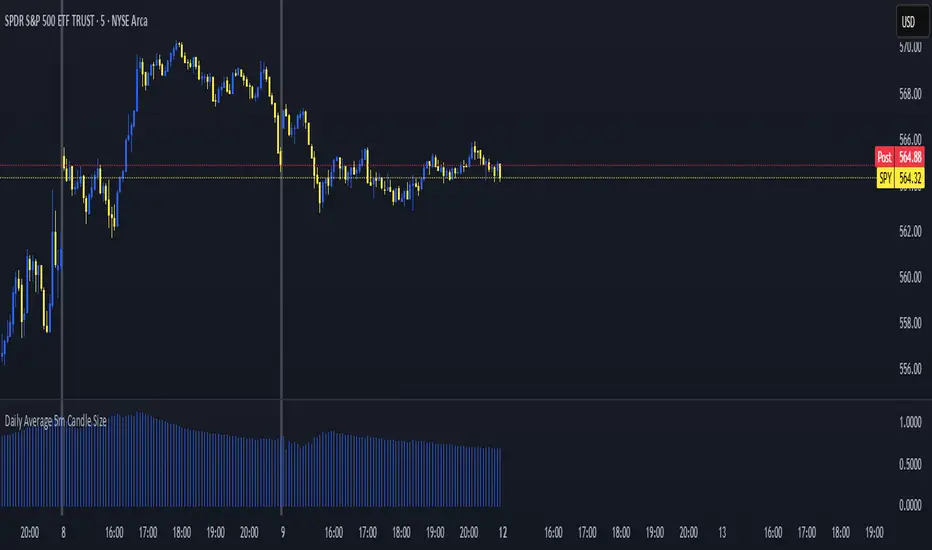
Daily Average 5m Candle SizeThis indicator measures the average size of each 5 min candle then works out the end of day average for you. Very important for profit targets and stops